Wednesday, 22 July 2026

Formula 1 2026 - Belgian Grand Prix

 I had a moment of revelation at the start of this grand prix - around about when Leclerc and Hamilton moved past Verstappen and Russell - this Ferrari car isn't bad. It's not as good as the Mercedes, but the Mercedes is a good car, even if it's not as good as *that* rocket ship Mercedes or that Red Bull. See also sort of keeping up with the Mercedes cars after they overtake.


I'm not quite sure what to do with the information.

Mostly because having a good car isn't enough, you need good drivers (we've got that) and a solid strategy team ... which Ferrari haven't got. This time it was Hamilton who was affected by strategy gremlins. Now I am guessing they had to do some quick thinking following the 5 second time penalty but they didn't seem to have communicated the revised plan to their driver which is a really quick way of losing the driver's trust.

Hamilton did seem to be having a day of it; between the penalty and the pit-stop incident and the "not doing what he wanted doing to his front wing" and ... Thankfully the pit crew member appears to be fine.

I am of the camp that think Hamilton got walloped with a penalty where Leclerc didn't because Russell ended up out while Piastri managed to get the car to the finish.

As to other non-Ferrari matters (other than Bottas holding up Leclerc to allow Antonelli to catch him and my tin foil hat insisting it was deliberate), Hadjar and Verstappen appear to be the pairing Red Bull have been looking for for years. Not sure if that's because the way the cars are set up under the current regulations doesn't suit Verstappen as well as previous cars or Hadjar is that good (I tend towards "Hadjar is that good" but I acknowledge my biases). Racing Bull and Alpine seem to be coming along nicely, as do Audi. For Aston Martin, the only way is up. I'm intrigued about their update coming at Hungary.

Saturday, 18 July 2026

World Cup 2026 - Final Network Visualisation

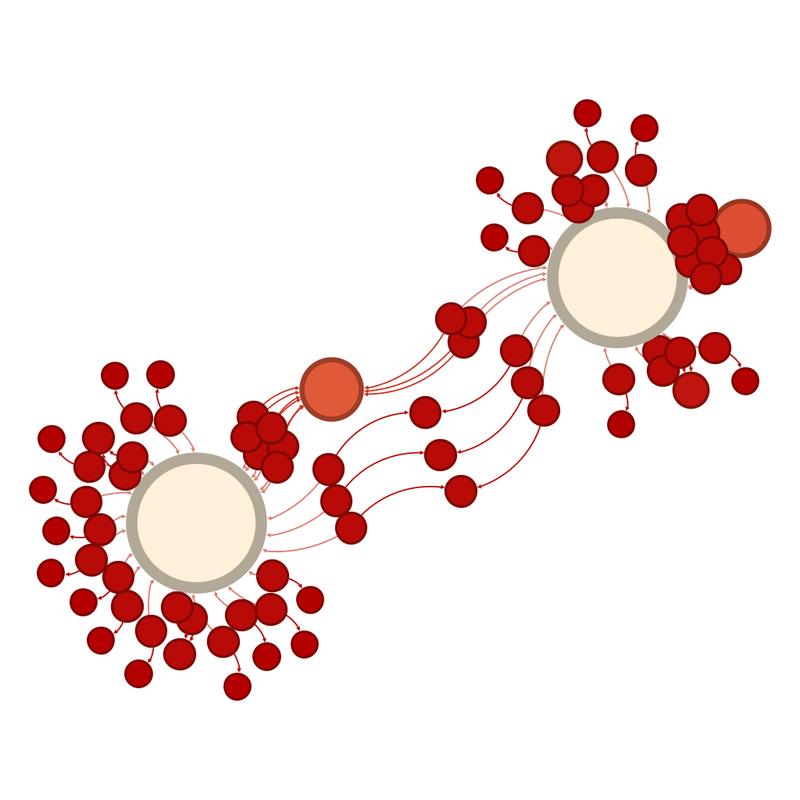
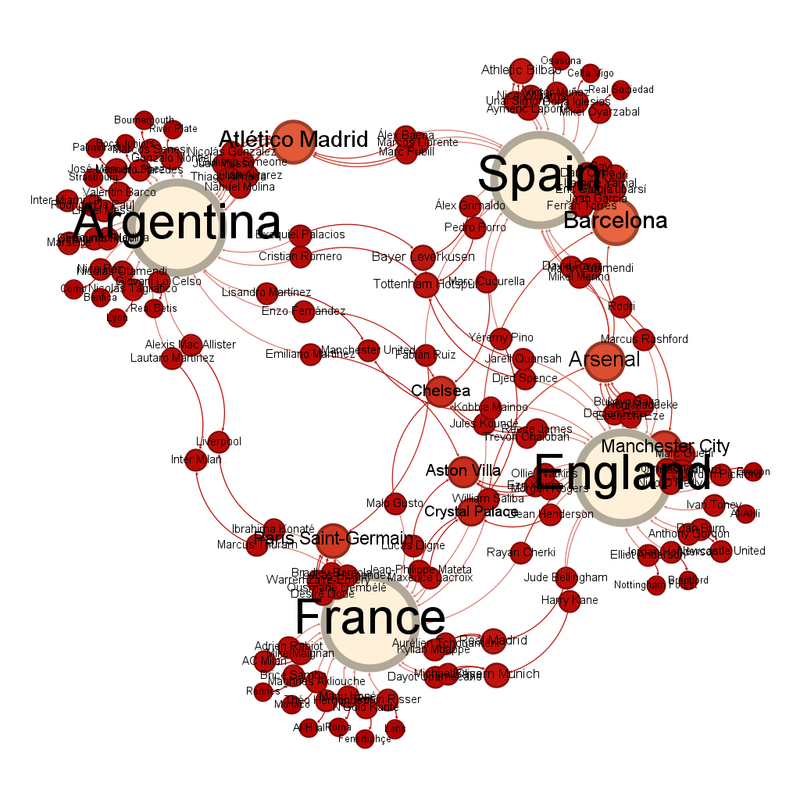
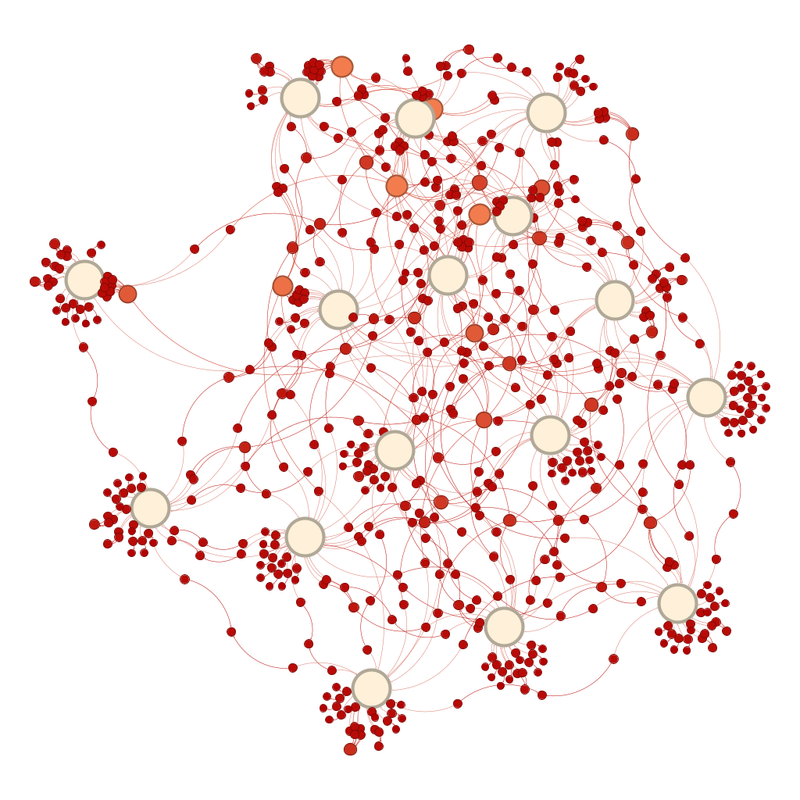
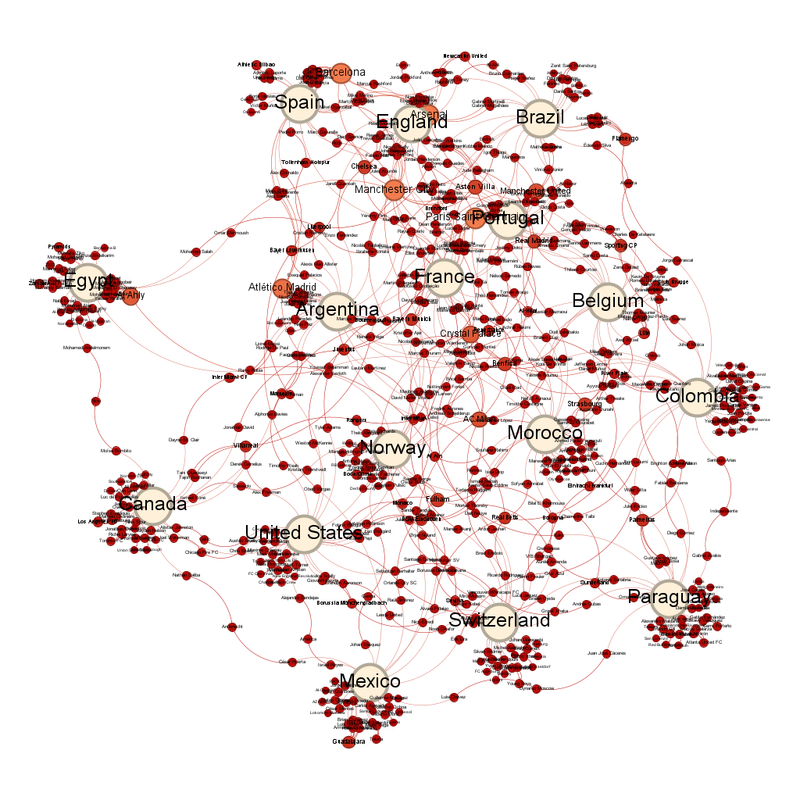
The unlabelled network graph looks like this: Unlabelled network graph of the teams in the final.  Smaller circles representing smaller numbers of interactions are red and the colour moves towards creamy white as the circles get larger.  Because we are down to two teams, the two biggest circles are pretty much equidistant. Even without the labels, you can probably guess the big circles are Spain and Argentina ;) 

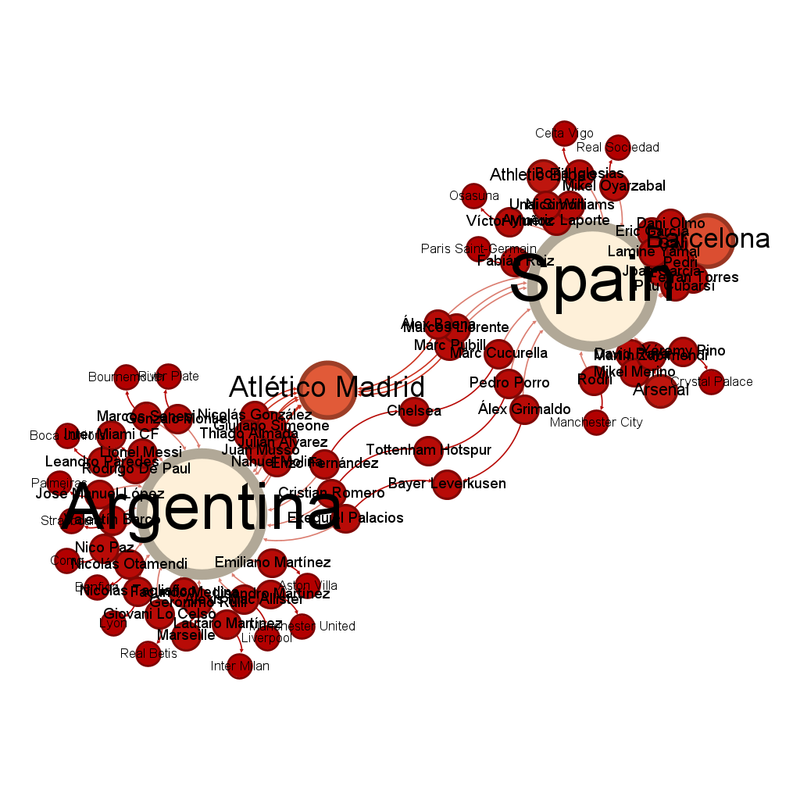
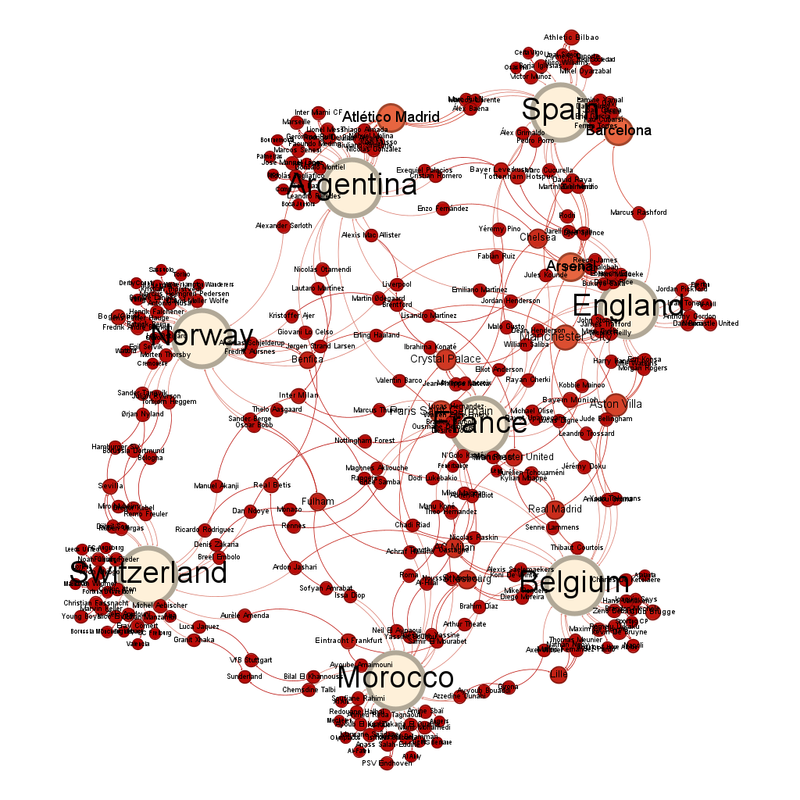
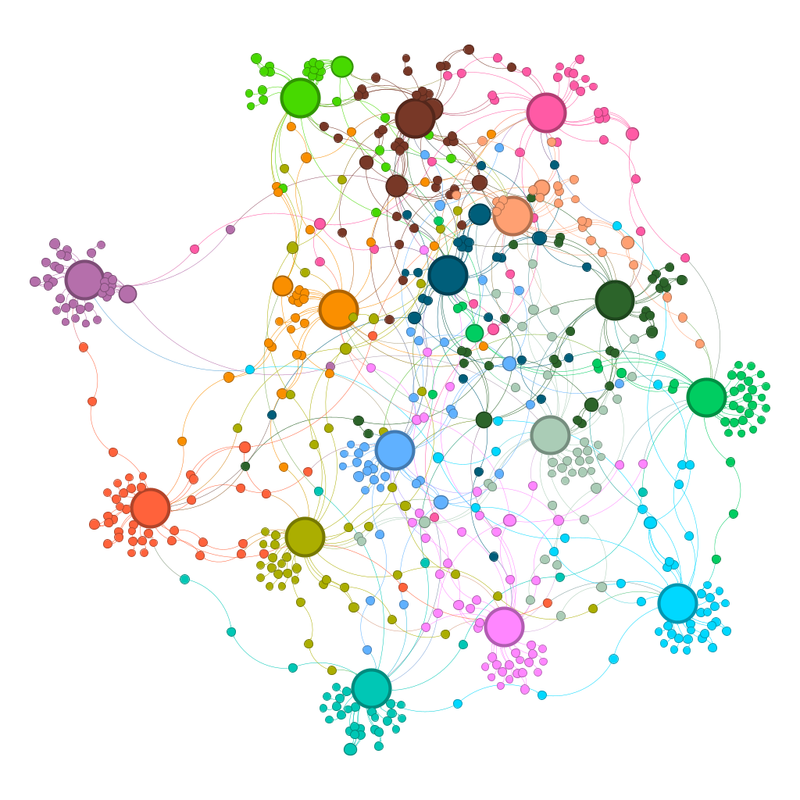
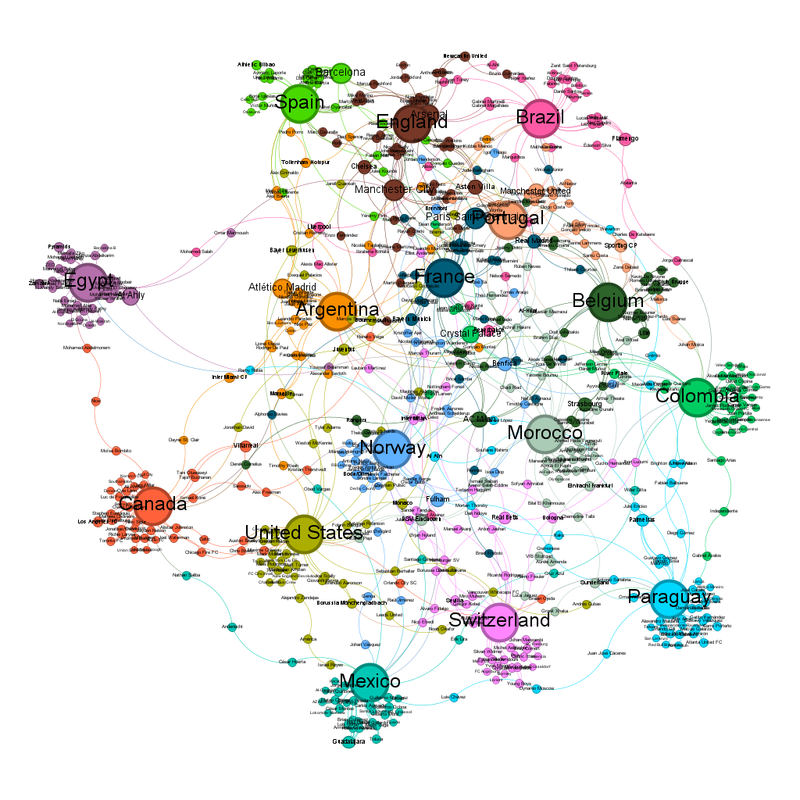
The labelled graph looks like this: Labelled network graph of the teams in the final.  Smaller circles representing smaller numbers of interactions are red and the colour moves towards creamy white as the circles get larger.  The large circle on the left is Argentina, the circle on the right is Spain.  There are large circles for Atlético Madrid and Barcelona. 

It's the battle of the Atlético Madrid players! 

Atlético Madrid have 9 players left, 3 playing for Spain, 6 for Argentina. 

Barcelona have 8, but they all play for Spain. 

Arsenal and Athletic Bilbao are next, with 3 players each. All 6 of those players play for Spain. 

Atlético Madrid, Chelsea, Tottenham Hotspur and Bayer Leverkusen have players on both teams. 

Chelsea, somehow, are the club team closest to the centre of the diagram. 

No prediction at this stage, the two teams are understandably equidistant.

Friday, 17 July 2026

Are the scrutineers picking on my driver? - Update after the Austrian Grand Prix

Some interesting points from the underlying data: The Austrian GP featured the first test where the check said "all classified cars" rather than all cars, or giving the number of the car tested. It was the steering wheel test. I have been assuming that "all cars" meant all cars entered. I think the wording of this check supports that but I want to give that caveat on all this data. 

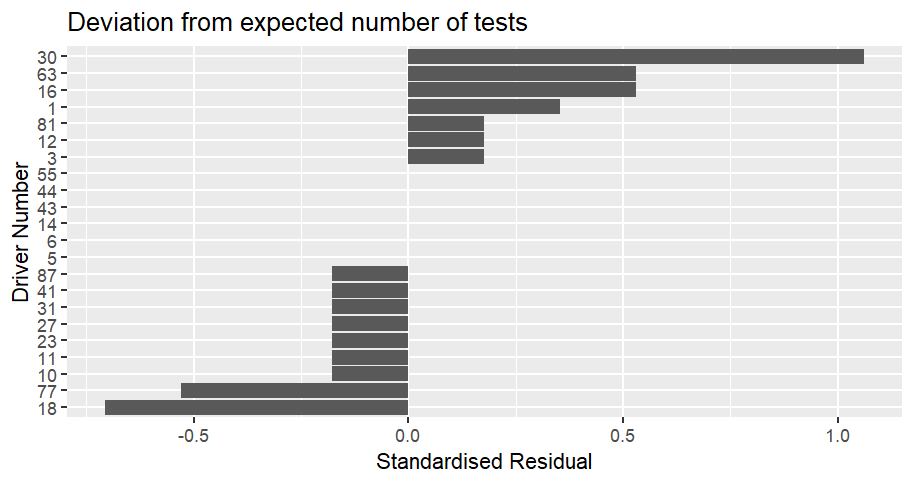
The Austrian GP race scrutineering itself: Bar chart showing how often cars were scrutinized compared to the expected number at the Austrian Grand Prix.  The values are displayed as a standardised residual.  Car 30 (Lawson) is the most over-scrutinized compared to expected, with a value of 1.06.  He is followed by car 16 (Leclerc) and car 63 (Russell) with a value of 0.53.  Car 18 (Stroll) is the most under-scrutinized compared to expected with a value of -0.71.  He is followed by car 77 (Bottas) with a value of -0.53.  Cars 87 (Piastri), 41 (Lindblad), 31 (Ocon), 27 (Hulkenberg), 23 (Albon), 11 (Perez) and 10 (Gasly) are next at -0.18.  6 cars were tested exactly as much as expected (Bortoleto, Hadjar, Alonso, Colapinto, Hamilton and Sainz jnr. 

No, I don't know what Liam Lawson did to the scrutineers. 

Obviously, it's not that extreme, because his standard residual of 1.06 doesn't hit the value of 2 that suggests significance but that's a lot of tests on one car. 

The difference from expected is not statistically significant with an χ² of 2.88. 

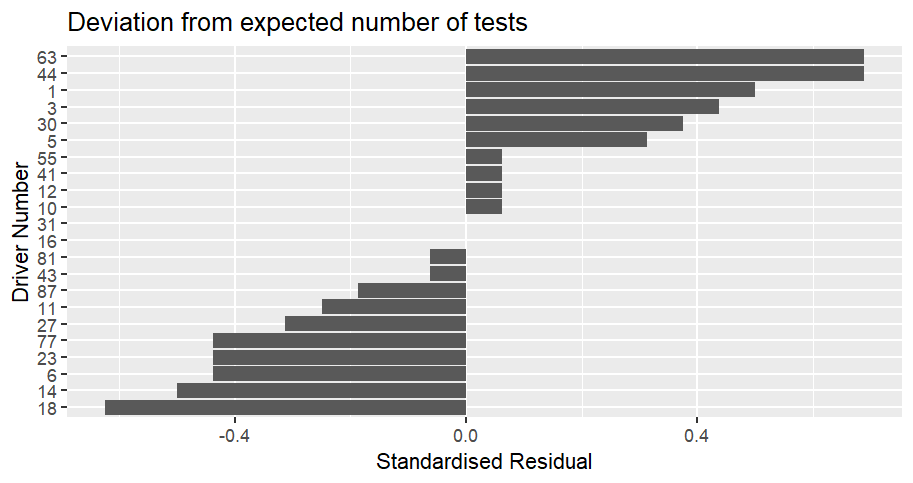
Season to date: Bar chart showing how often cars were scrutinized compared to the expected number for the season to date, up to the Austrian Grand Prix.  The values are displayed as a standardised residual.  Cars 63 (Russell) and 44 (Hamilton) are the most over-scrutinized compared to expected, with a value of 0.69.  Then comes car 1 (Norris) at 0.5.  Cars 18 (Stroll) is the least tested at -0.63, then 14 (Alonso) at -0.5 then 6 (Hadjar), 23 (Albon) and 77 (Bottas) at -0.44.  Cars 16 (Leclerc) and 31 (Ocon) have been tested the expected number of times. 

The difference from expected is not statistically significant with an χ² of 3.06. 

The top 3 most over-scrutinized (Russell, Hamilton and Norris) make some sort of fits with their performance, because they are 3 of the top 5 at this point of the season. 

Similarly, two of the bottom 3 make sense, because the Aston Martins of Stroll and Alonso have not been going long distances so might miss some of the post-race tests, ditto for Bottas and Albon who have retired from half the races and a quarter of the races respectively. Hadjar being so low down still makes no sense, he's only not completed 2 races but all but one of the rest of the races he's been in the top 10. It's getting to the point where I want to triple check all my numbers, he's that low. 

For the British Grand Prix results, I'm going to be looking for that random top 10 finisher check, providing there are at least 15 finishers (which *spoiler* there were). If it doesn't happen, I may have to conclude there is no pattern.

Monday, 13 July 2026

World Cup 2026 - Semifinal Network Visualisation

I have listened to L's editorial guidance and am posting the post with a deadline. Austrian and British Grand Prix scrutineering posts are in the works, as is the first of the weekly Tour de France posts. I am making no promises on timelines because a work project is stealing my time. 

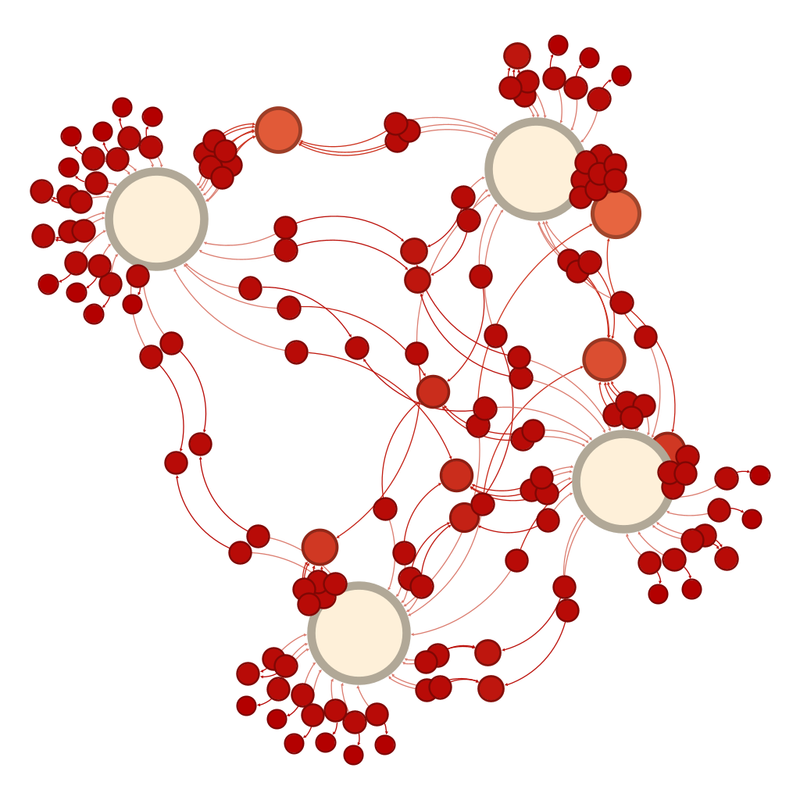
We're down to four teams and the network graph looks like this. Unlabelled network graph of the teams in the quarterfinals.  Smaller circles representing smaller numbers of interactions are red and the colour moves towards creamy white as the circles get larger.  Three of the teams are sort of together in the centre right.  One sticks out slightly to the right. 

The teams are close together, but one sticks out. Labelled network graph of the teams in the quarterfinals.  Smaller circles representing smaller numbers of interactions are red and the colour moves towards creamy white as the circles get larger.  Three of the teams (England, Spain and France) are sort of together in the centre right.  One, Argentina, sticks out slightly to the right. 
Sort of understandably, being as Argentina is on a different continent to the other finalists, they are the team slightly further away from the others. 

The thing I find intriguing is that each national team has one club team close to it, because that club team provides a lot of national team representatives. For Argentina, it is Atlético Madrid (my heart belongs to Diego Simeone), England have Manchester City, France have Paris Saint Germain and Spain have Barcelona. 

It shows the financial strength of European football that the club team with the most players playing for Argentina is Atlético Madrid, not a team closer to home. 

The club teams with the most representatives left are Barcelona with 10, Atlético Madrid with 9 and Arsenal with 8. 

England are just about the team closest to the centre, with Chelsea the club team closest. 

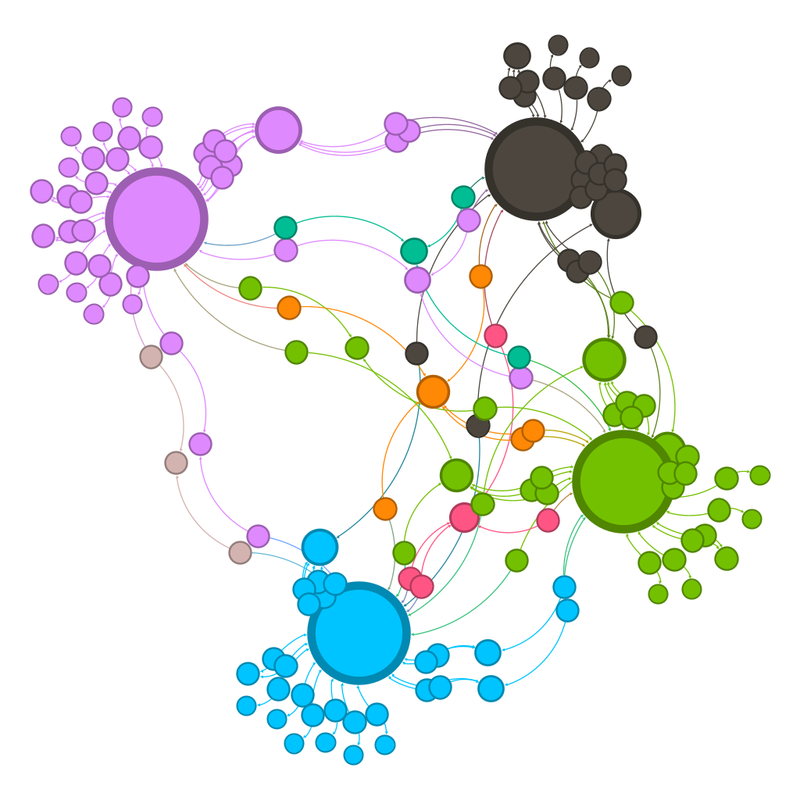
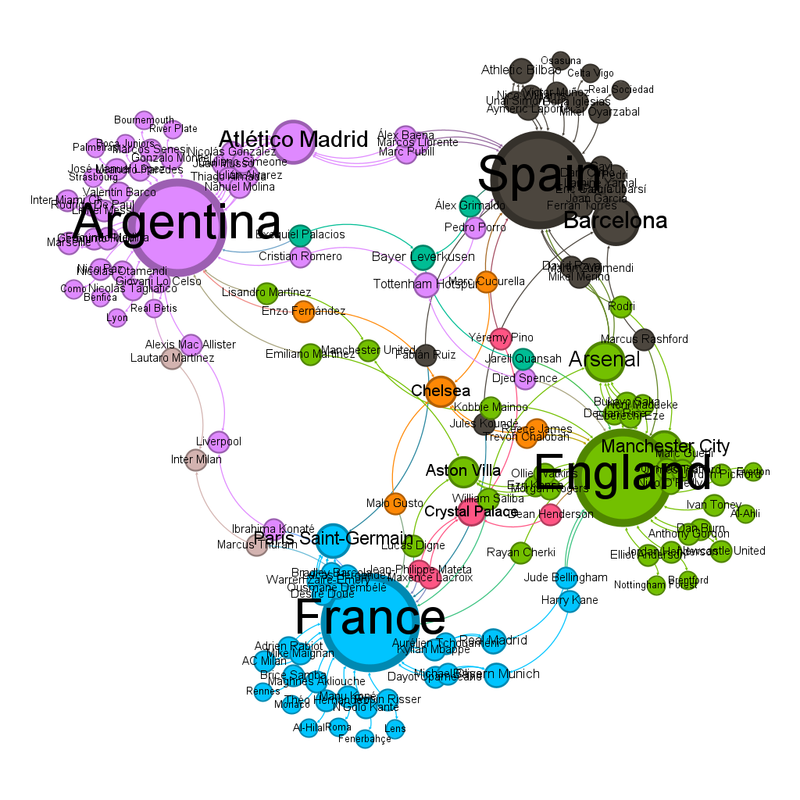
There's something interesting going on in the community view. Although there are only 4 teams left, there are 8 communities. The same diagram as before, but coloured by community.  The eight colours are four large circles, dark grey, lilac, green and light blue.  There are four smaller communities, they are pale brown, orange, pink and darker green. Labelled, it's clear that four of the communities are the nations, and the others are those teams that link more than one country (with some exceptions). The same diagram as before, but coloured by community and labelled.  The eight colours are four large circles, dark grey (Spain), lilac (Argentina), green (England) and light blue (France).  There are four smaller communities, they are pale brown (Inter Milan which links Argentina and France), orange (Chelsea who have at least 1 player in each remaining team), pink (Crystal Palace who link England, France and Spain) and darker green (Bayer Leverkusen who link Argentina, Spain and England). 

The thing that intrigues me is that some teams aren't separate communities even though they link multiple teams. 

I think that happens when most of the players play for one national team, for instance of the five Aston Villa players left, three play for England. 

Chelsea will have a player in the final no matter what combination of teams wins the semifinal matches. 

Making predictions at this point is almost impossible, but the diagram says England and unclear because of how equidistant Spain and France are from the centre.

Saturday, 11 July 2026

Formula 1 2026 - British Grand Prix

 Ferrari only win when I can't pay attention. Barcelona - I was being driven back from a fencing competition. Silverstone - being driven back from a fencing competition. Clearly, the solution to get Ferrari winning more is for me to do more competitions. [Editorial note, the joke is L's]


Ferrari mustn't have been expecting Leclerc to start so well given it meant they had to switch to strategy B by lap 8.

It was a race with several "things I hadn't seen before". An umbrella causing a (virtual) safety car and a brake aero duct failure causing a car to stop being able to steer.

(Technical details sort of here - https://www.formula1.com/en/latest/article/a-car-should-not-break-wolff-laments-antonelli-mechanical-issue-with-italian-denied-epic-battle-for-silverstone-win.5juL2jTds26Hl4foTZIWnk)

That penalty for Antonelli was kicking a man when he was down. This time he wasn't deliberately going beyond track limits.

So happy that Ferrari got a 250th F1 Victory. Harry Benjamin on the BBC commentary was not helping by describing Leclerc as "the man who bleeds scarlet". We Ferrari fans are already unreasonable on the subject of Leclerc.

Wednesday, 8 July 2026

World Cup 2026 - Quarterfinal Network Visualisation

(The Austrian Grand Prix scrutineering post, and the British Grand Prix summary and scrutineering post are coming, I just thought this was a bit more urgent) 

Okay, last's round's predictions were not as good as they could have been. I got Brazil vs Norway right, and was right to suspect England vs Mexico would be close, got France, Argentina and Morocco's results correct, but was way out on Belgium vs United States and got Switzerland vs Colombia wrong (although I said it would be close). I was right that Spain being pulled out of the centre of the diagram by all their Barcelona players made it hard to predict their result from the diagram. 

Also, I didn't predict how close Egypt got to beating Argentina. 

What do the quarterfinal diagrams look like? 

The unlabelled diagram looks like this: Unlabelled network graph of the teams in the quarterfinals.  Smaller circles representing smaller numbers of interactions are red and the colour moves towards creamy white as the circles get larger.  They now looks like a very squiggly circle, or a very wobbly rhomboid, with only one team in the middle. Labelled it looks like this: Labelled network graph of the teams in the quarterfinals.  Smaller circles representing smaller numbers of interactions are red and the colour moves towards creamy white as the circles get larger.  They now looks like a very squiggly circle, or a very wobbly rhomboid, with only one team in the middle.  Spain, at the top of the graph, is where 1 would be on a clock.  Following the clock around, there is England at about 2, Belgium at 5, Morocco at 6, Switzerland at 8, Norway just past 9 and Argentina at 11.  France are in the middle. France are the national team closest to the centre, with Paris Saint-Germain the club team closest. 

The club teams with the most representatives left in are Atlético Madrid, Barcelona and Arsenal with 10. 

The average number of degrees of contact each circle has is 1.364. 

The number of communities is still one per team, so 8. 

The unlabelled community view looks like this: Community view of the above.  Full description in the labelled version. Labelled, it looks like this: Labelled network graph of the community view of the teams in the quarterfinals.  Smaller circles representing smaller numbers of interactions are red and the colour moves towards creamy white as the circles get larger.  They now looks like a very squiggly circle, or a very wobbly rhomboid, with only one team in the middle.  Spain, at the top of the graph, is where 1 would be on a clock and is orange-pink.  Following the clock around, there is England at about 2 (blue), Belgium at 5 (olive green), Morocco at 6 (sort of turquoise), Switzerland at 8 (grey), Norway just past 9 (pink) and Argentina at 11 (orange).  France are in the middle and green. 
What about my predictions? 

It's much harder at this point, with the teams other than France pretty much equidistant from the centre, and no "gravitational" clump. 

France vs Morocco - Diagram says France 

Spain vs Belgium - Diagram says Belgium, although I think that's because Spain are still pulled out of the centre by all those Barcelona players. On the other hand, anything can happen in knock out football. 

Norway vs England - Norway just (that sound you can hear is L cursing me) 

Argentina vs Switzerland - Diagram says Switzerland. I think that's the Atlético Madrid players pulling Argentina out. Also [Legal team have redacted a paragraph-long rant about exactly how many World Cups the referees are going to give this Argentina team.] Switzerland could do it ... (I feel I need to add a conflict of interest statement, I drew Switzerland in a sweepstake at work.)

Sunday, 5 July 2026

World Cup 2026 - Last 16 Round Network Visualisation

Delayed by fencing, which I enjoyed immensely despite the sprained ankle. 

Second round results: I said Senegal vs Belgium would be a cracker

The whole centre of diagram gravity vs centre of diagram really did come into play in the second round - if you were a team on the left hand side of the diagram you went out. Except Egypt, and they were playing another team from the left hand side. 

Of the matches where there was a clear prediction, gravitational centre ended up being more important, which is useful learning. 

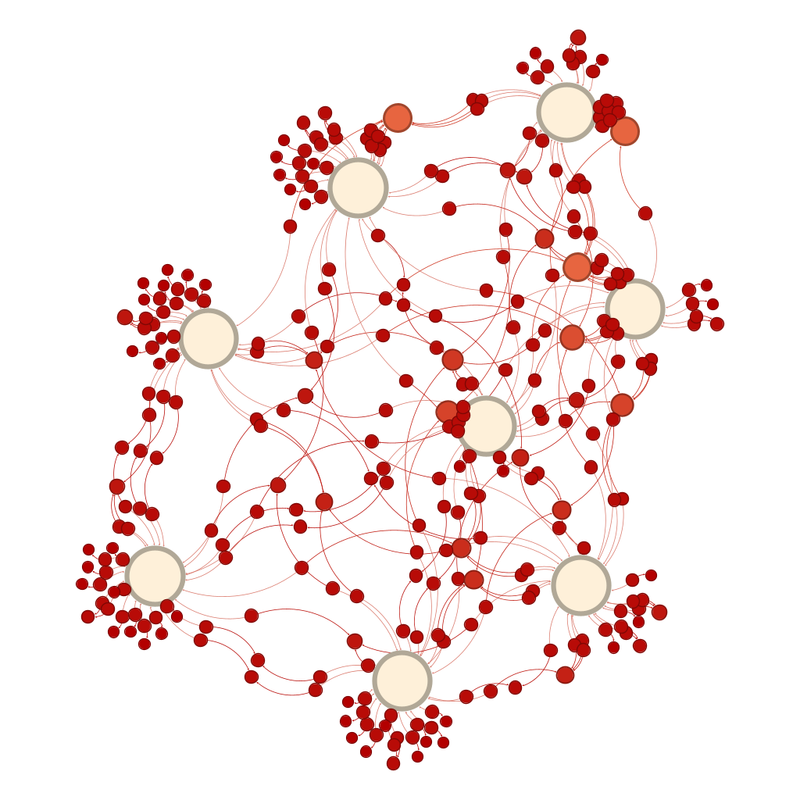
The diagram for the last 16 teams isn't as tightly packed any more, which means that should be less of a thing going forward. Unlabelled network graph of the teams in the last 16.  Smaller circles representing smaller numbers of interactions are red and the colour moves towards creamy white as the circles get larger.  This time, they are reasonably evenly spread out, with only really two sticking out on the left hand side.  (Yes, one of them is Egypt again). 

The labelled version of the graph looks like this: Labelled version of the network graph of the teams in the last 16.  Smaller circles representing smaller numbers of interactions are red and the colour moves towards creamy white as the circles get larger.  Egypt and Canada are the teams sticking out on the left.  Everyone else is almost in a central rectangle. 

The list of club teams with the most representatives has changed - especially Bayern Munich given Germany are out. What we've got instead are a small clump of teams with 12 players left in (and yes, these are the teams that were causing the cluster in blue in the first round and in the top right of the diagram in the second). They are Paris Saint-Germain, Arsenal, Barcelona and Manchester City. Atlético Madrid is the next on 11. 

Norway are the national team closest to the centre, while Inter Milan are the club team closest. 

The average number of degrees each circle is linked to has gone down to 1.377. 

The number of communities in the communities view is now 16, so one per team. Same image as above now coloured by community.  Full explanation in the labelled description. Labelled it looks like this: Labelled version of the above.  Egypt (purple) and Canada (orange), stick out to the left.  Spain (green), England (brown) and Brazil (pink) run across the top).  Colombia (mid-green) and Paraguay (blue) are along the right hand side, with Switzerland (also pink) and Mexico (sort of mint green along the bottom).   About level vertically with Egypt and under the Spain-England-Brazil group are Argentina (also orange), France (dark blue), Portugal (pale orange) and Belgium (dark green).  Between them and the bottom are United States (olive green), Norway (vibrant blue) and Morocco (pale green). 

As to my predictions (which I don't mind making late because you can see the diagrams I'm basing them on): 

France vs Paraguay - France 

Canada vs Morocco - Morocco 

Portugal vs Spain - Diagram says Portugal, reason says Spain; all those Barcelona players pull Spain out of the centre, the same thing that happens to their women's team and always skews the women's diagrams. 

United States vs Belgium - Diagram is not clear, this may be closer than people expect. 

Brazil vs Norway - Diagram says Norway, I don't think that's impossible. 

Mexico vs England - Diagram is also not clear 

Argentina vs Egypt - Argentina 

Switzerland vs Colombia - Diagram says Colombia but could be close!

Thursday, 2 July 2026

Formula 1 2026 - Austrian Grand Prix

 This year I've often said how much the new regulations have improved the action, or at least made it more interesting for spectators. I have to acknowledge that that didn't happen at the Austrian Grand Prix, and the only points of interest were due to the differing tyre strategies of the front runners.


And the many brakes on fire, which I'm presuming was due to the mixture of high temperature and high altitude. I'm not sure what explains Liam Lawson's assumption of fire, unless his cockpit just felt that damn hot!

I am also presuming Red Bull turned the wick up on their engine for their home race, the way Ferrari do for Monza.

The effect the timing of the safety car had on the outcomes of the strategy calls highlights the importance of luck - it's normally Leclerc hit by "safety car 1 lap after it would have been useful for him"; this time it was Antonelli.

The current Ferrari team don't seem to be able to have two good races in a row. As a Ferrari fan, hearing the commentators asking "is the Ferrari strategy clever or just really, really stupid?" is frustrating because the answer is always that it's really, really stupid.

I think Andrew Benson on the BBC radio commentary described it best, the Ferrari strategy is "... hoping for something instead of racing with what's in front of you right now". They are just hoping, not planning for the various possible outcomes or making something happen. It's so frustrating!!!