Thursday 29 February 2024

Did the sprint points and fastest lap points make a difference in Formula 1 in 2023?

I’m updating my analysis of whether the fastest lap points make any difference (last year’s analysis is here - https://fulltimesportsfan.wordpress.com/2023/03/15/formula-1-did-the-fastest-lap-and-sprint-points-make-any-difference-in-2022/). I expect that the one point on offer will continue to make no difference, especially now there’s so many sprint races and they have so many more points available.

2023 Fastest Laps     Fastest-Laps-2023 
8 different drivers and 5 different constructors won fastest lap points which is higher than the average (averages being 7 and 4 respectively).

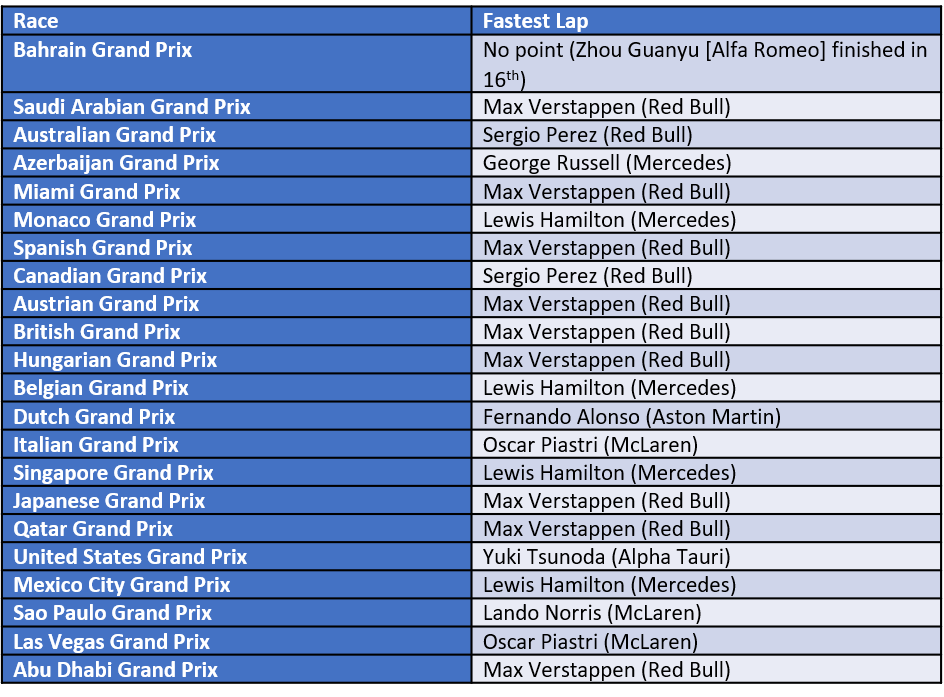
Constructors' standings with and without fastest lap points Constructors-Fastest-Laps Removing the fastest lap points makes no change in the Constructors Title 

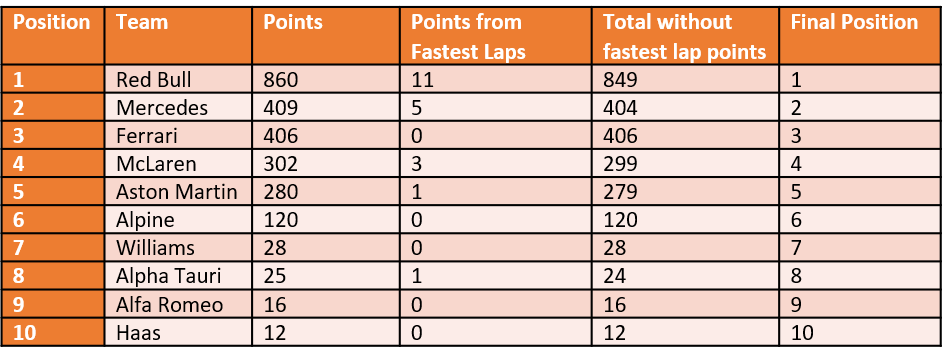
How about in the Drivers's championship? 

Drivers Championship standings with and without the fastest lap points  Drivers-Fastest-Laps Okay, so it swaps Leclerc and Alonso, but other than making me happy, it doesn’t change any of the important places. 

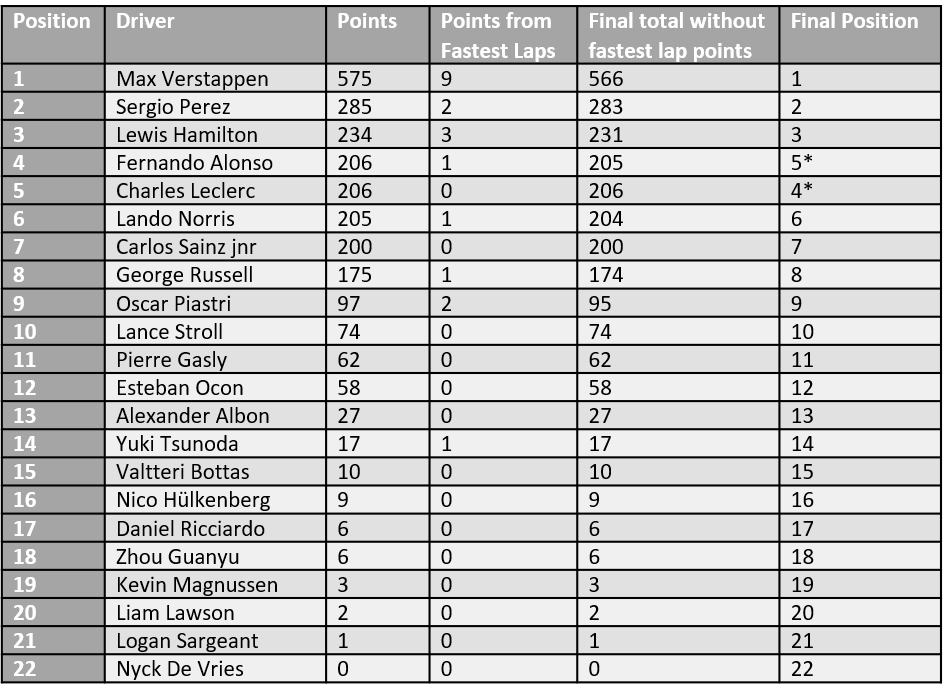
That means if we put together 2023’s results with the calculated total points if there had been fastest laps from 2009-2018, and the actual results in 2019, 2020, (https://fulltimesportsfan.wordpress.com/2021/01/23/f1-fastest-lap-points-full-of-speed-and-fury-signifying-nothing/), 2021 (https://fulltimesportsfan.wordpress.com/2022/03/19/formula-1-did-the-fastest-lap-points-make-any-difference-in-2021/), and 2022 (https://fulltimesportsfan.wordpress.com/2023/03/15/formula-1-did-the-fastest-lap-and-sprint-points-make-any-difference-in-2022/), 0 constructors results out of 159 have been affected by fastest lap points. 

In the drivers’ championship, the number of results affected is 13/349 (3.72% of all results), and none of those are in the top 3 of any given year. 

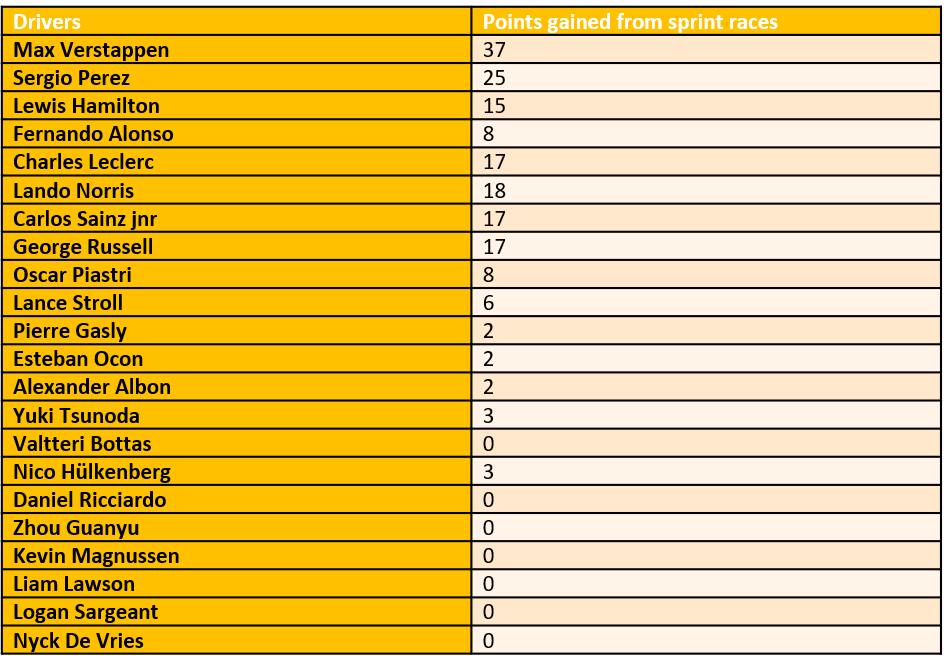
Let’s look at the sprint races, which I expect to have a greater effect due to the quite frankly ridiculous number of them and the points available for them.

The sprint race points were as follows:   Sprint-Race-Points

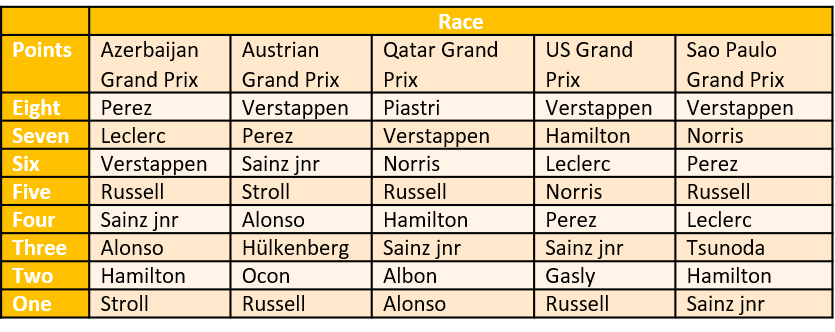
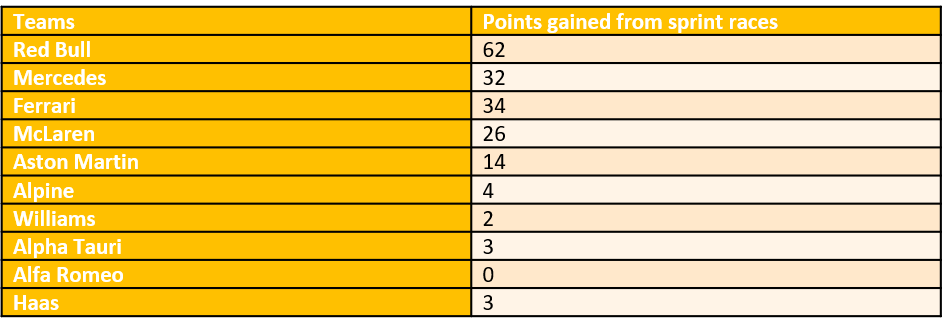
Team points from the sprint races:

Team-Points-Sprints
Driver points from the sprint races:Drivers-Points-Sprints 

Do the sprint race points have an effect on either championship?

Constructors' championship with and without the sprint and fastest lap points   Constructors-Sprints 
* = Ferrari move up if they have the same number of points due to the Singapore Grand Prix victory 

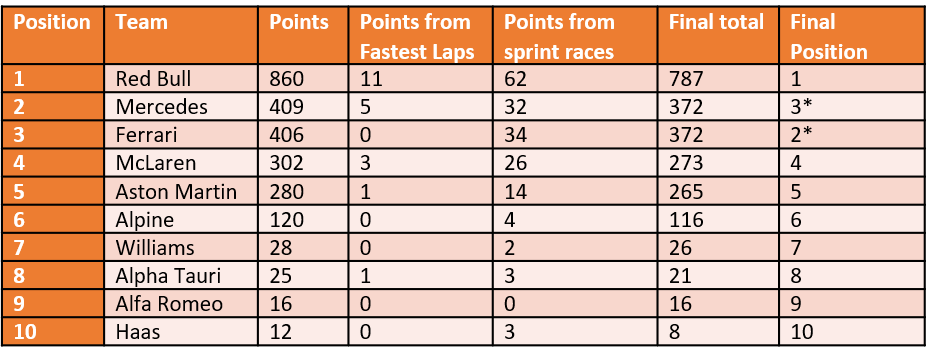
So it does have an effect on one of the important positions. 
After 2 years, sprint points have had an effect on 6/20 constructors positions. 

 Drivers' championship with and without the sprint and fastest lap points

  Drivers-Sprints Hülkenberg stays ahead of Ricciardo on count back. Zhou stays behind them, also based on countback to best finish. 

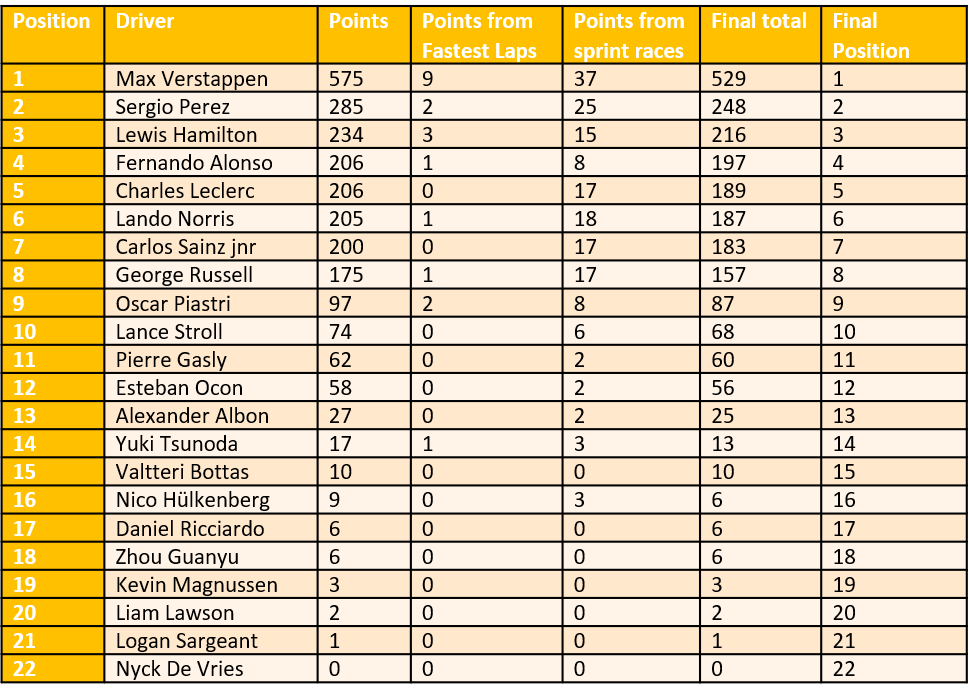
Giving points to almost half the field 5 times a year changes the position of 0 of the drivers. That suggests that there are gaps in performance between the drivers and that the sprint races don’t do anything to disturb that (just say no to sprint races in the present format). 

Over 2 years with sprint races, 6/44 results have been changed. 

What have we learned? 
  • The 1 point for fastest lap is too small to affect anything. I think that’s also why the top teams have stopped going for them, which I think is reflected in more drivers and teams getting fastest laps in 2023. 
  • The sprint races really don’t do anything to disturb the existing order, and only strengthen the points totals of the good teams, creating further separation between them and the weaker team.
  • Red Bull, stupid amounts in front of the other teams.
  • Everyone else pretty much coming in two by two except Alpine.
  • In the driver’s championships points totals it’s either large gaps or serious scrunching up of points.
  • It would be more interesting if Red Bull weren’t so far ahead in everything.

Friday 23 February 2024

Haaland or Bug: Comparing Haaland's stats to Shearer, Kane and Salah

As promised in the update post comparing Shearer, Kane and Salah (https://fulltimesportsfan.wordpress.com/2024/02/14/the-king-his-heir-apparentand-the-pharaoh-waiting-in-the-wings-shearer-kane-and-salah-games-and-goals-per-season-updated-to-the-end-of-the-2022-2023-season/), here is what the the figures look like with Haaland added. 

I'd like to tip my hat to Ted Knutson (@mixedknuts on twitter, other microblogging platforms are available and I'm mostly at @kpfssport@mastodonapp.uk) for the concept of "something or bug", which came from the effect of that year that Burnley really outperformed expectations on Statsbomb’s analyses. Burnley’s data was so different to everyone else’s that after every analysis they had to check whether any outlier was a bug or just Burnley being Burnley. 

I strongly suspected that Erling Haaland's goalscoring stats would have that effect on my graphs but he had such a good first season in the Premiership that I couldn't really say no to L's suggestion when he said "why don't you add Haaland's stats to the analysis?". 

I was right to think Haaland's numbers were going to do terrible, terrible things to my graphs. 

First of all, he's so young that for actual data, there's only numbers up to age 22. For percentage of games played, that makes the data look wild. The percentage of games young players play varies so much depending on circumstance, things like depth of talent at their club, whether they've been loaned out to another club to get some seasoning, whether the coach wants to build them up slowly. So many variables, so it's really messy when you look at data from that age. Dot plot with the dots joined by dotted lines the same colour as the dots.  Blue dots are Alan Shearer,  orange are Harry Kane, silver is Mo Salah and yellow is Erling Haaland.  The Shearer curve starts at 0, rises to 53 percent at 21 and then drops to 50 percent at 22.  The Kane curve is upside down compared to the others because it starts high, at 68 percent, then drops to 40 percent at age 18 and then starts to rise again, finishing at 98 percent at 22.  The Salah curve starts at 0, reaches a maximum of 78 percent at 20, and then drops to 58 percent at 22.  The Haaland curve meanwhile is more of a steady rise, starting at 52 percent finishing at the highest point of 80 percent at 22.
That variability is most clearly seen in Kane's graph, which is upside down compared to the others. Because there's so little real data, the extrapolation in the graph to end of career, 35 years of age because that's when Shearer stopped, particularly effects Haaland's numbers. On the other hand, the extrapolation is needed because everyone's numbers go up after 22.   Dot plot with the dots joined by dotted lines the same colour as the dots.  Blue dots are Alan Shearer,  orange are Harry Kane, silver is Mo Salah and yellow is Erling Haaland.  The Shearer curve starts at 0, reaches a maximum of 86 percent at 31 then drops to 79 percent at 35.  The Kane curve starts at 20 percent, rises to a maximum of 89 percent between 29 and 30 years of age, then drops to 80 percent at 35.  The Salah curve starts at 15 percent, rises to a maximum of 93 percent between 27 and 28 years of age, then drops to 62 percent at 35.  The Haaland curve starts at 52 percent, rises to a predicted maximum of 82 percent at 24 and then drops to 40 percent at 35. 

I think that explains why Haaland's numbers drop so quickly in this graph and I think that'll steady itself with another year's data. I mean, according to this, his numbers max out at 24 and, barring injury (and may he be kept from those) that doesn't reflect footballing truth. 

The goals per game up to the oldest point all four players have reached is another one bent and mangled by lack of data. Dot plot with the dots joined by dotted lines the same colour as the dots.  Blue dots are Alan Shearer,  orange are Harry Kane, silver is Mo Salah and yellow is Erling Haaland.  The Shearer curve starts at 1.6 due to a nonsense of extrapolation.  It drops to a minimum of 0.1 goals per game at 19 then rises again to 1.75 at 22.  The Kane curve starts at 0.8, again due to extrapolation, reaches a minimum of 0.4 goals per game between 19 and 20, then rises to 0.55 goals per game by 22.  The Salah curve starts at 0.5, rises to a maximum of 0.4 at 20 then drops slightly to 0.3 at 22.  The Haaland curve starts at 0, reaches a maximum of 1.1 between 20 and 21, then drops slightly 1 goal per game at 22. That's two upside down curves versus two right way up curves, because of the extrapolation needed because Haaland started in the adult leagues earlier than the others. 

Also, this was all while Salah was still a winger, which explains his low numbers. 

On the other hand, you can imagine the nonsense extrapolation makes of Haaland's numbers if you send them forward to him being 35.

Behold, the nonsense:   Dot plot with the dots joined by dotted lines the same colour as the dots.  Blue dots are Alan Shearer,  orange are Harry Kane, silver is Mo Salah and yellow is Erling Haaland.  The Shearer curve starts at 0.6 goals per game, rises to a maximum of 0.6 goals per game at 27, then drops to 0.35 at 35.  The Kane curve starts at 0.19, rises to a maximum of 0.7 between 25 and 26, then drops to 0.26 at 35.  The Salah curve starts at 0, rises to a maximum of 0.6 at 30, then drops to 0.37 at 35.  The Haaland curve starts at 0, rises sharply to maximum of 1.05 between 20 and 21 then drops back to 0 by 26. According to the nonsense, Haaland stops scoring at 26. Again, may he be kept from injury, that is clear nonsense. 

For goals per possible game, up to the oldest age all of them have achieved, we're back in the land of the banana curve, due to extrapolation. Dot plot with the dots joined by dotted lines the same colour as the dots.  Blue dots are Alan Shearer,  orange are Harry Kane, silver is Mo Salah and yellow is Erling Haaland.  The Shearer curve starts at about 0.19, drops to a minimum of 0.05 at 20 years of age, then rises to 0.3 goals per possible game at 22.  The Kane curve starts at 0.5 goals per possible game, drops to a minimum of 0.2 between 18 and 19, then rises to 0.54 goals per game at 22.  The Salah curve starts at -0.35 goals per game, I blame extrapolation, then rises to a maxium of 0.21 at 20, then drops to 0.15 goals per possible game at 22.  The Haaland curve starts at -0.1 goals per possible game, rises to a maximum of 0.82 goals per possible game at 20 then drops slightly to 0.8 goals per possible game at 22. Again, it's Kane and Shearer who are banana shaped, and Salah's goals per possible game is lower than everyone else's because he was still a winger. Dot plot with the dots joined by dotted lines the same colour as the dots.  Blue dots are Alan Shearer,  orange are Harry Kane, silver is Mo Salah and yellow is Erling Haaland.  The Shearer curve starts at 0 goals per possible game, up to a maximum of 0.5 goals per possible game between 27 and 28, then drops to 0.29 goals per possible game at 35.  The Kane curve starts at 0, rises to a maximum of 0.58 goals per possible game between 26 and 27 and then drops to 0.28 at 25.  The Salah curve starts at 0, then rises to a maximum of just over 0.6 at 33 before dropping just below 0.6 goals per possible game at 35.  The Haaland curve starts at 0, before rising to a maximum of 0.83 at 21, before dropping like a stone to 0 at 27. Again, Haaland's is that shape due to a lack of data. 

It'll be interesting to see the shape of his curve change next year.

Wednesday 21 February 2024

Saints Ahoy - Rugby League Data Visualisation Project 2024

Introduction: After my reasonably successful posts on England at the 2021 World Cup (https://fulltimesportsfan.wordpress.com/2022/12/29/rugby-league-world-cup-2021-final-network-diagram/), I was considering an expanded project. Both the 2021 Rugby League World Cup and the 2023 Rugby Union World Cups (https://fulltimesportsfan.wordpress.com/2023/11/01/the-road-to-explicableness-a-closer-look-at-england-after-their-seventh-world-cup-game/) demonstrated that, understandably, with each extra game, the stronger the data got, and the clearer the shapes of the teams got. 

The effect was stronger for the England rugby league team than the union team because, I think, Shaun Wane didn't have his chosen playmaker suspended for 3/7 games, and because he had a much clearer idea of who his first team were than Steve Borthwick did. 

Taking these two ideas together, I thought, why not follow a rugby league team through their season and see what the data shows? 

My beloved Saints were an obvious choice. 

Then I realised that, while nrl.com has all the information I could possible need, the Super League's website doesn't even have match reports. 

Cue sad me scrabbling for a replacement team, and hitting on St. George Illawarra, who have both a similar name and a similar jersey. They were a decent replacement. 

I was checking in on St. Helens's first game of the season on twitter (https://twitter.com/Saints1890) and realised that the twitter feed normally has most of the information I need. And then I remembered that my beloved Saints use that feed to do the "as it happened" section of their match reports (example from the first match of the year here - https://www.saintsrlfc.com/matches/2024/first-team/saints-v-london-broncos-2024-02-16/) so I don't even need to do it live or almost live. 

I love Saints so much. 

Game 1: 

Saints' first game was against the London Broncos, who were promoted to the Super League at the end of the 2023 season. 

You can read match reports here - https://www.saintsrlfc.com/matches/2024/first-team/saints-v-london-broncos-2024-02-16/ or https://www.bbc.co.uk/sport/rugby-league/68304742 depending if you want "focussed on Saints" or "more evenly interested in both teams". 

I am with the section of fans pleased with the result and performance given it was the first match of the season, but concerned about the number of missed conversions. When Saints play stronger teams, dropping points like that could hurt Saints. 

As London only scored four points, I'm not showing the "players on the pitch when Saints conceded points" diagrams. (Although, from a fan's perspective, well played on defence Saints :) ) 

The "players on the pitch when Saints scored" is already quite interesting after only one game, because you can already see the cluster of players who play lots of minutes and the prop combinations that play together: Dendrogram after the first game.  There is one large group, containing Dodd, Blake, Hurrell, Lomax, Makinson, Sironen, Welsby and Whitley, who were present for all the point-scoring moments.  The only other cluster is Walmsley and Bell, who therefore played together often, suggesting they are one of the prop lines that Saints use together. 

I expected the larger group, didn't expect Bell and Walmsley to be played together that much.  It suggests that they might be one prop pairing.

The paler squares in the next diagram indicate players who weren't on the pitch together when Saints scored, suggesting they don't play together. Matrix diagram, the dark red/purple cluster is odd, Blake, Hurrell, Lomax, Makinson, Sironen, Welsby and Whitley.  Walmsley and Bell both have very pale squares for Wingfield and Matautia, who will have to forgive me for not being able to put apostrophes in alt text for technical reasons.  This suggests that Wingfield and Matautia are the other prop line.  Percival has a lighter line than those around him because he was taken off early. From this it looks like Walmsley and Bell didn't play at the same time as Wingfield and Mata'utia, suggesting Wingfield and Mata'utia are the other prop line. Percival has a lighter line than those around him because he was taken off early. I am entirely on team "wrap him in cotton wool once the match is won". 

The network diagram already shows 13 players who play together when Saints score.  They wouldn't be a bad first 13: Network diagram only shows 13 players, they are Bell, Whitley, Hurrell, Delaney, Makinson, Lomax, Sironen, Dodd, Clark, Walmsley, Blake, Welsby and Percival. The "when the players were on the pitch" diagram highlights one interesting thing: Line chart.  Longer lines show when players have been on the pitch for all of the scoring moments.  The line for Matty Lees starts at 0, and stops at about 5. Matty Lees got taken off early on and did not come back on. I haven't seen anything about him being injured so that's odd. 

Looking forward to doing this for the rest of the season. Each post is likely to be "figures for that game" and "figures for the season up to the end of that game."

Wednesday 14 February 2024

The King; his Heir Apparent…and The Pharaoh waiting in the wings

Shearer, Kane and Salah, games and goals per season, updated to the end of the 2022-2023 season 

In the first post in the series I compared the games per season, goals per game and goals per possible game for Alan Shearer, the Premier League's all time top scorer, and Harry Kane and Mo Salah, the two players who had the best change of beating his record back in 2021 when L first had the idea. 

At the end of the post, I suggested two bits of future work; to update the stats at the end of each season, and to then look at Erling Haaland's numbers in comparison. This post covers the first of those two bits of future work, a second one with Haaland's data is in the works. 

Comparing Shearer, Kane and Salah using data up to the end of the 2022-2023 season 

Looking at percentage of games played in only up to the point where all 3 players are 29, it looks like this. Dot plot with the dots joined by dotted lines the same colour as the dots.  Blue dots are Alan Shearer,  orange are Harry Kane and silver is Mo Salah.  The Shearer curve bends sharply to the lowest point of any of the three, stopping at 80 percent of games played.  His curve is pulled down by having played few games when he was 27.  The Salah curve has a very similar shape but stops at 85 percent.  The Kane curve is also a parabola but is still rising when he reaches 29.  At 29, his curve is at 90 percent. 

It's now the Salah and Shearer curves that are the most similar. 

Shearer's curve is being brought down by the ankle injury when he was 27, while Salah's is being brought down by the relatively lower percentage of games he played last season. Possibly because Tottenham Hotspur relied so much on him, so played him a lot, Kane's curve is not dropping. 

If we use all the data from Shearer's career, and then extrapolate from the data available for up to 29 years of age for Kane and 30 for Salah the curves look like this: Dot plot with the dots joined by dotted lines the same colour as the dots.  Blue dots are Alan Shearer,  orange are Harry Kane and silver is Mo Salah.  All three are parabolas.  The Shearer curve starts at 0 percent, reaches a maximum of about 85 percent at the age of 31, and then drops to about 79 percent at 35.  The Kane curve starts at 20 percent, reaches a maximum of about 90 percent at the age of 30 and then drops to 80 percent at 35.  The Salah curve starts at 14 or 15 percent, reaches a maximum of 92 or 93 percent between 27 and 28 years of age, and then drops to about 64 percent at 35. Salah's curve is really affected by the way the extrapolation handles the relatively few games he played at age 29, but the curve shape going forward is going to heavily depend on how many games he plays this year. 

Looking at goals per game, up to the age of 29, the curves look like this: Dot plot with the dots joined by dotted lines the same colour as the dots.  Blue dots are Alan Shearer,  orange are Harry Kane and silver is Mo Salah.  All three are parabolas, but the Salah curve is almost a straight line.  The Shearer curve starts at about -0.1 goals per game, reaches a maximum of about 0.62 goals per game at age 25, then drops to 0.56 goals per game at 29.  The Kane curve starts at about 0.19 goals per game, reaches a maximum of 0.7 goals per game at about age 26 and then drops to 0.61 goals per game at 29.  The Salah curve starts at -0.1, and is still increasing when it ends at 0.61 at 29 years of age. The three curves are very similar to last year's. Shearer's is still brought down by the limited number of goals he could score at the age of 27 when he had an ankle injury, but you can also see him recovering from that, and the goals per game rising back up again. 

The different shape of Salah's curve reflects him being repurposed from a winger to a striker, while the other two have always been out and out strikers. 

If we look at all the data, the curves look like this: Dot plot with the dots joined by dotted lines the same colour as the dots.  Blue dots are Alan Shearer,  orange are Harry Kane and silver is Mo Salah.  The Shearer curve starts at 0.5 to 0.6 goals per game, reaches a maximum of 0.61 goals per game at 27 years of age, and then ends at 0.35 goals per game at 35.  The Kane curve starts at 0.19 goals per game, reaches a maximum of 0.68 to 0.7 between 25 and 26, and ends at 0.27 at 35.  The Salah curve starts at 0, reaches a maximum of 0.61 between 30 and 31 and then drops to 0.56 at 35. Previously, the shape of the curves was really different, with Shearer and Kane having parabolas and Salah's being a steadily rising straight line. The relative drop off in goals per game in the last two years for Salah is probably what's bending his curve now. 

Salah's curve still doesn't drop as much as the other two, possibly reflecting the steady rise after he switched from winger to striker. Kane's numbers are hurt by the dip in goals per game at the age of 28. 

The goals per possible game metric was added to account for Shearer's Newcastle having fewer games so less likelihood of him being rested. Up to age 29, it looks like this. Dot plot with the dots joined by dotted lines the same colour as the dots.  Blue dots are Alan Shearer,  orange are Harry Kane and silver is Mo Salah.  The Shearer curve starts at -0.4 goals per possible game, reaches a maximum of 0.6 goals per possible game at 26, then drops to 0.48 goals per possible game at age 29.  The Kane curve starts at -0.05, rises to a maximum of 0.55 at 27, then drops slightly to 0.54 at 29.  The Salah curve starts at -0.1 and is still rising to 0.6 goals per game at the age of 29. Shearer and Kane's curves resemble each other, while Salah's is a completely different shape, again, an artefact of his role changing. 

If all the available data is used, it looks like this: Dot plot with the dots joined by dotted lines the same colour as the dots.  Blue dots are Alan Shearer,  orange are Harry Kane and silver is Mo Salah.  The Shearer curve starts at 0, rises to a maximum of 0.52 goals per possible game at 26 and then drops to 0.29 at 35.  The Kane curve starts at 0, rises to a maximum of 0.58 goals per possible game between 26 and 27 and then drops to 0.28 at 35.  The Salah curve starts at 0, rises to a maximum of 0.6 goals per possible game at 33 and then drops slightly by 35. This is one where there's been a major change, with Kane's curve no longer dropping like a stone, which it did last year (I still blame Antonio Conte). 

I think the changes show the value of continuing to look at this at the end of each season. Obviously a couple of things have happened this season which will affect these plots going forward; Kane moving to Bayern Munich and Salah missing some Liverpool games playing for Egypt at the African Cup of Nations. That hasn't affected Salah's numbers before but since he got injured, it may have a greater effect this time. 

Kane leaving for Bayern almost certainly means he won't break Shearer's record. I'll still look at his stats, because I've included Salah's Fiorentina spell in the stats, but I acknowledge it'll no longer be a direct comparison because of the difference between the English and German leagues. 

Salah is now the active Premiership player closest to Shearer's record, he's on 153 goals, while Shearer finished on 260. The next nearest active player on the list is Raheem Sterling on 120 goals.

Tuesday 6 February 2024

Andalusia 2019 - Part 11 - Granada

The day after the Alhambra, on our last day in Andalusia we visited Granada (https://en.wikipedia.org/wiki/Granada). As you could see from the last photo in the last post, the Granada really does surround the Alhambra. 

View of the Alhambra from Granada: View of the Alhambra from Granada 

Granada was the fourth city we visited and the fourth completely different vibe. 

Granada had a much wider range of building styles, and some really cool lampposts: Modernist lamppost, the fitting around the bulb is a square broken down into smaller shapes.  It is both unusual looking and very cool. 

This is just an ordinary building, I liked the tree striving to survive: Corner of a pebble wall at the bottom of a hill of houses.  There is some graffiti on the white wall to the left, and a green tree growing out of the join between the white wall and the pebble wall. 

While I think the decoration at the top of this building is neat, it loses something without the rest of the building so have the building and then the close up shot: Yellow white multi-storey stone building, with the top window guarded by two angels and an eagle Close up of yellow white stone angels and the eagle 

Mudejar arch at the end of a row of shops: Left and right are rows of shops.  In the front of the photo are people walking along the street.  At the back is an orange stone arch in mudejar style. 

There was also a fascinating statue of Isabella the Catholic (unfortunately, I am foreign enough that I think of her as Isabella the Catholic. I am sure she actually has a regnal number and stuff). Statue of Christopher Colombus kneeling in front of Isabella the Catholic.  The plinth is an off white stone, the figures are in bronze.  Isabella dress cascades down the front of the plinth in ripples. 

I've never seen the ripple effect done by different colour material on such a large statue before. More information on the statue, and that it helped cause a riot, here - https://en.wikipedia.org/wiki/Monument_to_Isabella_the_Catholic_(Granada) 

Their Catholic majesties (don't look at me in that tone of voice) were pretty much the theme of the day as we spent most of our time in the Royal Chapel of Granada (https://en.wikipedia.org/wiki/Royal_Chapel_of_Granada) which contains the tombs of Isabella and Ferdinand, as well as Joanna of Castile and Philip the Handsome. And some very cool artwork. 

It is an understandably fancy building, in what I've been told is Isabelline style, a variant on late Gothic. Pictures of the building
  Carved triptych over a door.  The two saints are probably Saint John the Baptist and Saint John the Evangelist surrounding a Virgin and child.  The roof behind it features lots of twisty gothicness. 

Because they get everywhere, I also suspect this of being a Hapsburg eagle holding the coat of arms of Isabella and Ferdinand.
  Decoration at the top of a door.  It is the side of an eagle holding a shield.  The design on the shield cannot quite be clearly seen. 

 We didn't get to see the San Juan de Dios Hospital (https://en.wikipedia.org/wiki/San_Juan_de_Dios_Hospital_(Granada)), which was our tour guide's favourite site in Granada (and may have been her favourite in all of Andalusia, Sharon being awesome that way), nor did we manage to have any tapas in the home of tapas (https://en.wikipedia.org/wiki/Tapas#Origin), but, all in all, it was a very successful trip, and I would recommend a visit to Andalusia to everyone.