In the first post in the series I compared the games per season, goals per game and goals per possible game for Alan Shearer, the Premier League's all time top scorer, and Harry Kane and Mo Salah, the two players who had the best change of beating his record back in 2021 when L first had the idea.
At the end of the post, I suggested two bits of future work; to update the stats at the end of each season, and to then look at Erling Haaland's numbers in comparison.
This post covers the first of those two bits of future work, a second one with Haaland's data is in the works.
Comparing Shearer, Kane and Salah using data up to the end of the 2022-2023 season
Looking at percentage of games played in only up to the point where all 3 players are 29, it looks like this.
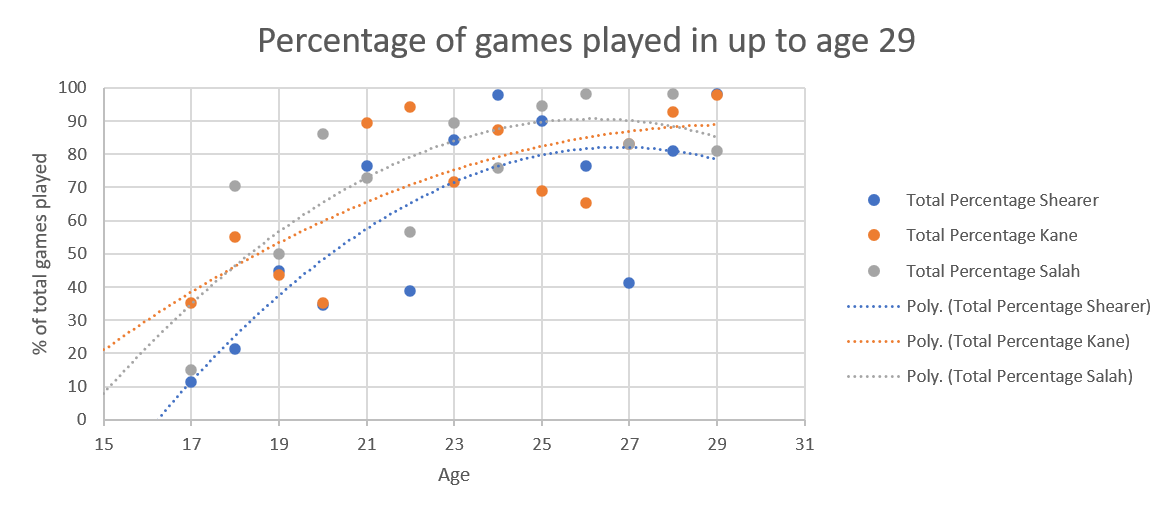
Shearer's curve is being brought down by the ankle injury when he was 27, while Salah's is being brought down by the relatively lower percentage of games he played last season. Possibly because Tottenham Hotspur relied so much on him, so played him a lot, Kane's curve is not dropping.
If we use all the data from Shearer's career, and then extrapolate from the data available for up to 29 years of age for Kane and 30 for Salah the curves look like this:
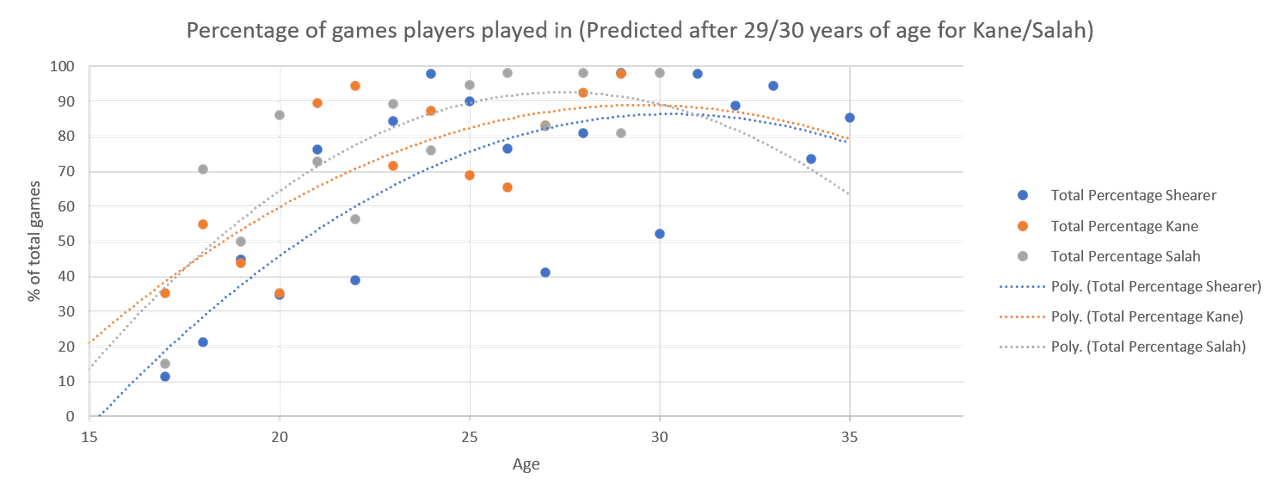
Salah's curve is really affected by the way the extrapolation handles the relatively few games he played at age 29, but the curve shape going forward is going to heavily depend on how many games he plays this year.
Looking at goals per game, up to the age of 29, the curves look like this:
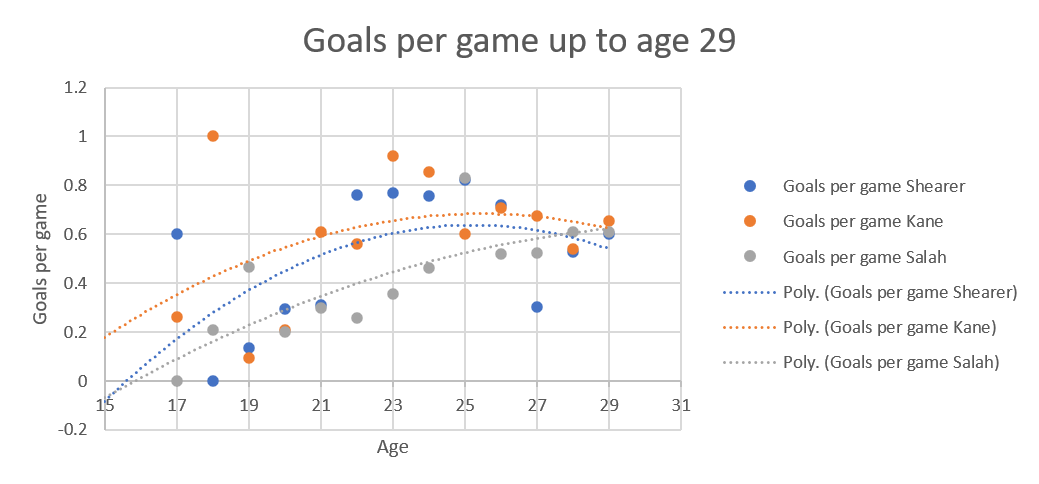
The three curves are very similar to last year's. Shearer's is still brought down by the limited number of goals he could score at the age of 27 when he had an ankle injury, but you can also see him recovering from that, and the goals per game rising back up again.
The different shape of Salah's curve reflects him being repurposed from a winger to a striker, while the other two have always been out and out strikers.
If we look at all the data, the curves look like this:
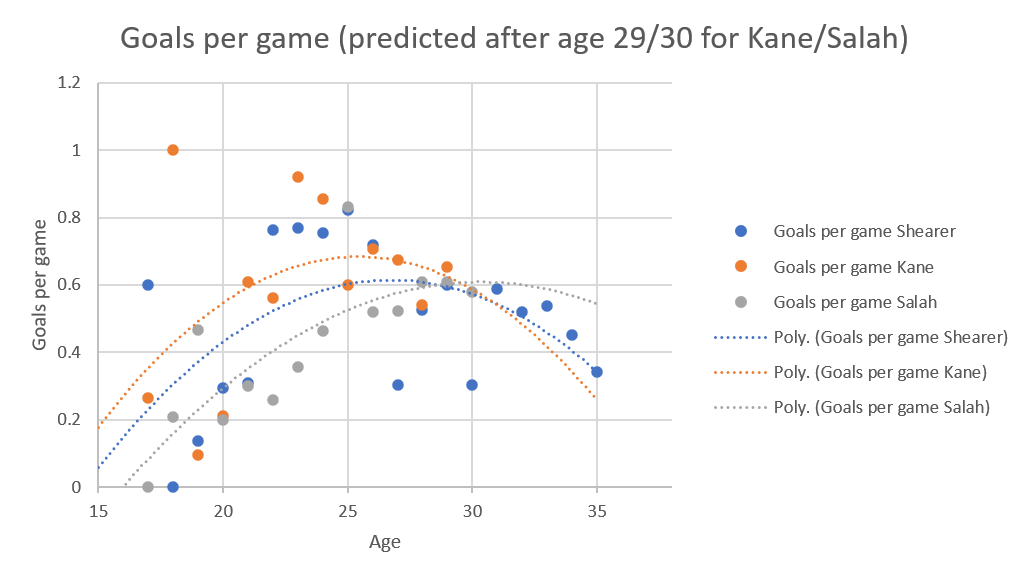
Previously, the shape of the curves was really different, with Shearer and Kane having parabolas and Salah's being a steadily rising straight line. The relative drop off in goals per game in the last two years for Salah is probably what's bending his curve now.
Salah's curve still doesn't drop as much as the other two, possibly reflecting the steady rise after he switched from winger to striker.
Kane's numbers are hurt by the dip in goals per game at the age of 28.
The goals per possible game metric was added to account for Shearer's Newcastle having fewer games so less likelihood of him being rested.
Up to age 29, it looks like this.
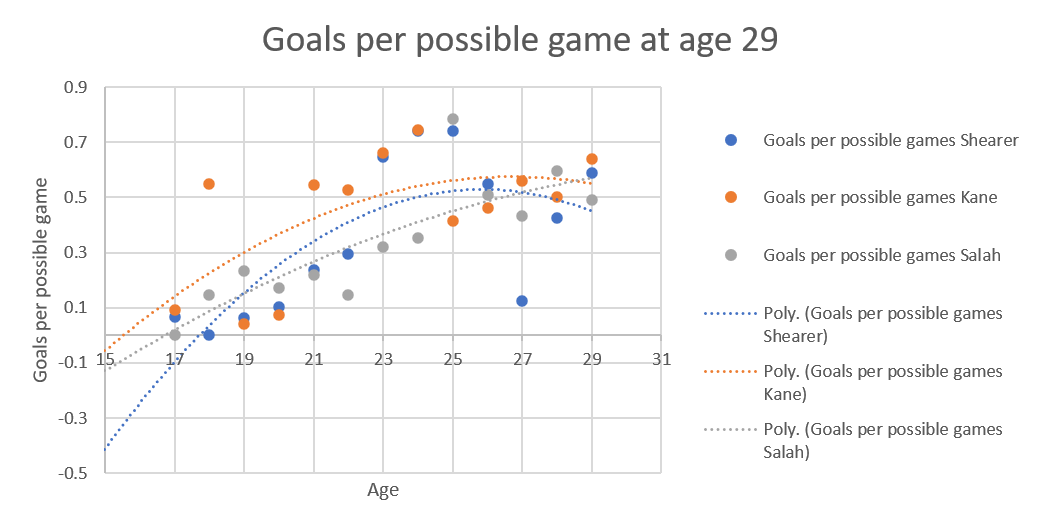
Shearer and Kane's curves resemble each other, while Salah's is a completely different shape, again, an artefact of his role changing.
If all the available data is used, it looks like this:

This is one where there's been a major change, with Kane's curve no longer dropping like a stone, which it did last year (I still blame Antonio Conte).
I think the changes show the value of continuing to look at this at the end of each season.
Obviously a couple of things have happened this season which will affect these plots going forward; Kane moving to Bayern Munich and Salah missing some Liverpool games playing for Egypt at the African Cup of Nations. That hasn't affected Salah's numbers before but since he got injured, it may have a greater effect this time.
Kane leaving for Bayern almost certainly means he won't break Shearer's record. I'll still look at his stats, because I've included Salah's Fiorentina spell in the stats, but I acknowledge it'll no longer be a direct comparison because of the difference between the English and German leagues.
Salah is now the active Premiership player closest to Shearer's record, he's on 153 goals, while Shearer finished on 260. The next nearest active player on the list is Raheem Sterling on 120 goals.
No comments:
Post a Comment