Every league has a team like Warrington. Their purpose is to look like they could win the league, if everything lines up for them, and then things suddenly just don't line up for them. And the just don't continues for a long period of time.
In Warrington's case, the "and then something went wrong" has lasted since 1955 (they have won the Cup since then, but never the league). Even their own fans sing a song about it. "It's always our year, it's always our year, same as the next one, it's always our year." and so on.
In 2024, everything was starting to look like they might win. Sam Burgess as coach seemed to be the magic ingredient. It didn't, of course, end with them winning the league but 2025 could be their year.
I try not to torment them too much, because they aren't a bad team, usually, and because I really like Stefan Ratchford as a player (
https://en.wikipedia.org/wiki/Stefan_Ratchford). Yes, I know, thou shalt not covet thy neighbour's stand-off, but I have wanted him on my team since before his nose was a non-Euclidean nightmare.
And Saints lost.
Lost to a team who had a man red carded in the 20th minute. And another one yellow carded later.
It wasn't going to be Saints's season, was it.
But I get ahead of myself...
The point-scoring and point-conceding matrix diagrams look pleasingly similar with some small differences.
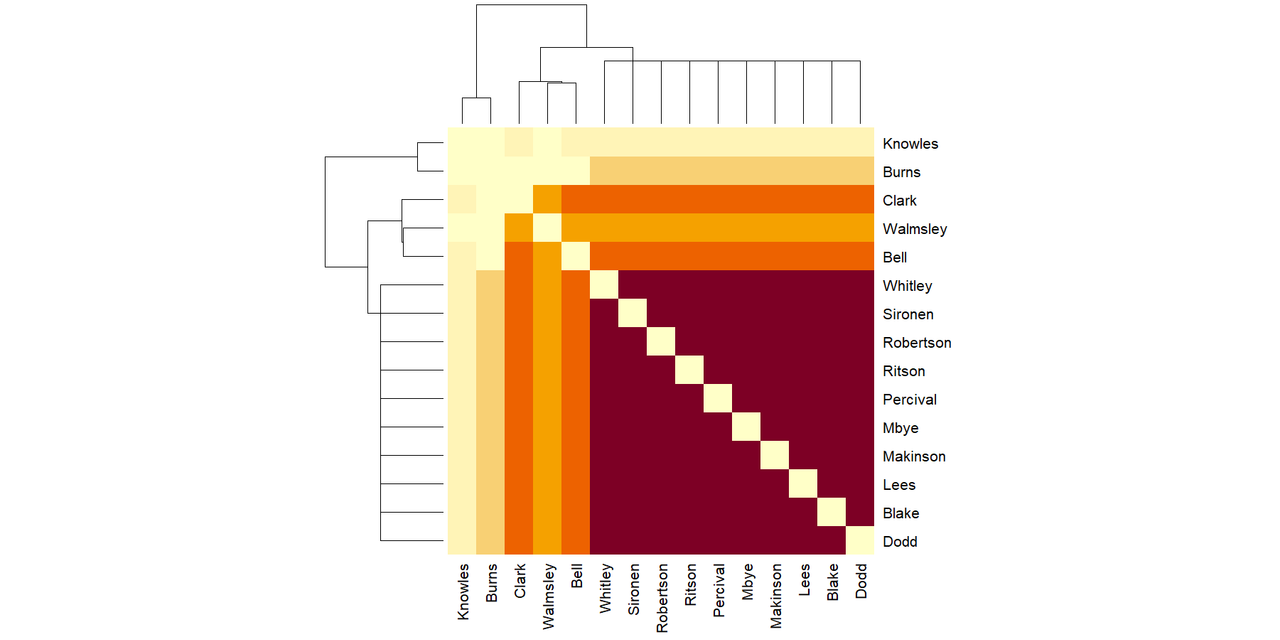
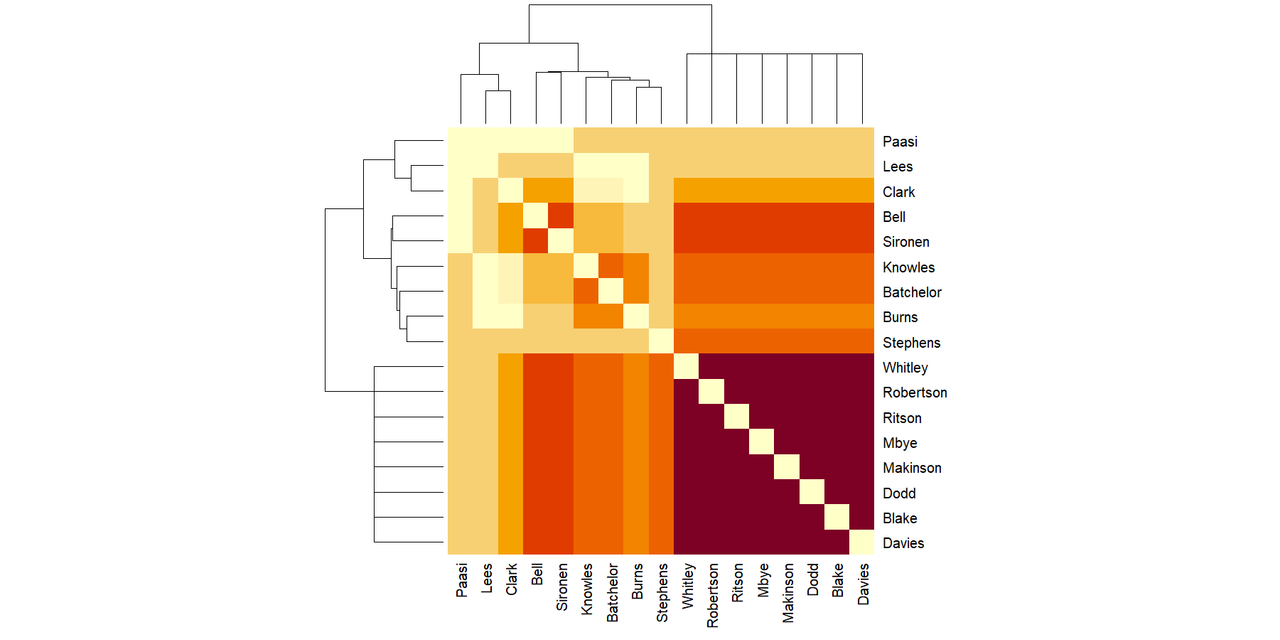
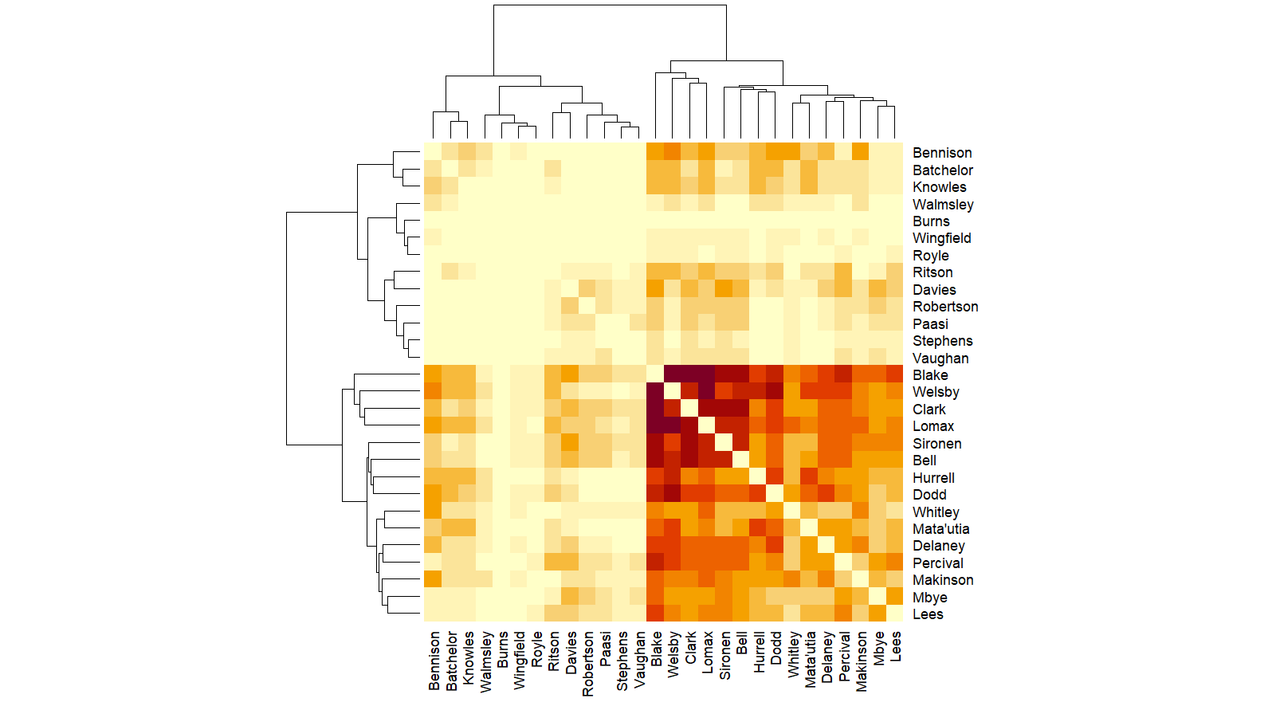
Saints players who played together when Saints scored in game 20:
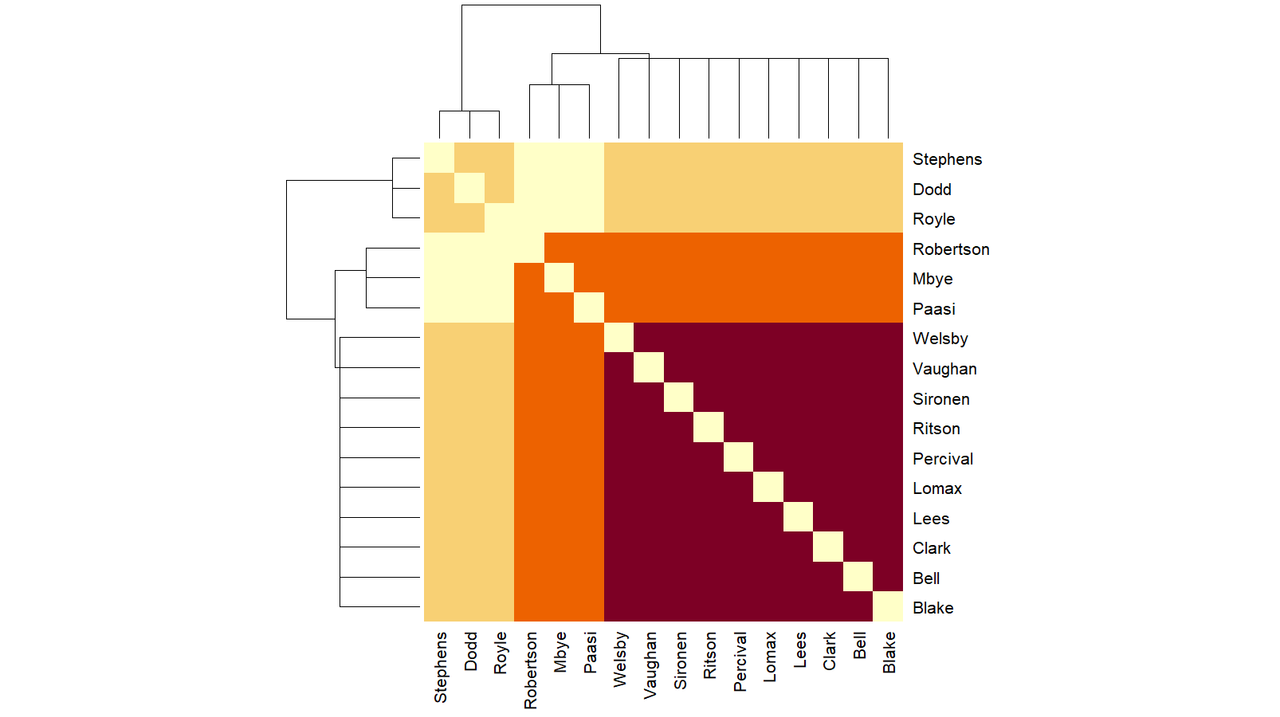
The really interesting thing is the pale zone that shows Robertson, Mbye and Paasi didn't play with Stephens, Dodd and Royle.
Saints players who played together when Saints conceded in game 20:
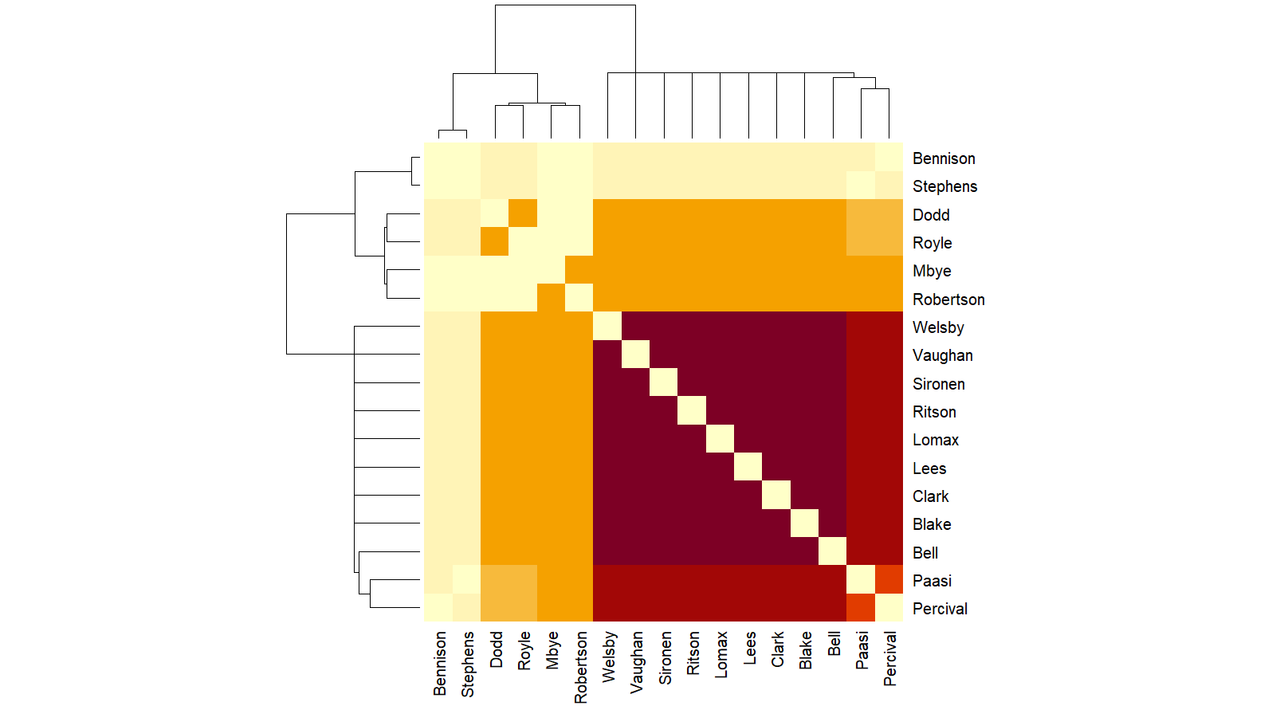
So it's quite clear that Stephens and Paasi are the people swapping on and off for each other.
How does that affect the season-long charts?
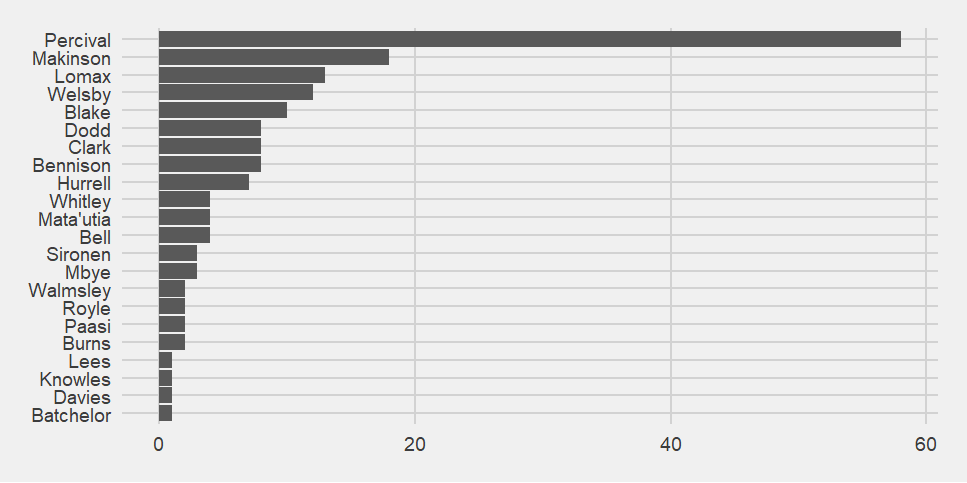
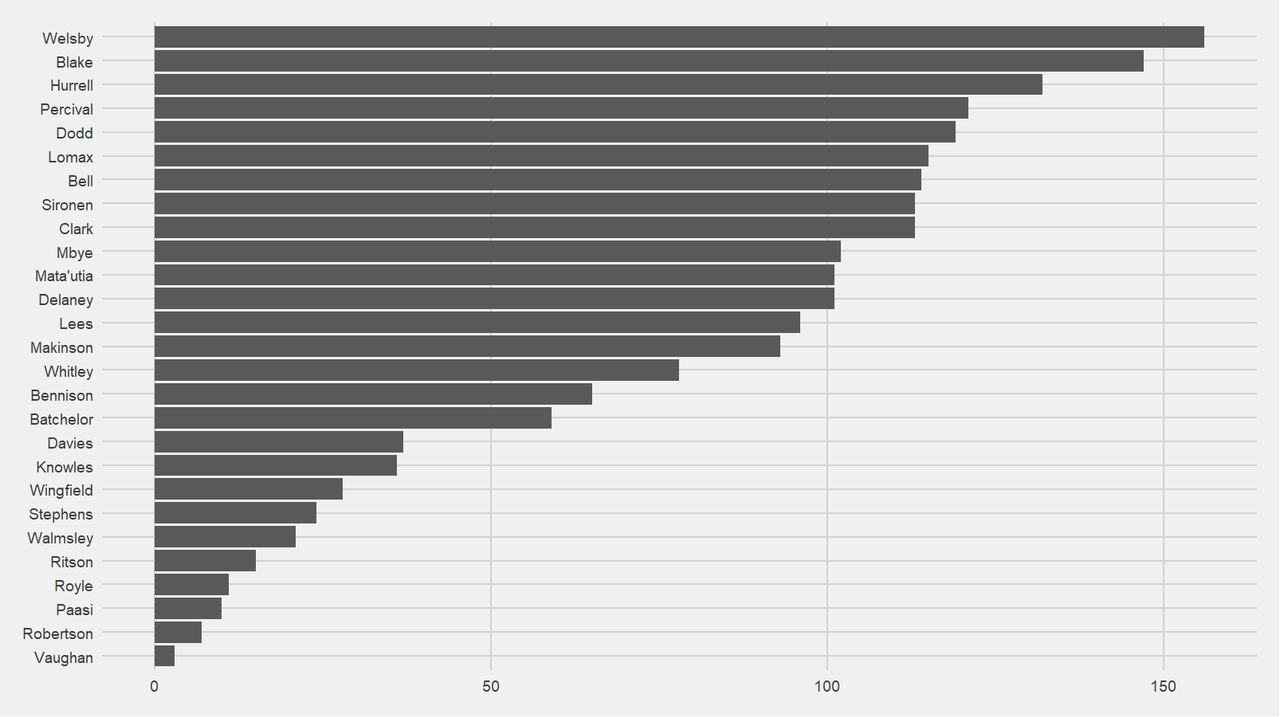
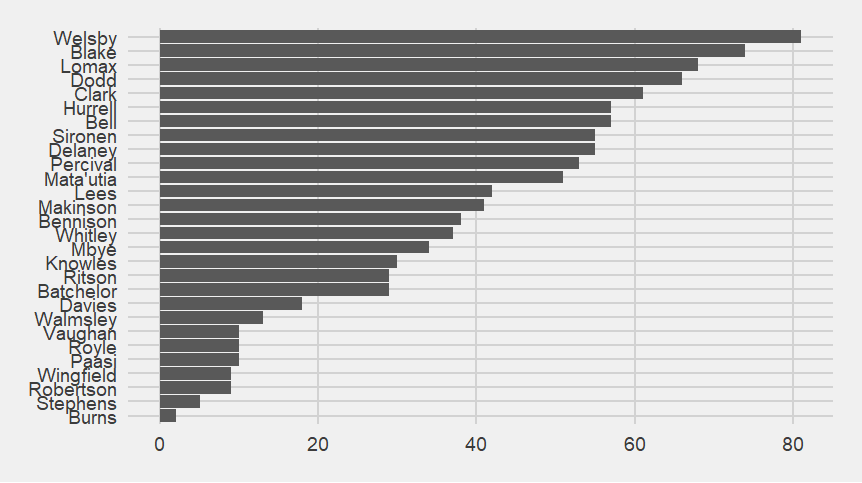
20 players have now scored for Saints.
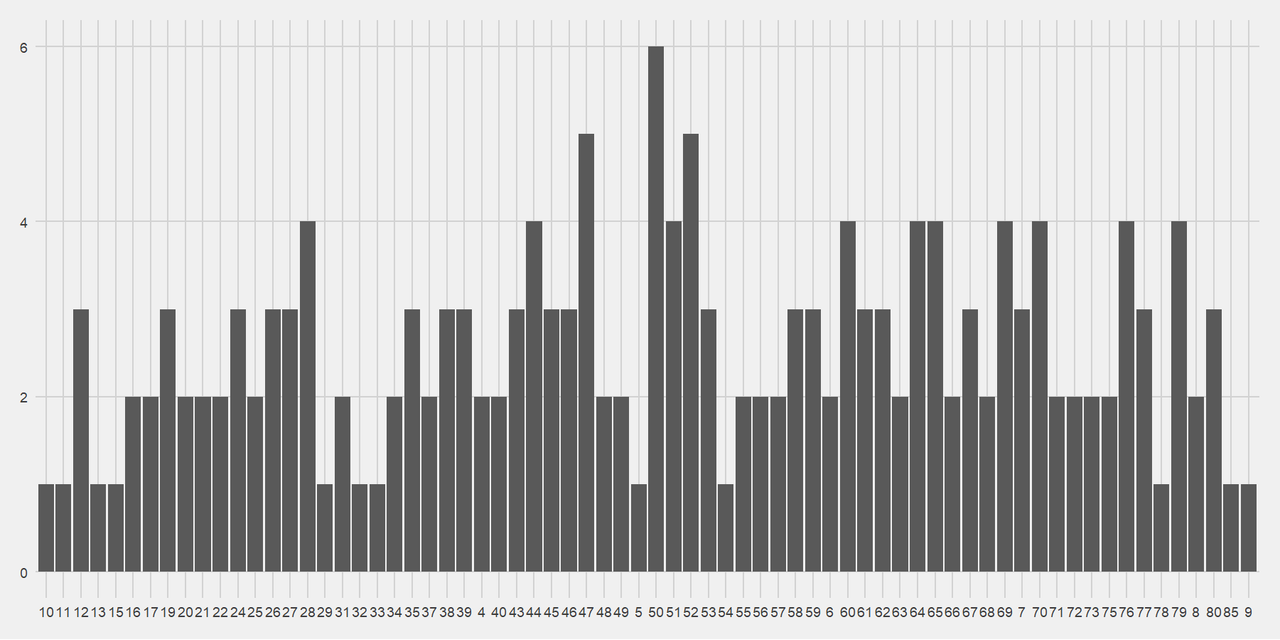
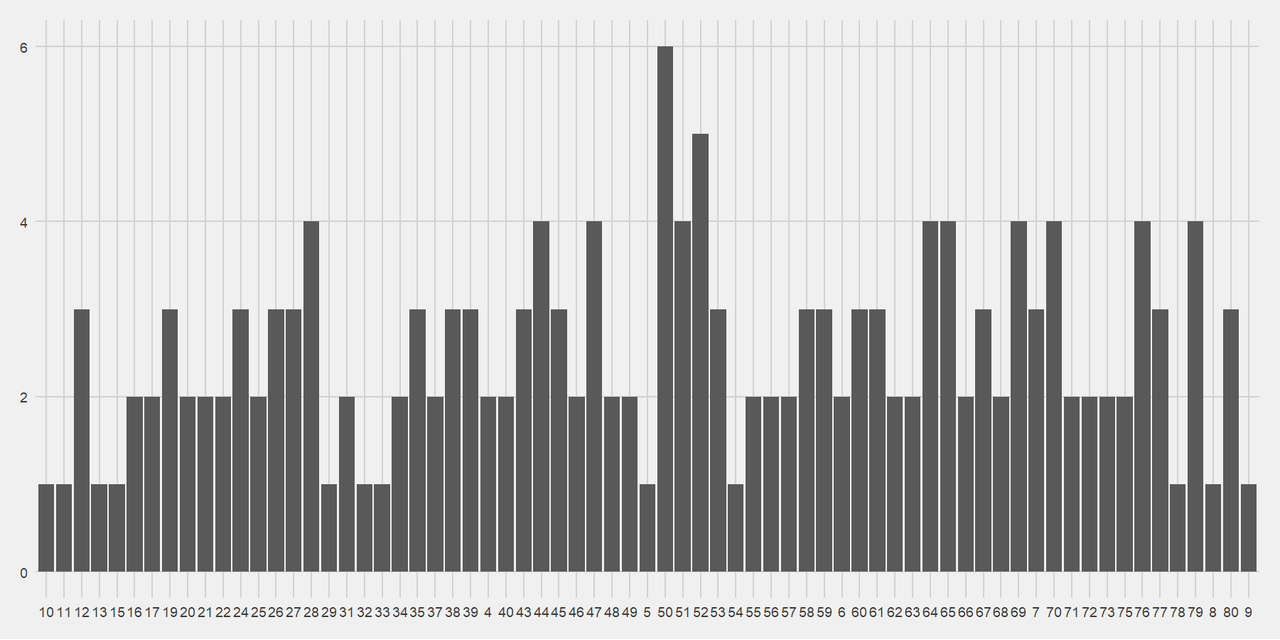
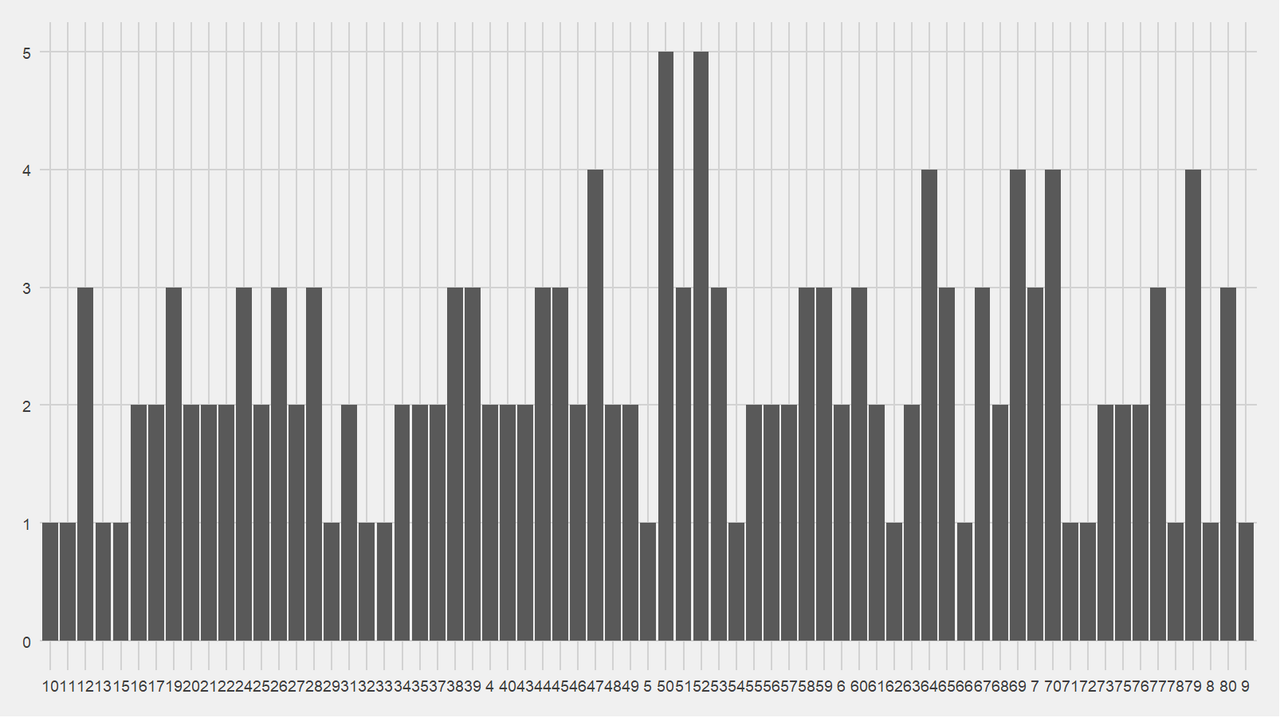
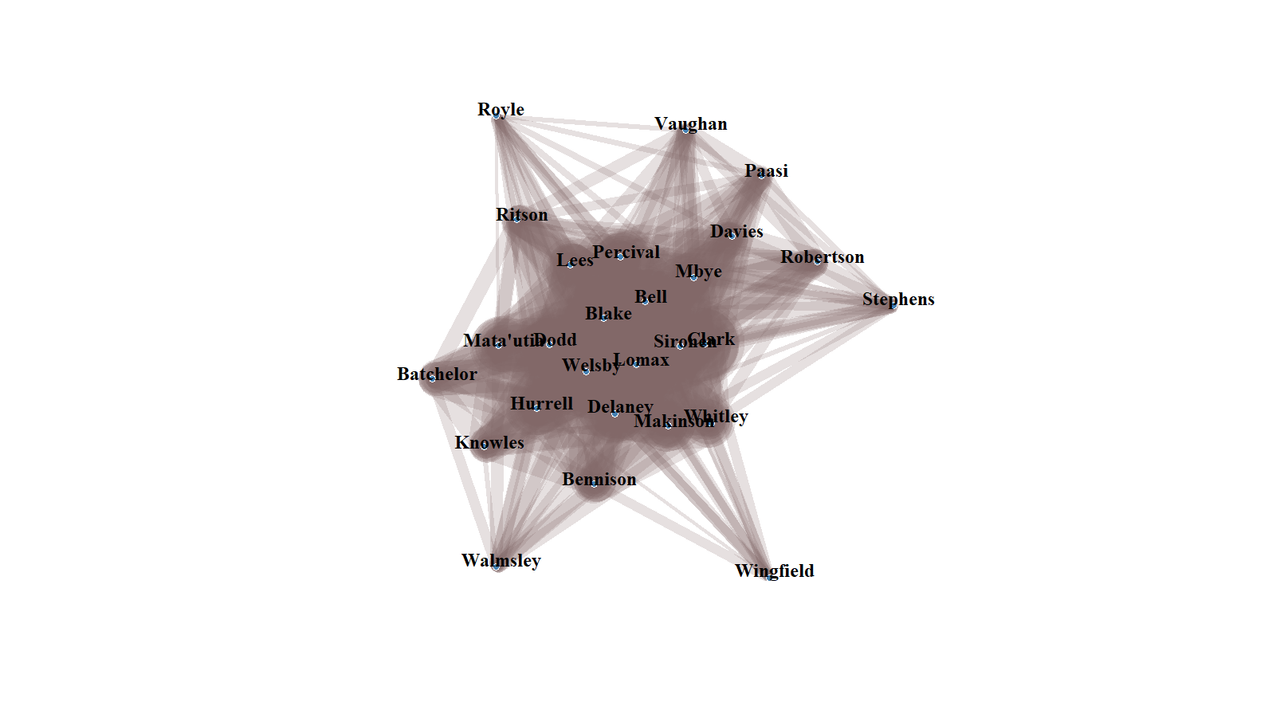
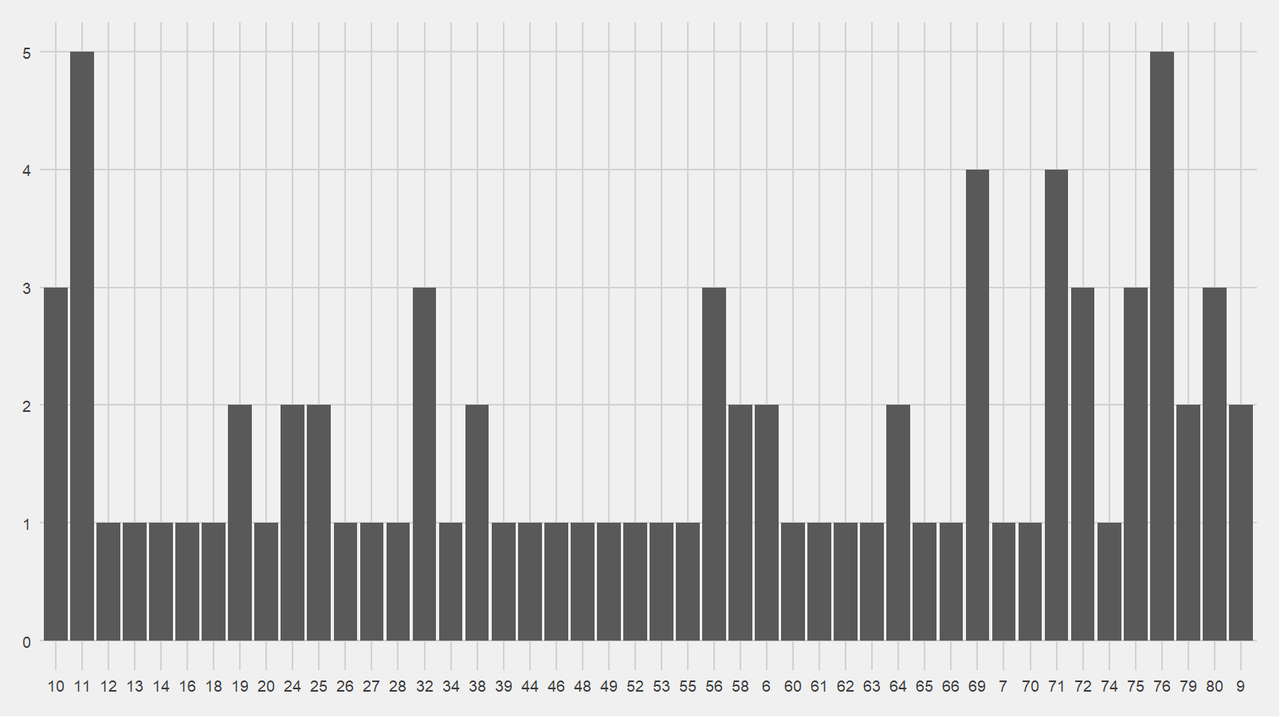
When do Saints score?
It looks like Saints score more in the second half than the first.
Jack Welsby is still ever present when Saints score.
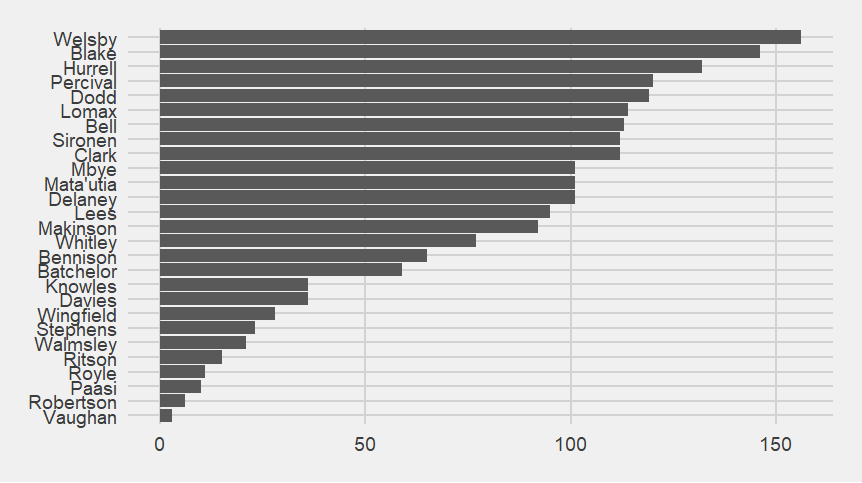 Hurrell is dropping down the ranks because of injury.
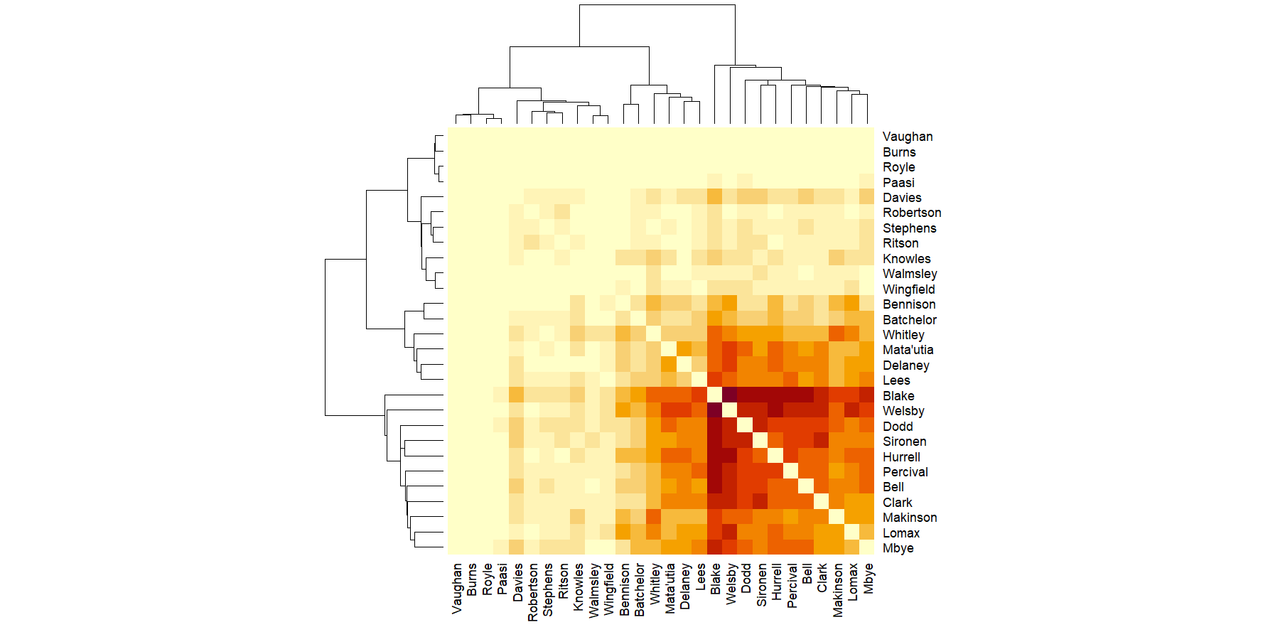
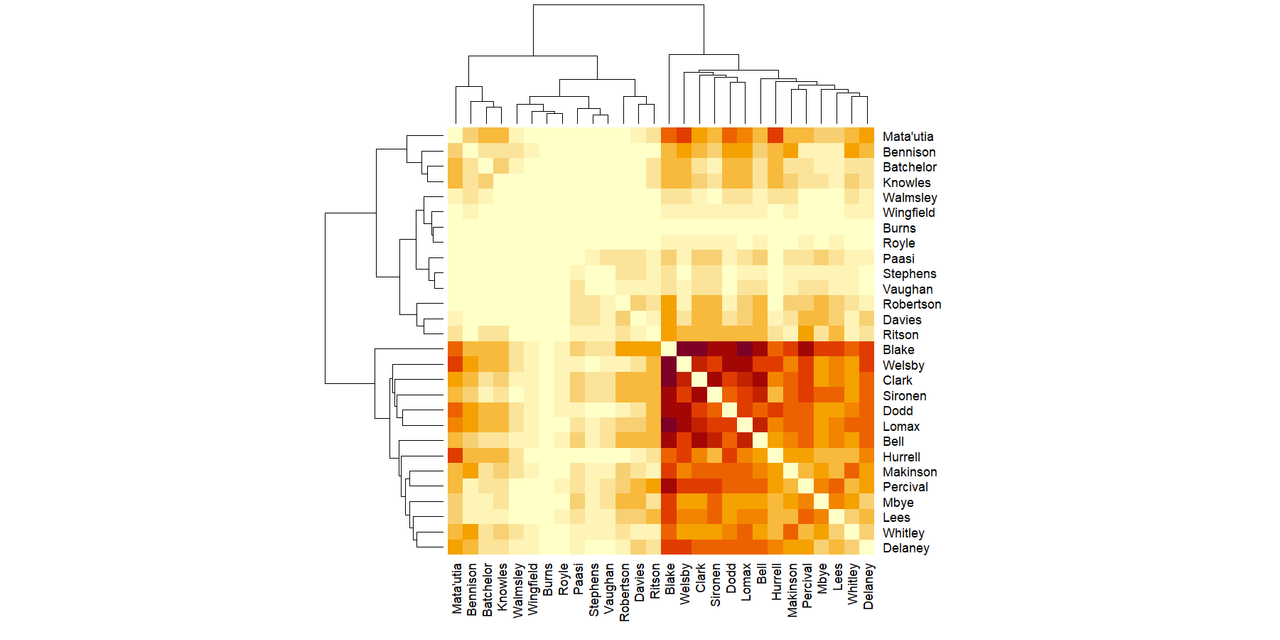
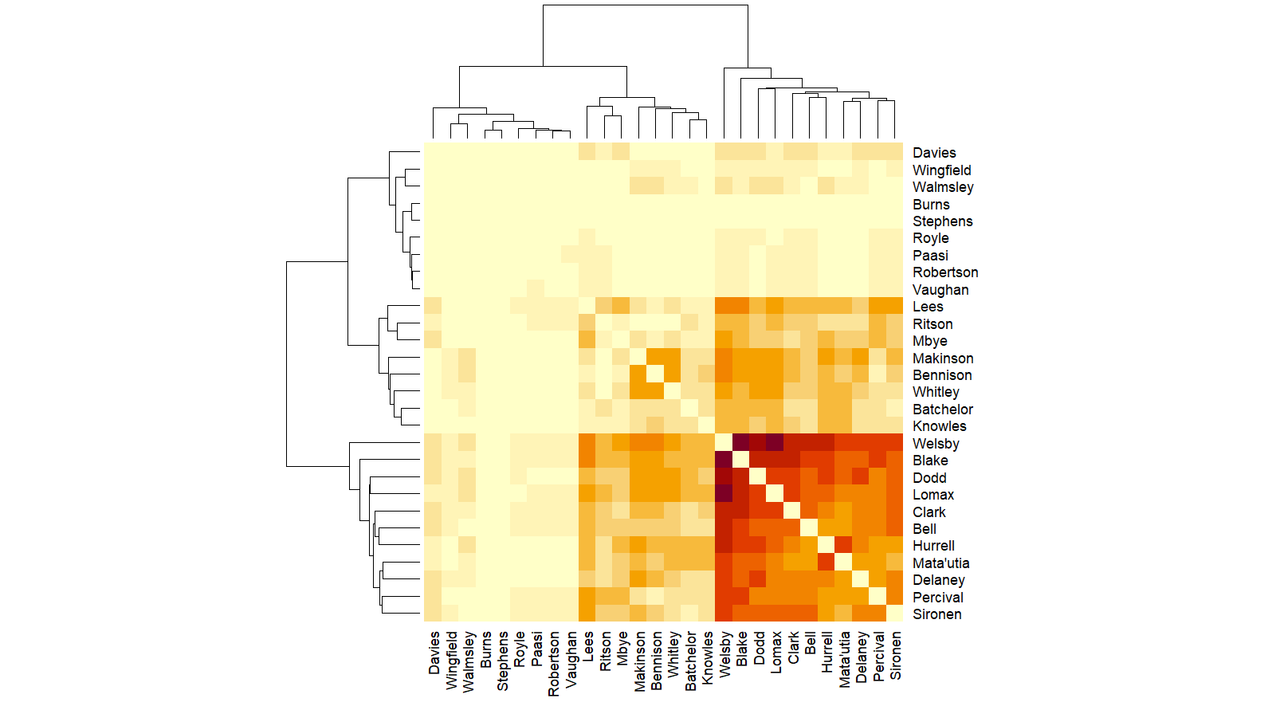
The "who is present when Saints score?" matrix now looks really complicated.
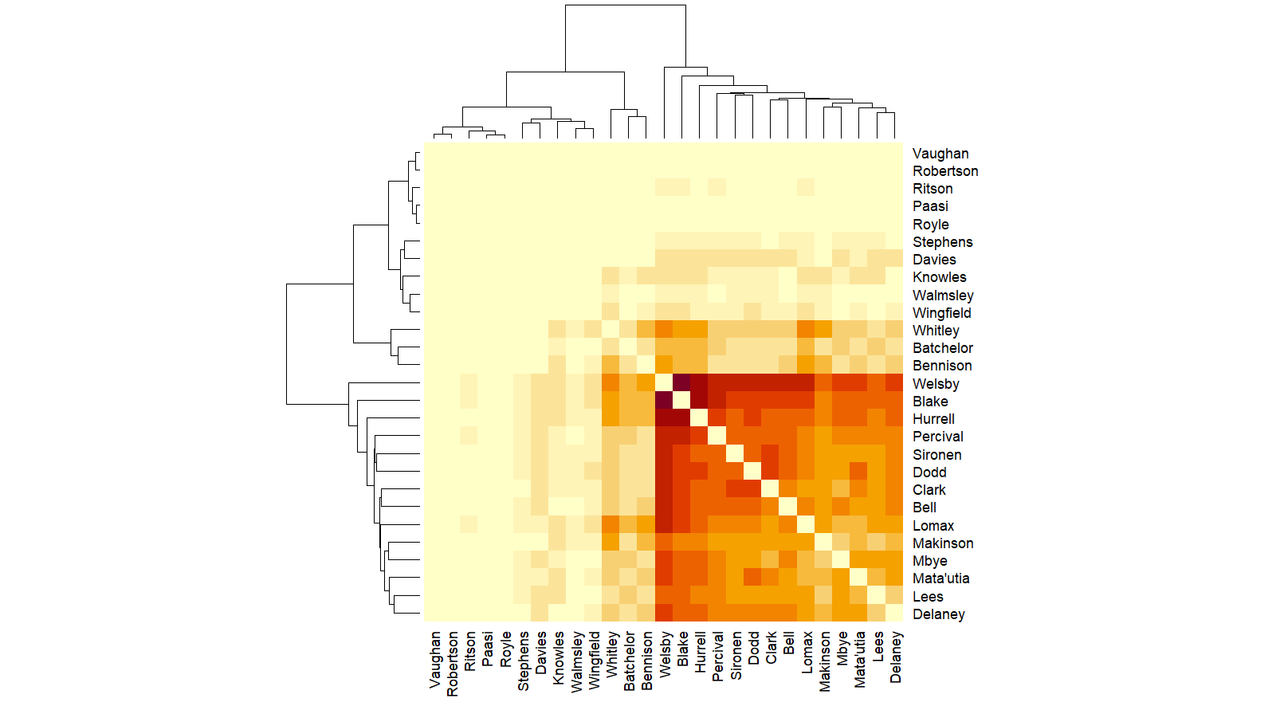
The Davies, Ritson, Stephens, Paasi and Royle subgroup is definitely starting to form.
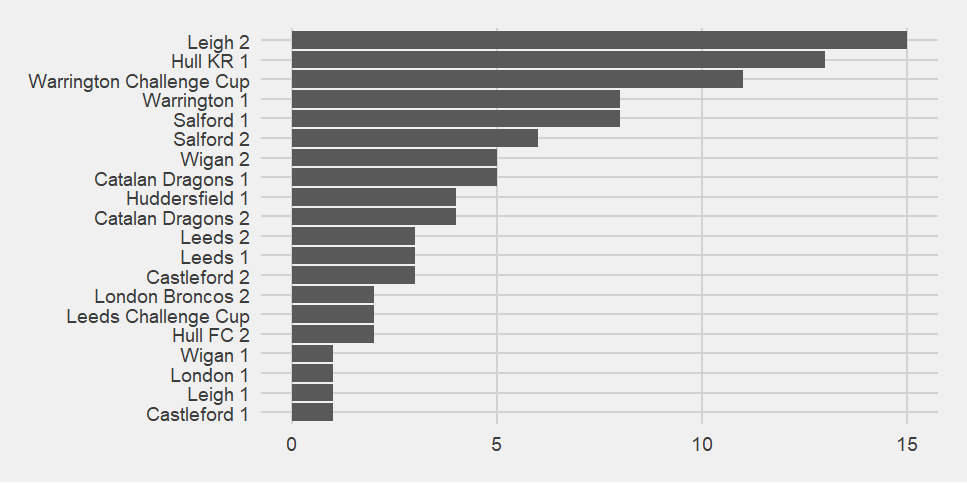
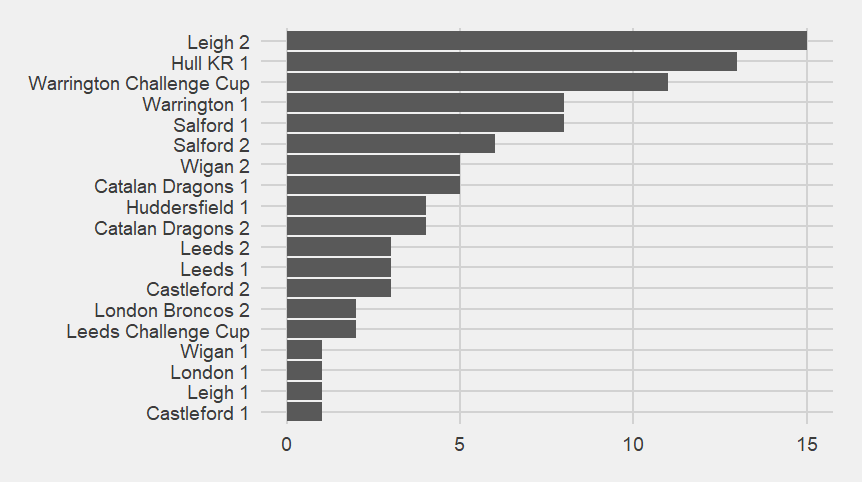
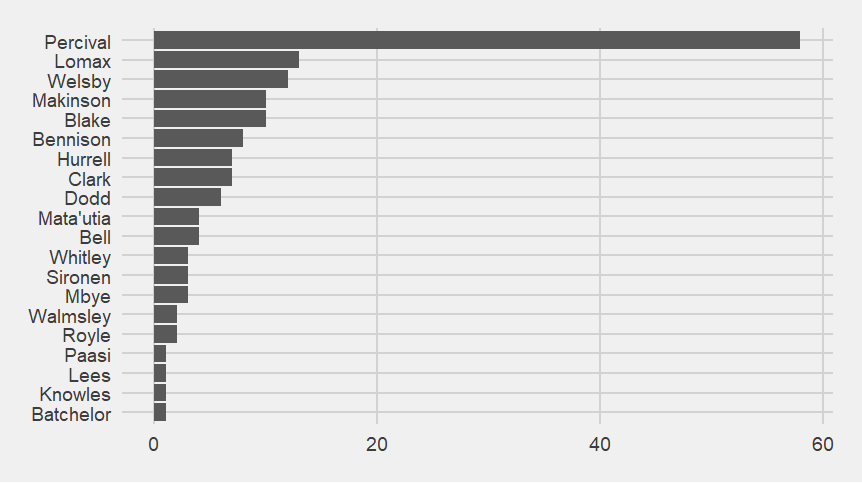
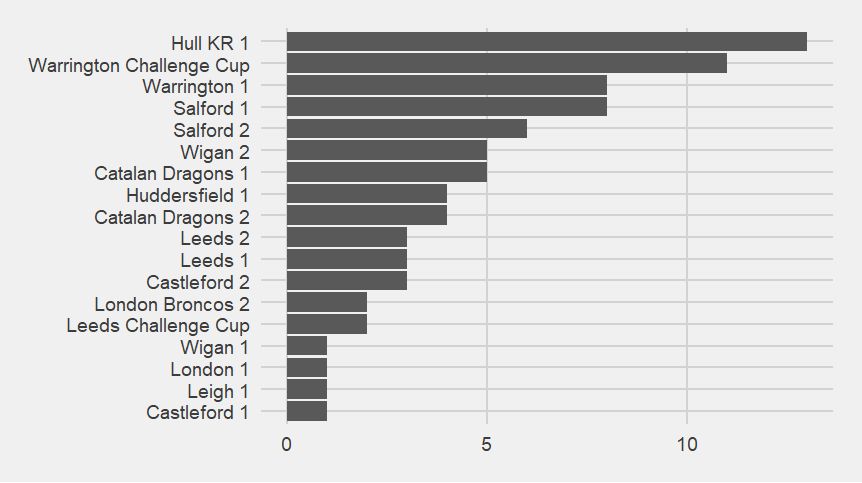
Warrington hold two of the top 3 places in the "who scored against Saints?" bar chart.
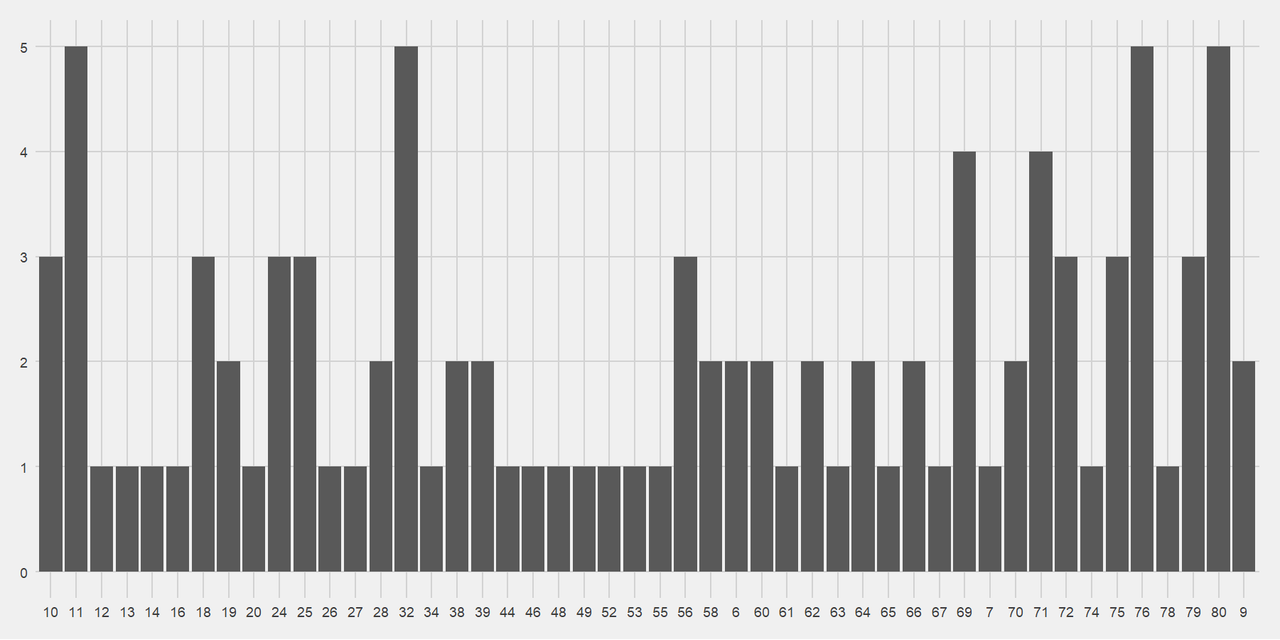
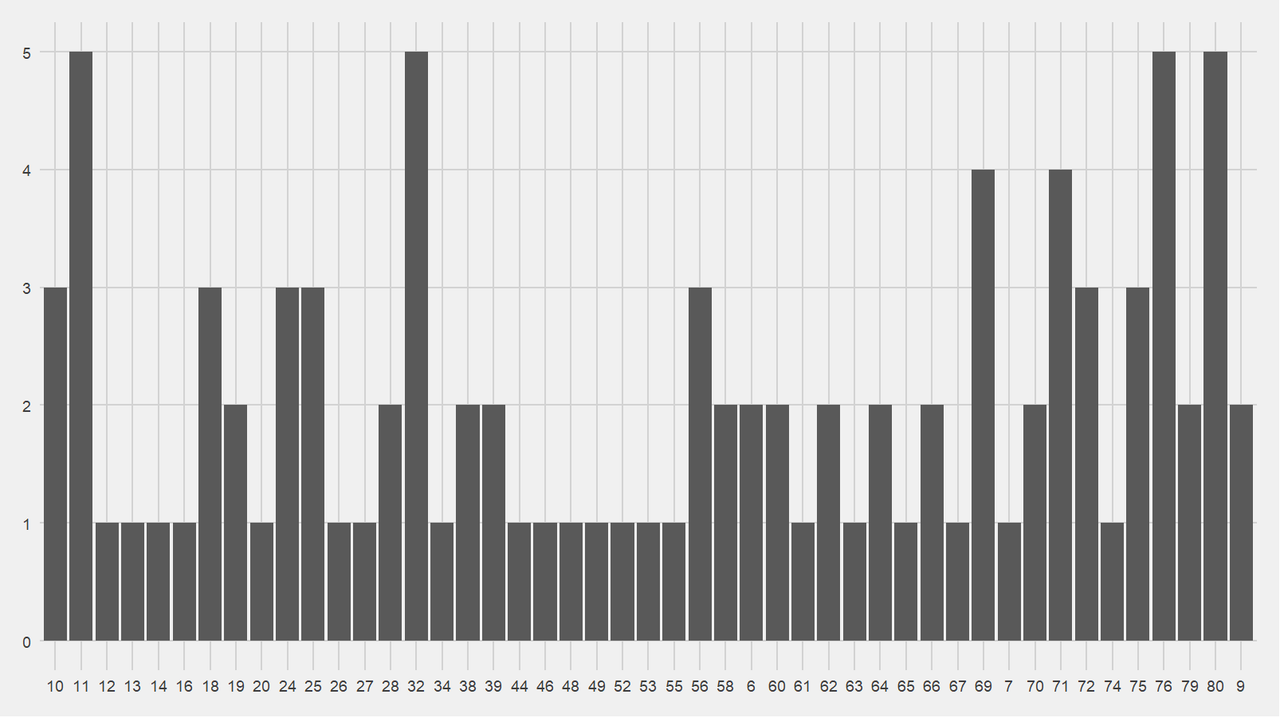
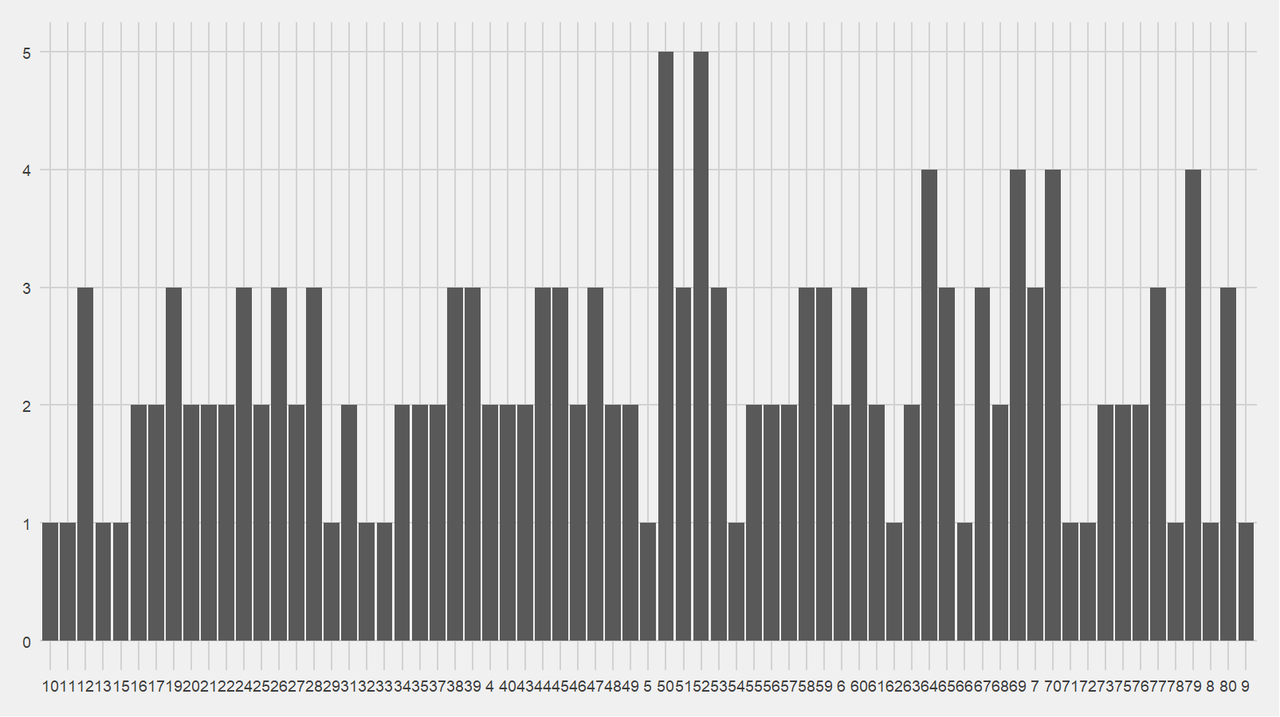
When do Saints concede?
The pattern of Saints conceding in minutes 9-12 or 70 onwards continues.
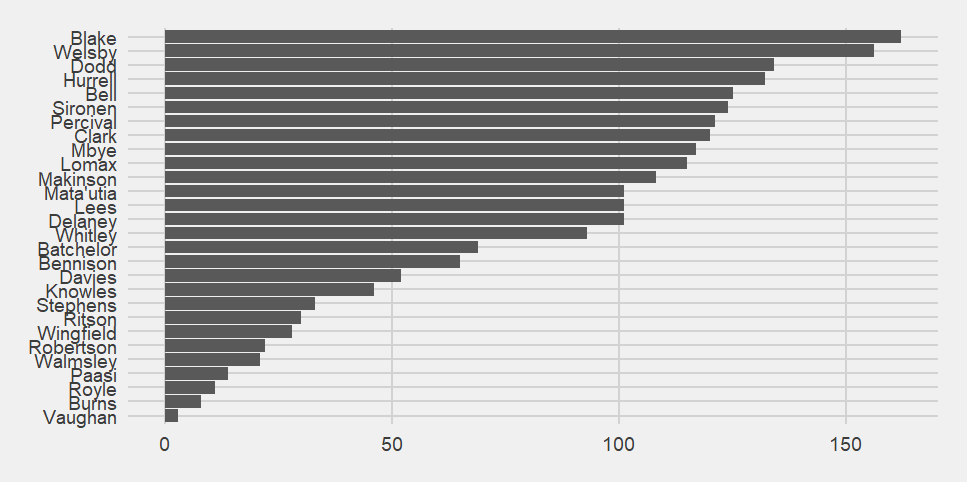
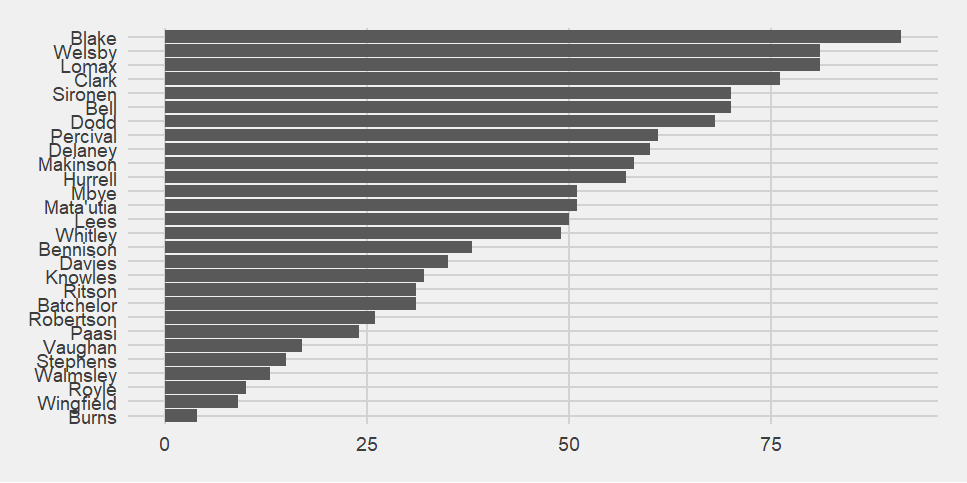
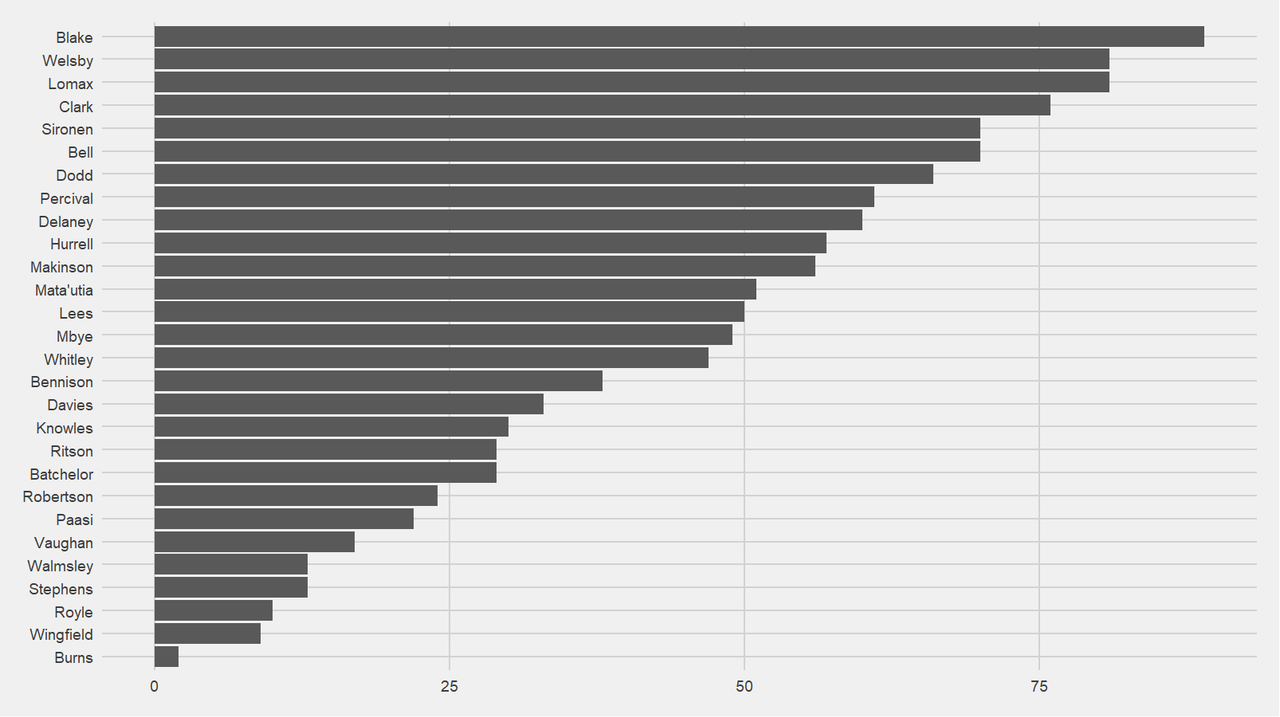
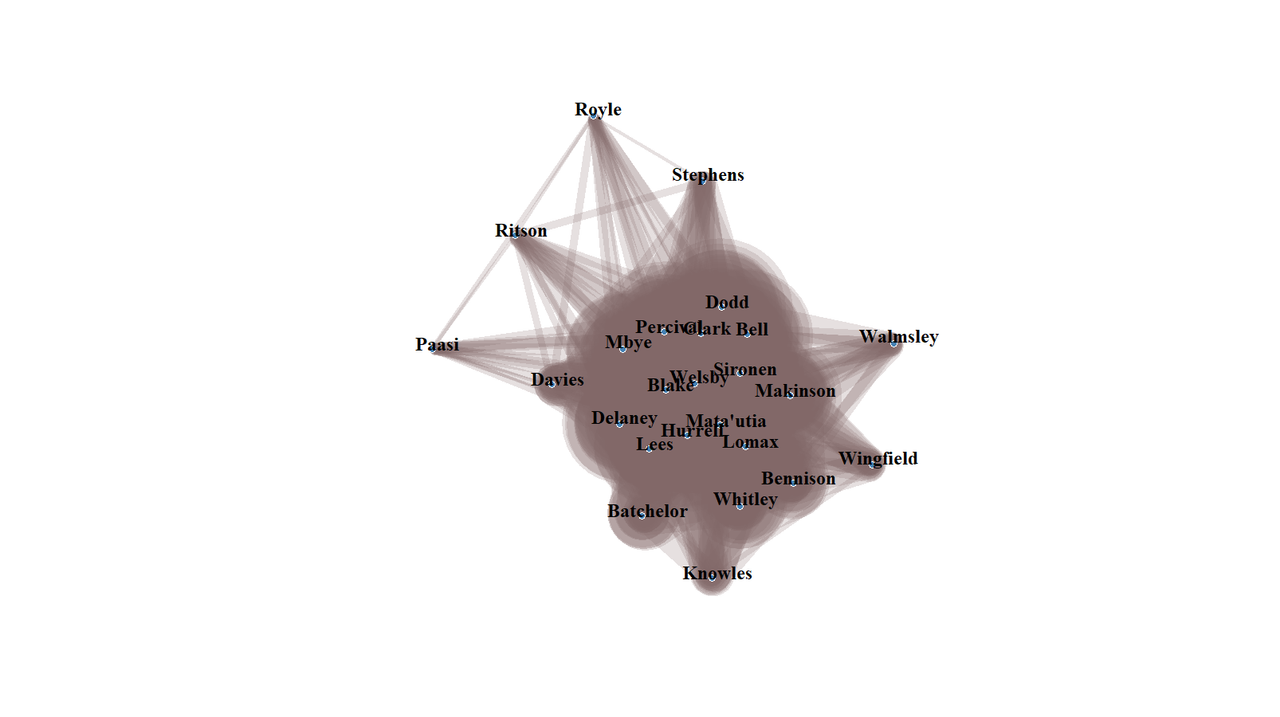
Who is present when Saints concede?
 Because the last few games have featured Saints conceding, Hurrell's drop is even bigger here.
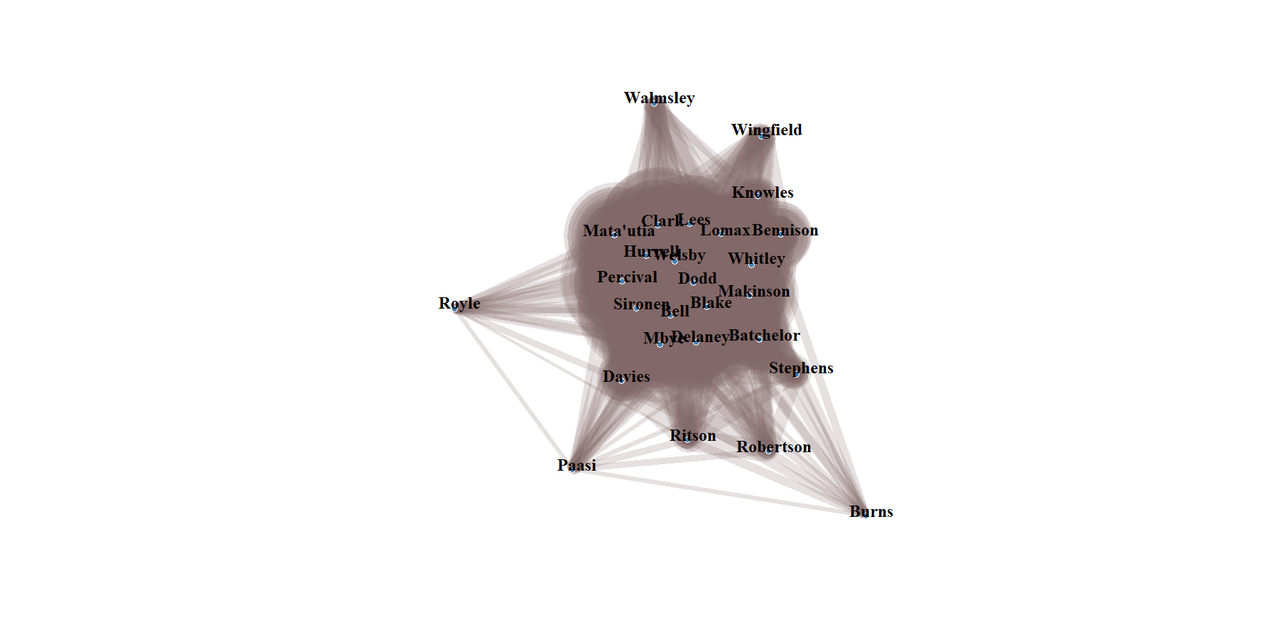
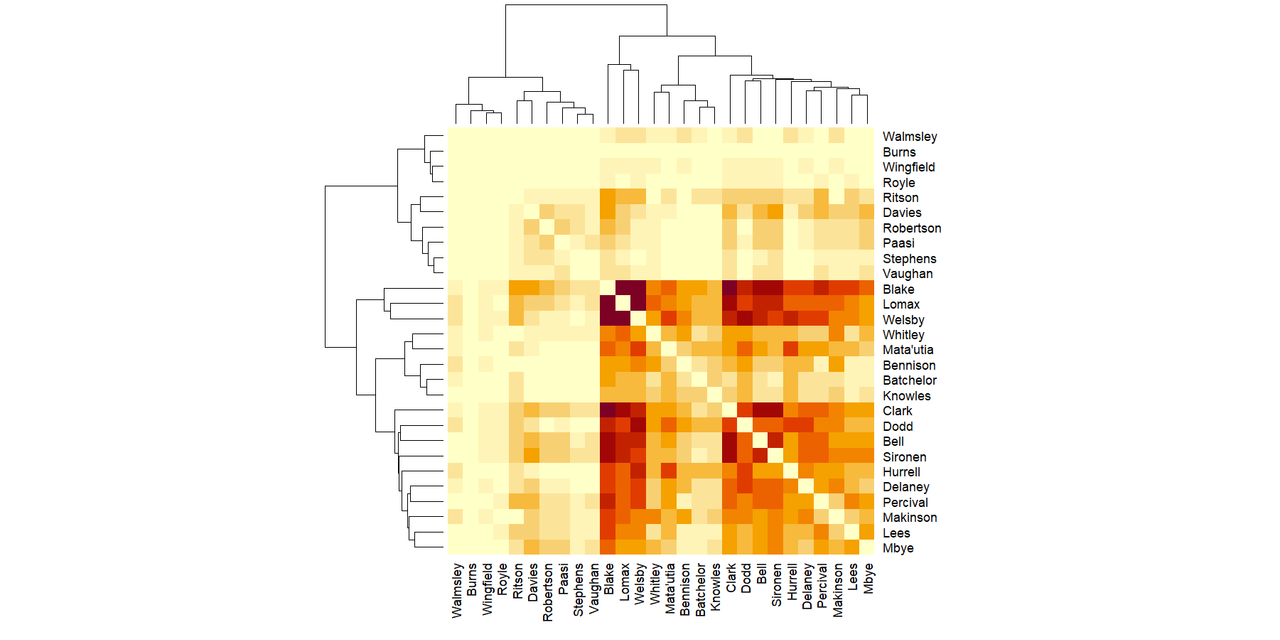
The "who is present together when Saints concede?" matrix diagram is still made of three distinct thirds.
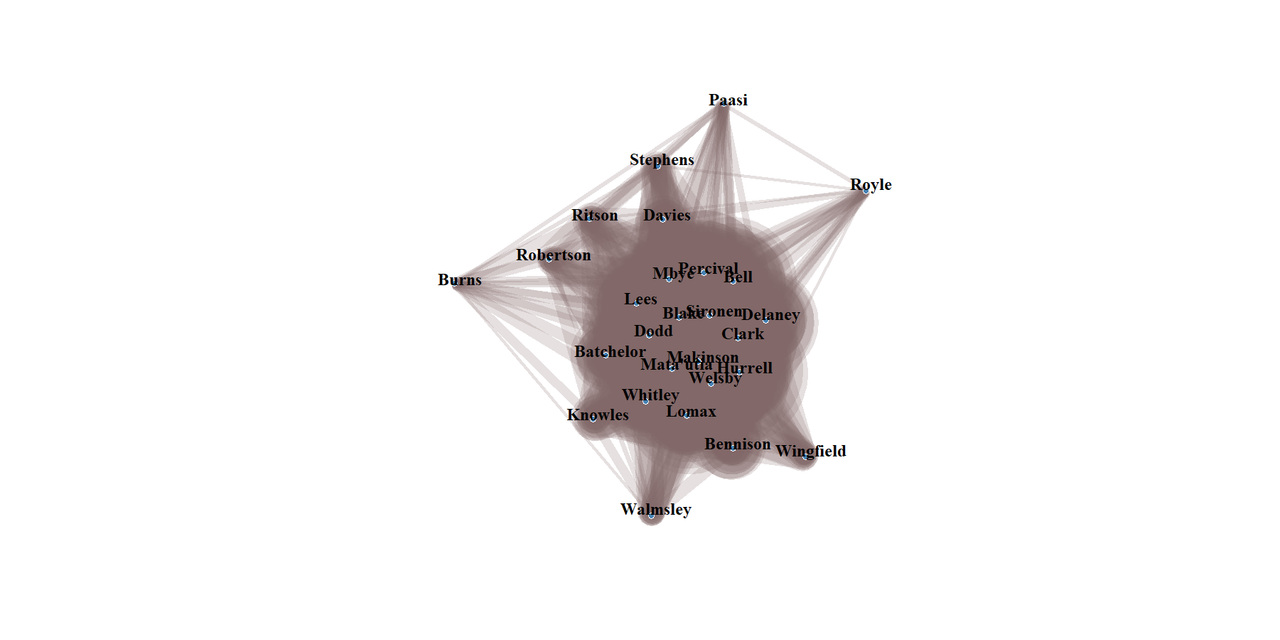
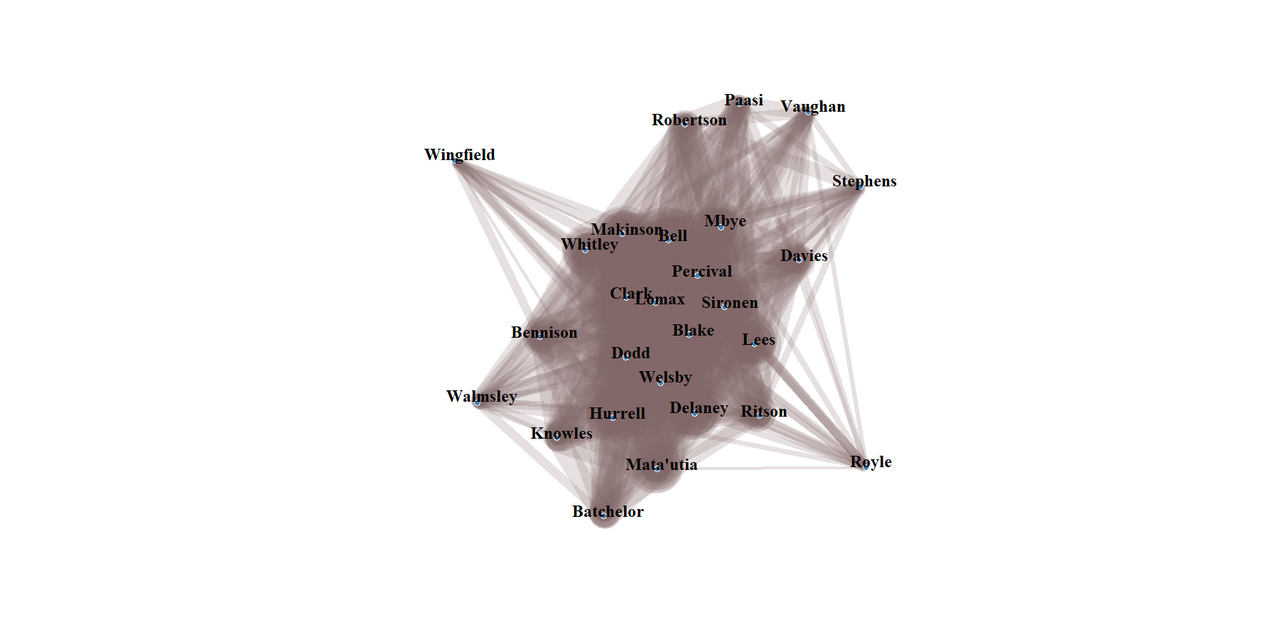
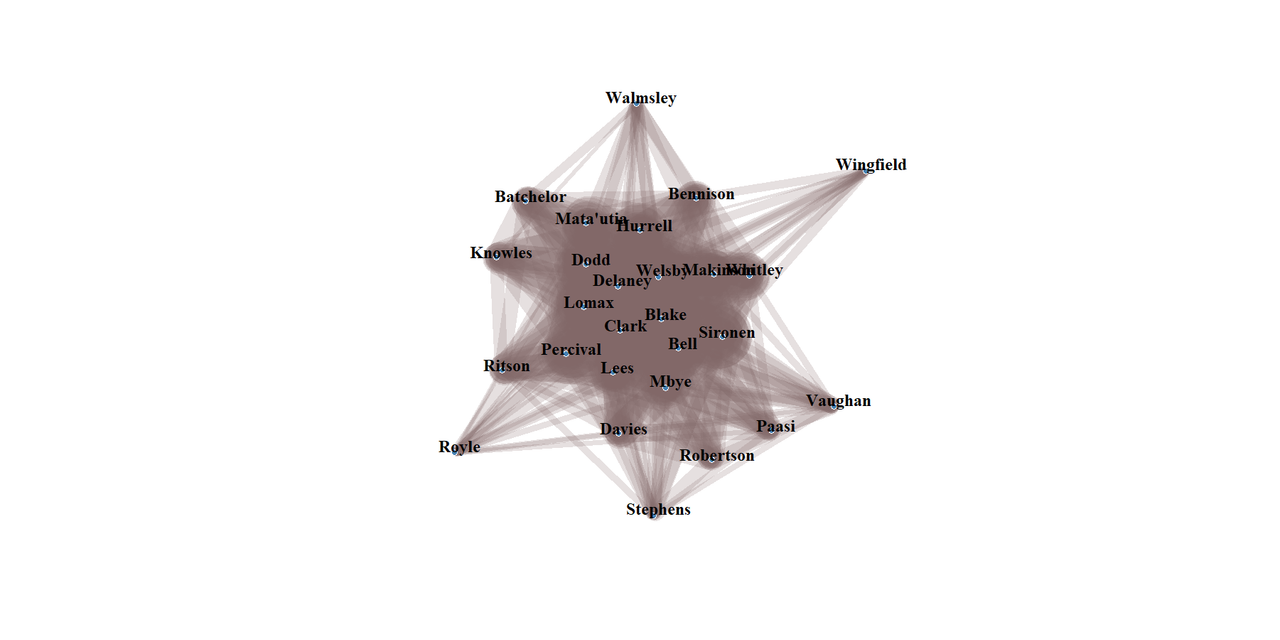
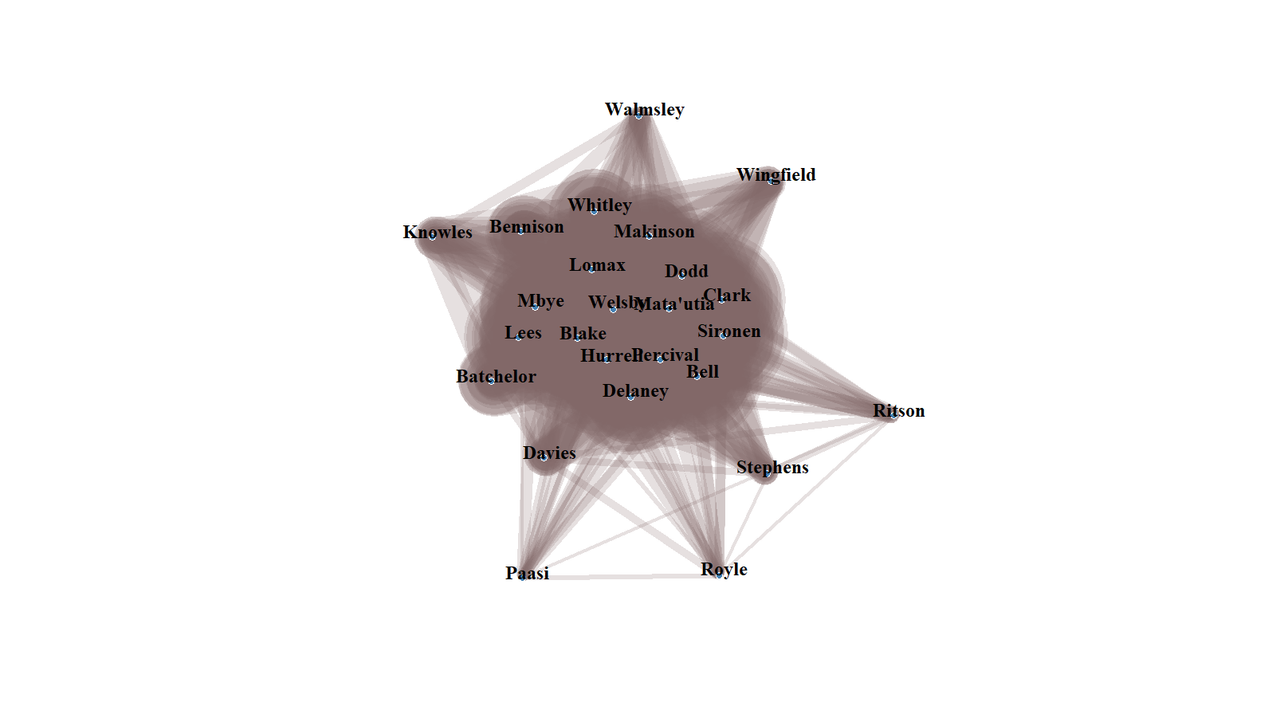
The network graph of who is together when Saints concede looks very different, more like a starfish with the central blob having lots of extended tentacles.
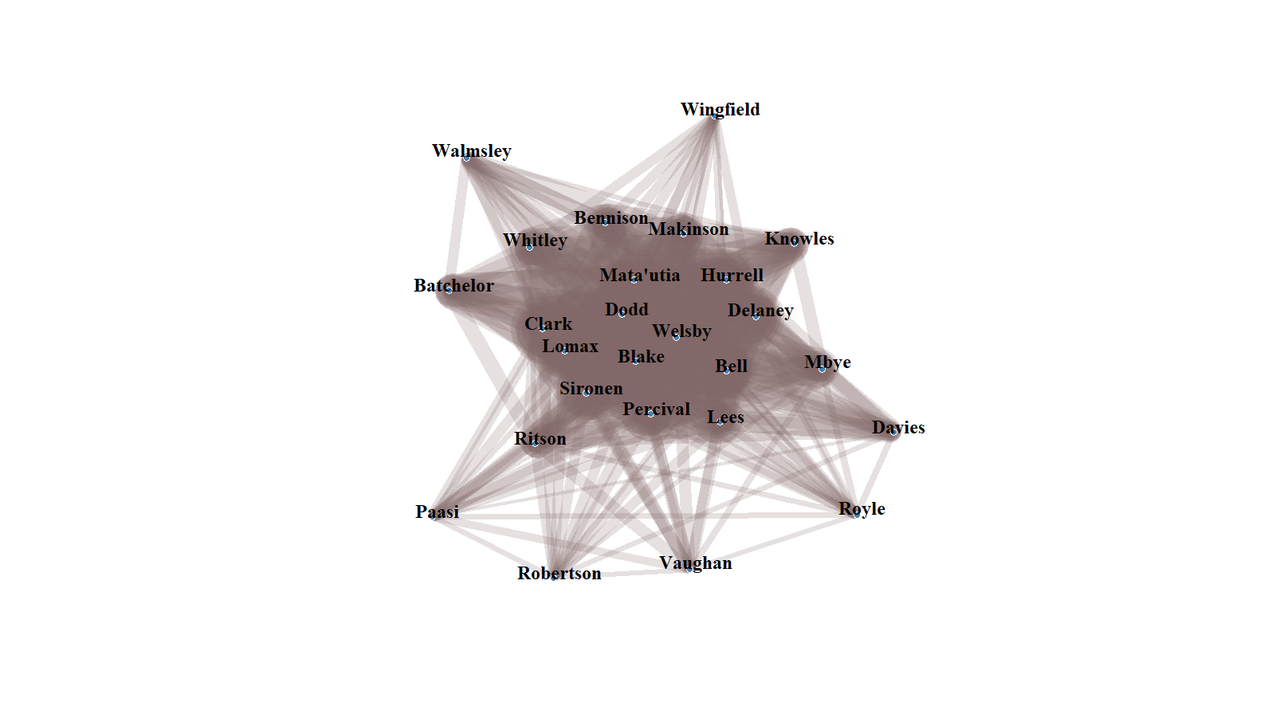
Secondary sub-teams, playing together because of injuries to others, are definitely starting to appear.