Friday, 28 February 2025

Saints ahoy! - Game 21 and season to date

This is one of the games where I know there are errors in the data. At various points Stephens swapped on for players who weren't on the pitch and I'm not sure when Mbye came on. I do not blame the overworked Saints social media fella, but it'd be nice if Super League tried to give me this information.

(I am not entirely joking when I threaten to do this for St. George Illawarra this season because the NRL has proper stats. Lack of time will be the only thing that stops me.) 

Game 21 itself was also a disappointment, because Saints lost 46-4 to Leigh. So not only did they beat us twice, they beat us twice in leopard print undercrackers (https://www.saintsrlfc.com/2024/07/26/saints-well-beaten-by-leigh/). The two yellow cards for Saints didn't help. 

It turns out the reason the social media team didn't say when Mbye came on was because they were in denial about Welsby going off. Which I really don't blame them for. 

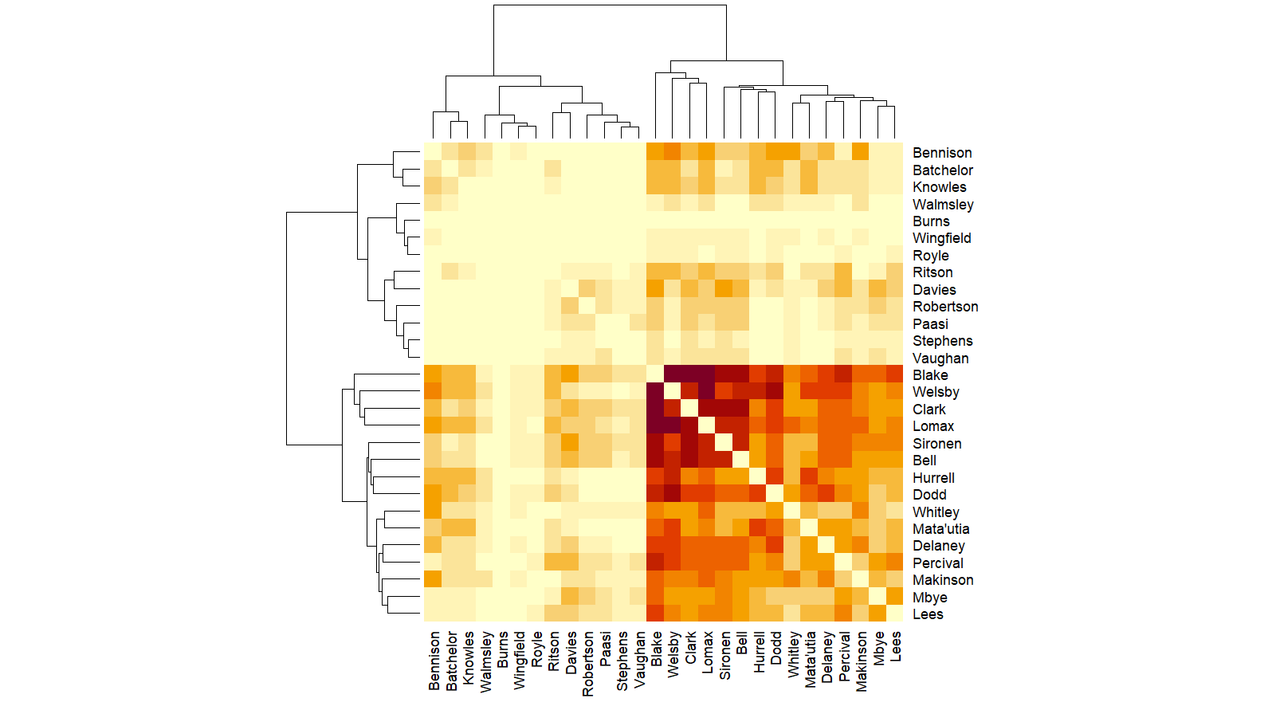
Some quick reworking later, there are better figures. 

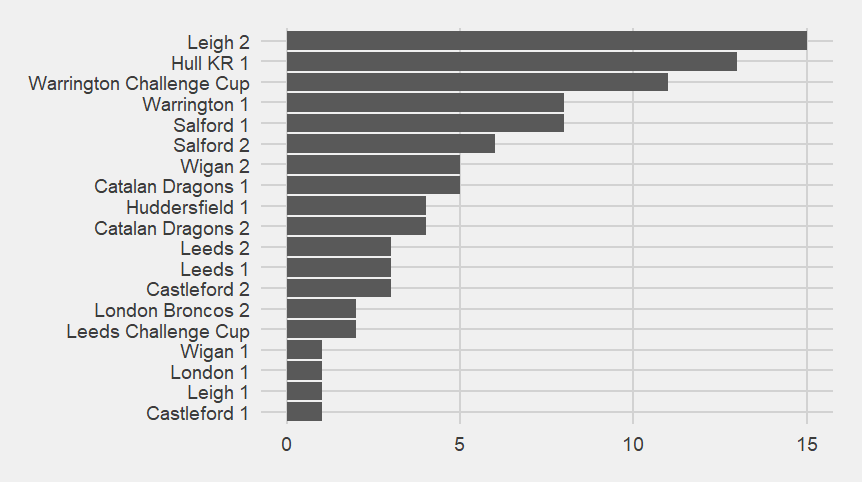
This Leigh team are now the team who have scored the most against Saints in 2024. Bar chart of point-scoring moments against Saints.  Leigh in game 21 have the most with 15. 

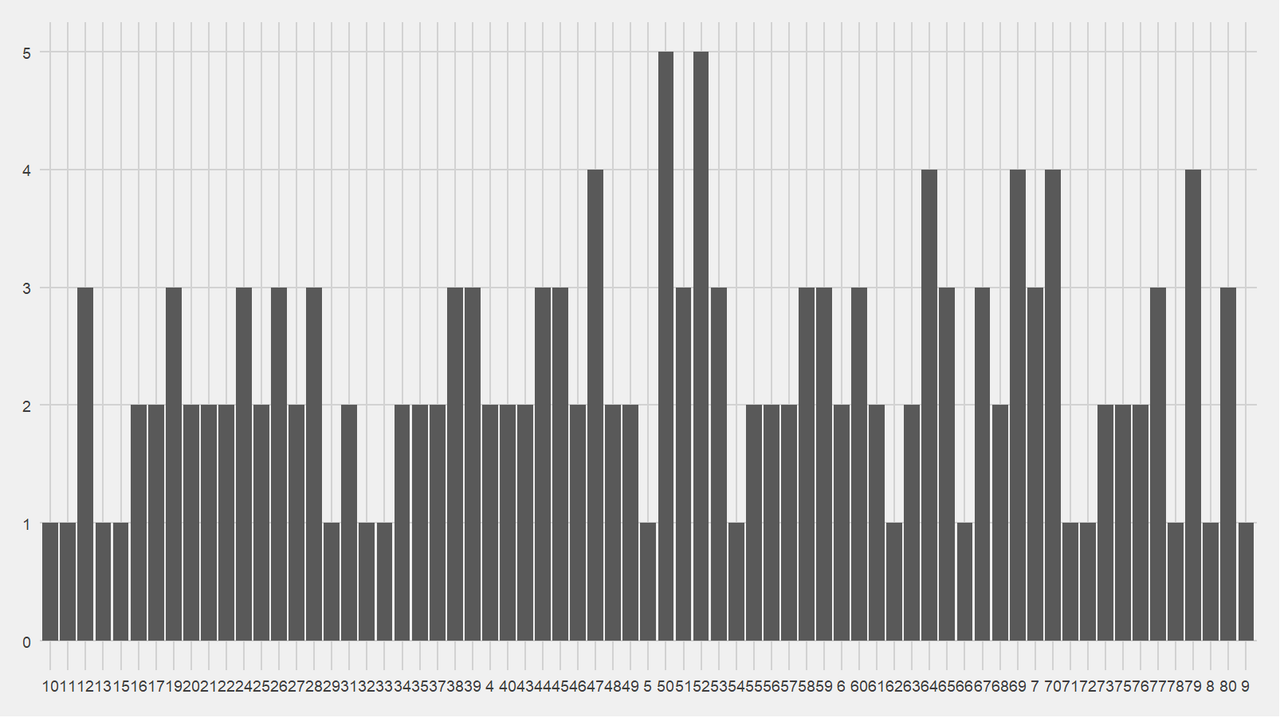
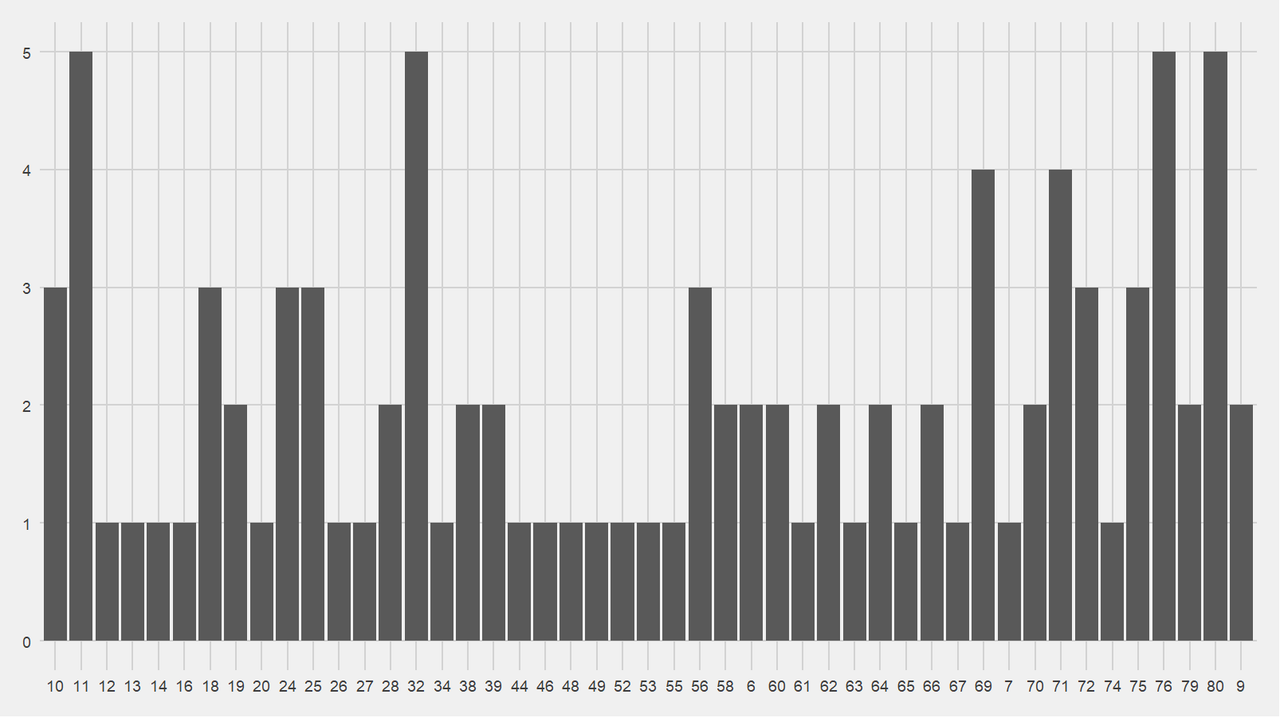
There continues to be a pattern of Saints scoring in minute 50-53. Bar chart showing when Saints score.  The two minutes with five point-scoring moments in are minute 50 and 52.  Minute 51 and 53 have 3 point-scoring moments each 
There are 4 minutes where Saints have conceded 4 point-scoring moments, with some evidence that they concede often in the last 10 minutes. Bar chart of when Saints concede.  Minutes 11, 32, 76 and 80 have 4 point-conceding moments.  There is a general shape that suggests Saints concede often in the last 10 minutes. 
Because of injury in this match, Welsby is no longer ever present when Saints score. He is still the player most often present when Saints score, but that's because they only scored once in game 21. Bar chart of who is present when Saints score.  Welsby is still present for the most, 156, followed by Blake and Hurrell.  Paasi, Vaughan and Robertson are present for the least, but Vaughan and Robertson are new this season. 
Because of the injury, Welsby is no longer the player present most often when Saints concede. Bar chart of who is present when Saints concede.  Blake is now present for the most, followed by Welsby and Lomax.  Royle, Wingfield and Burns are present for the least. 

The "who is present together when Saints score" is now four quadrants, with a intermediate group between them. The intermediate group are Whitley, Batchelor and Bennison. Whitley is just back from injury, which might explain it. 

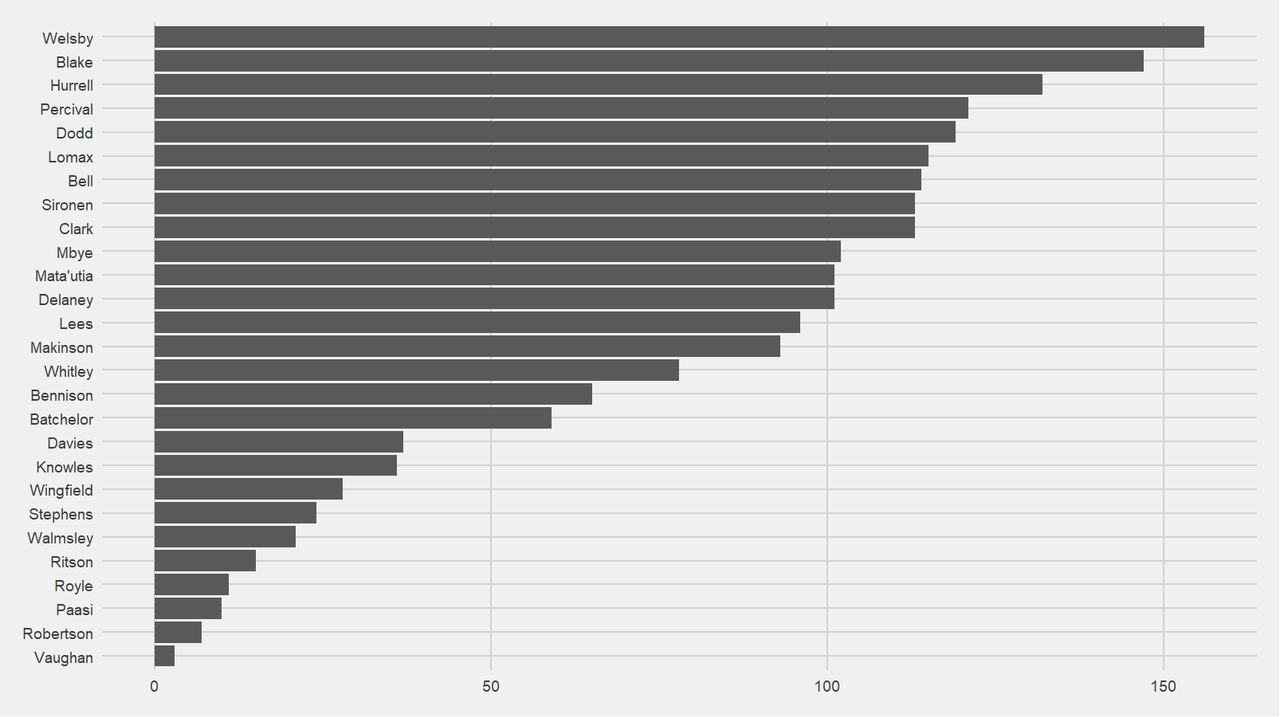
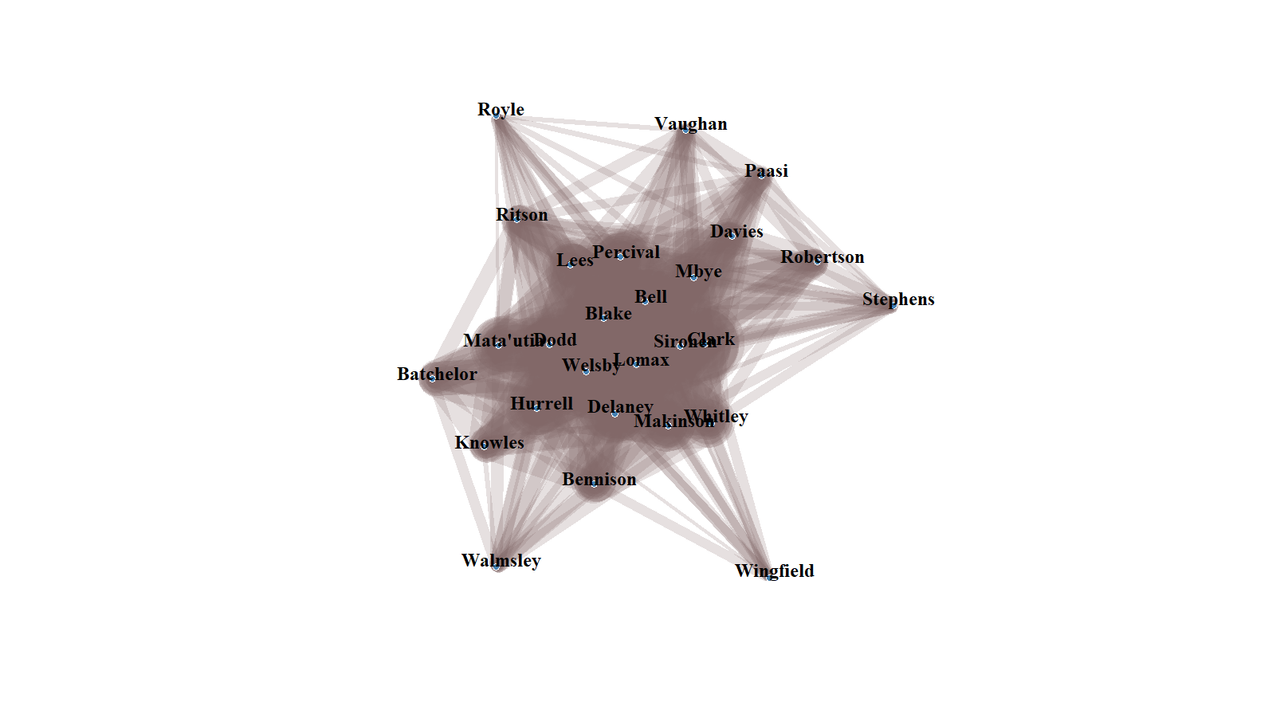
The line that interests me is Ritson's, because where it crosses Lomax, Percival, Blake, and Welsby's, it is darker than expected. Not by much, but enough to be seen. Matrix graph as described above.  The darkest, most often together, section is bottom left, with pale areas covering the top and leftermost parts. 

The who-is-present-together-when-Saints-concede matrix is fascinating. Matrix diagram of who is present together when Saints concede.  The reason it is fascinating is that the paler areas have parts that look like fractals or crenelations.  I cannot explain them statistically. 

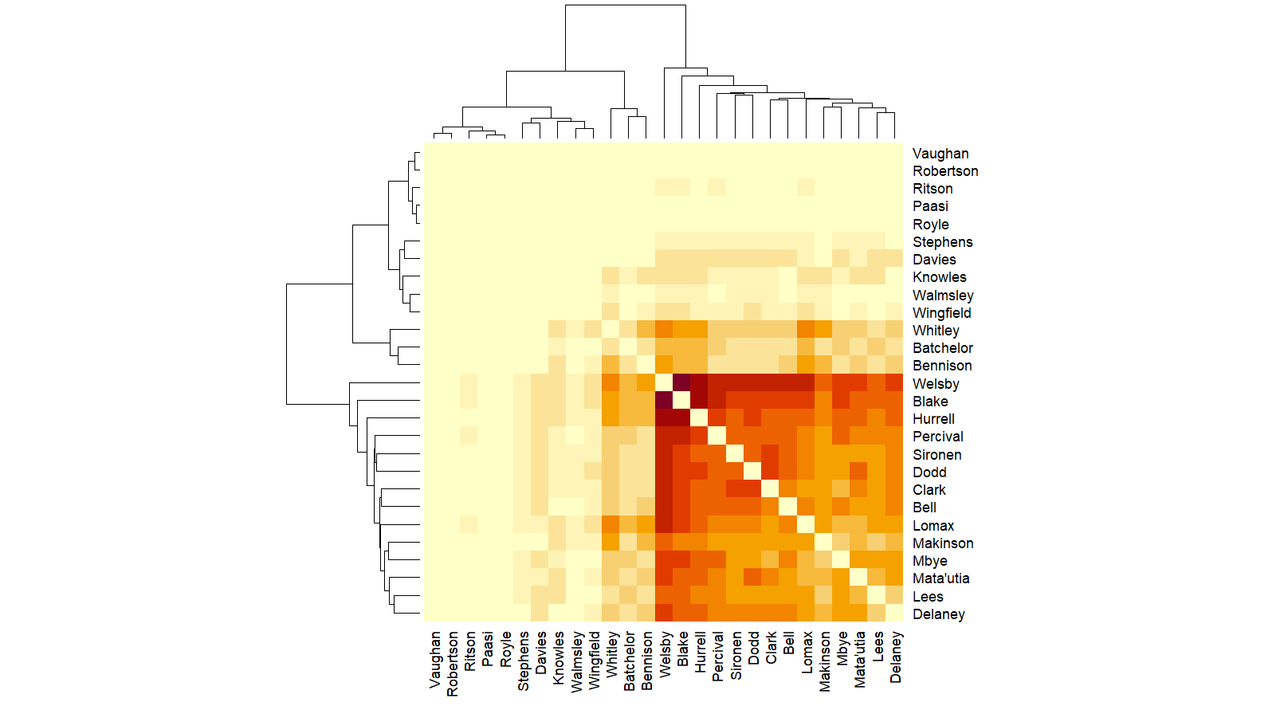
My best guess for why is something about Welsby's injury, combined with the many point-conceding moments in this game. 

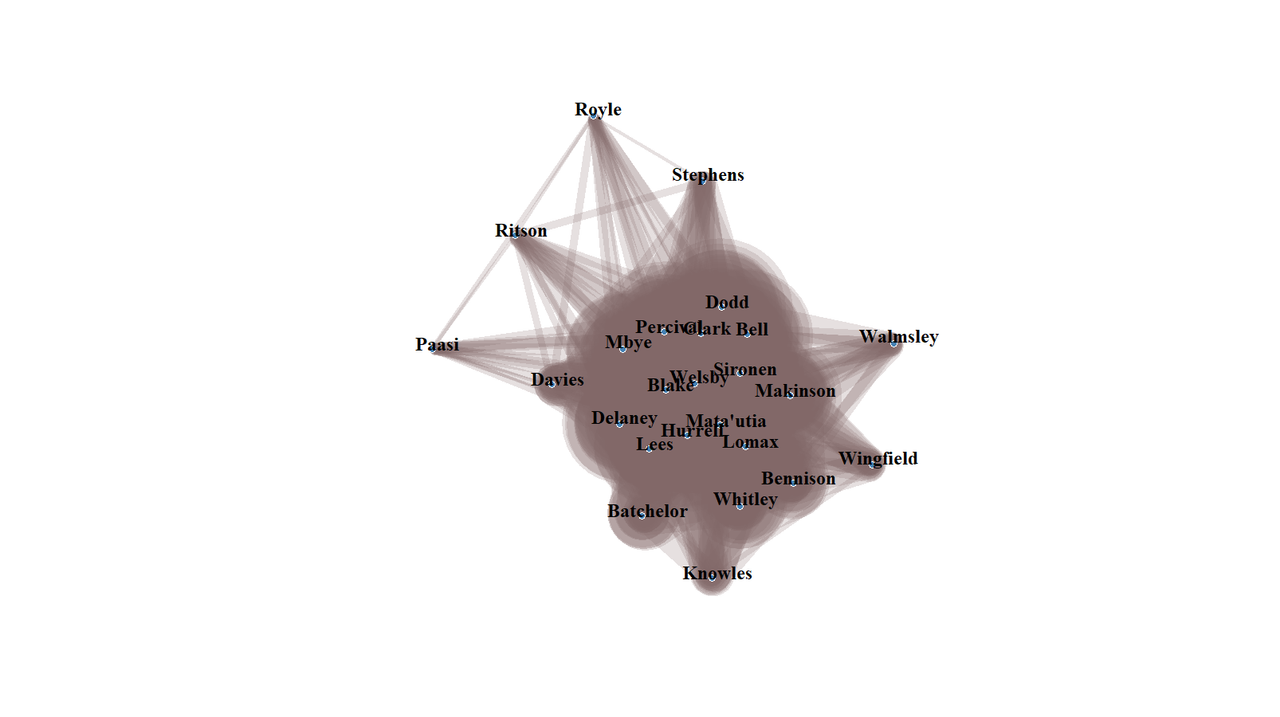
The network graph equivalent for point-scoring moments shows the central blob and the Stephens, Royle, Ritson and Paasi subgroup. Network graph.  There is the central blob.  Above it, at top and slightly right, is a subgroup with connections between it, containing Stephens, Royle, Ritson and Paasi.  Sticking out from the blob but with no links between them are Walmsley, Knowles and Wingfield but Knowles and Wingfield in particular are almost engulfed in the blob. 

The together-when-Saints-concede network graph looks more like the expected starfish, although there's signs of that subgroup in this one too. In this network graph, as well as the central blob there is sort of a Stephens, Royle, Ritson, Paasi, Vaughan and Stephens subgroup, this time top and turning round the corner to the right.  However, in this graph, the subgroup has more connections to the central blob.  At the bottom of the blob Wingfield and Walmsley stick out, at the right and left respectively. 

I think it's interesting that even with 21 games worth of data, the shapes and patterns are still changing.

No comments:

Post a Comment