Showing posts with label r stats. Show all posts

Friday, 11 April 2025

Saints Ahoy - Game 23 and the 2024 season to date

Saints's game 23 was an unnecessarily close match that Moses Mbye won for Saints with a drop goal in golden point extra time (https://www.saintsrlfc.com/2024/08/08/saints-down-the-red-devils-in-golden-point/). 

The matrix of players playing together when Saints concede for the game isn't particularly informative, other than showing the people interchanging in and out, but it does look pretty.

  Matrix chart showing which players play together when Saints conceded in game 23.  The dark red chunk, together most often, contains Whitley, Sironen, Robertson, Ritson, Percival, Mbye, Makinson, Lees and Dodd.  Above and to the left is an orange stripe for Bell, then an amber yellow stripe for Walmsley, orange again for Clark then a paler amber stripe for Burns, followed by a pale yellow stripe for Knowles. 

Over the season, there are now 178 point scoring moments for Saints, compared to 104 point-scoring moments conceded. The chart of when Saints score continues to look like a skyline full of skyscrapers.
  Bar chart of when Saints score.  There is no pattern and because they are grey bars pointing up, it looks like a skyscrapper.  The highest point (more or less in the centre of the chart) is 6 point-scoring moments in minute 50. 

Percival still has the most point-scoring moment, because he is the kicker. He is now up to 60 point-scoring moments. Bar chart showing point-scoring moments for Saints.  22 separate players have had at least 1 point-scoring moment for Saints.  Percival is in the lead with 60.  Next highest is Makinson (who is the spare kicker) and Lomax (who is the other spare kicker). 

Waqa Blake is the Saints player present for the most point-scoring moments. Bar chart showing who is present when Saints score.  Waqa Blake is present for the most, followed by Welsby and Dodd.  The bottom three are Royle, Burns and Vaughan. 

The matrix diagram of which players are together when Saints score is a lot more diffuse than it used to be.
  Matrix diagram of which players play together when Saints score.  While there is still a clearly darker area (the players who play together most frequently when Saints score) in the bottom right hand side of the diagram, it is now speckled with lighter colours and not one solid colour.  That section of 11 players is not much darker than the next most often together section of 6 players.  The diagram becomes paler for the next 7 players then there is the palest section of the last 4 players. 

The network diagram still has a clear central blob. Network graph of players who play together when Saints score.  There is a central blob.  Wingfield sticks out at the bottom right of the blob and Walmsley bottom centre(ish).  Sticking out at the top, from left to right, are Burns, Robertson, Ritson, Davies (whose mostly in the centre blob), Stephens, Paasi and Royle. 

This Salford team had the third most point-scoring moments against Saints. Bar chart showing point-scoring moments against Saints, Leigh in their second game against Saints still have the most. 

There is no pattern to when Saints concede Bar chart showing when Saints concede.  The most point-scoring moments in any minute is 5, which has occurred in the 11th, 32nd, 76th and 80th minute.

Waqa Blake is present for the most point-concessions. Bar chart showing who is present when Saints concede.  Blake is present for the most, followed by Welsby and Lomax.  Royle, Wingfield and Burns are present for the least. 

The matrix chart of players present together when Saints concede has two areas of darker red standing representing combinations often together when Saints concede. The first patch, Blake, Welsby, Clark, Sironen, Dodd, Lomax, Bell, Hurrell, Makinson, Percival, Mbye, Lees, Whitley and Delaney. The second is where those players cross over with Mata'utia. I believe this is because, before his injury, Mata'utia was in the main cluster.
  Matrix diagram showing players who play together when Saints concede.  The darkest group takes up the bottom right hand of the square (and contains Blake, Welsby, Clark, Sironen, Dodd, Lomax, Bell, Hurrell, Makinson, Percival, Mbye, Lees, Whitley and Delaney).  The next paler section contains Walmsley, Wingfield, Burns, Royle, Paasi, Stephens, Vaughan, Robertson, Davies and Ritson, then the top, slightly darker patch, are Matautia, Bennison and Batchelor. 

The network graph for point-concessions is less blobby than the point-scoring one.

Network graph of who is present together when Saints concede.  The central blob is less blobby for this one that the network graph of who is together when Saints score.  4 players stick out at the top right (Robertson, Paasi, Vaughan and Stephens), Royle sticks out on his own at the bottom right, Batchelor sticks out at bottom middle, Walmsley bottom left, and Wingfield top left.

Saturday, 15 March 2025

Saints Ahoy - Game 22 and the 2024 season to date

Subtle change in name to reflect that the 2025 Rugby League Super League season has started. 

Game 22 was against Hull FC. This time Hull actually managed to score against Saints: Bar chart showing which teams have scored against Saints.  Hull FC only feature once because they were nilled in the first game versus Saints.  Hull KR, on the other hand, have scored the second most points against Saints in 2024 to this point. 

I wish Saints had kept a clean sheet, but (shrug). 

The good news for Saints is that Morgan Knowles was back from injury in this game, and Jake Burns, got his first ever try for the senior team, then the second in the same game. (A bit of background - https://www.saintsrlfc.com/teams/first-team/jake-burns/ He might be one of the last of the proper, has a non-Saints career to fall back on, players). The most heart-warming part, exactly how happy the Saints Twitter guy was. 

The game 22 "who is present together when Saints score" matrix diagram, I'm including it because I think it looks pretty, and it's nicely shows how forwards interchange (paler colours), while the backs stay on (darker colours). Matrix graph of which Saints players are together when Saints score in game 22.  The dark purple patch, of Whitley, Robertson, Ritson, Mbye, Makinson, Dodd, Blake and Davies, who are mostly backs, were together a lot.  The forwards, Paasi, Lees, Clark, Bell, Sironen, Knowles, Batchelor, Burns and Stephens, are paler because they are substituted on and off. 

For the season to date, Saints have had 172 point-scoring moments and 98 conceded. 

22 players have scored for Saints. Bar chart.  Makinson is far in the lead, with almost 60 point-scoring moments, followed by Percival and Lomax, who both score tries and are the stand-in kickers if Makinson is off the pitch. 

The "Saints often score in minutes 50-53" has been reinforced. Bar chart of when Saints score.  The minute with the most point-scoring moments is minute 50 with 6.  However, there are also 4 point scoring moments in minute 51, 5 in minute 52 and 3 in minute 53.  There is no other cluster with so many point scoring moments. 
Who is present when Saints score? Bar chart showing who is present when Saints score.  Welsby is still near the top despite being away with an injury, but Blake has been present for most.  After Blake and Welsby, there is a large drop off to Dodd and Hurrell who have been present for the next most. 

The present-together-when-Saints-score matrix has an interesting pattern. Whitley's line makes that pattern. This is because he was present for a lot of point-scoring moments early in the season, then was out for a while, and has now been present for several more tries now he's back. So he's been separated from the main "often present when Saints score" group, but has still been present a lot with them. Matrix of players often together when Saints score, up to game 22.  The bottom right corner contains the players most often together when Saints score (Welsby, Blake, Dodd, Hurrell, Percival, Sironen, Bell, Clark, Lomax, Mbye, Makinson, Matautia, Delaney, Lees).  Then there is a paler chunk, the darker Whitley line, explained above, and then the palest, least often group who are top-most and lefter-most. 

The equivalent network graph looks like this. Network graph - there is a central blob.  Wingfield and Walmsley stick out at the top.  Sticking out middle left is Royle.  Sticking out at the bottom is Paasi and bottom right is Burns.  There are links between Royle and Paasi.  Also sticking out from the main blob at the bottom, but not as much, are Davies, Ritson, Robertson and Stephens.  There are lots of links from them to Royle, Paasi and Burns, and many between them. When do Saints concede? Bar chart.  There are 4 minutes with 5 point-conceding moments, minutes 11, 32, 76 and 80. 

The pattern of Saints conceding minute 9-12 has gone. It is starting to look like Saints concede a lot in the last 10 minutes, which I'm not sure is reflective of tiredness (justifiable) or more time needed on conditioning (not acceptable). 

Who is present when Saints concede? Bar chart showing who is present when Saints concede.  Blake is present for the most, then there is a sharp drop to Welsby and Lomax, who are present for the next most, then Clark, present for 76 of the point-conceding moments. 

The matrix diagram of players together when Saints concede also looks interesting. It basically looks like a tartan with a repeating pattern, but each repeat is slightly paler. Matrix diagram of players together often when Saints concede.  The first, darkest, repeat, is bottom right, and contains, Clark, Dodd, Bell, Sironen, Hurrell, Delaney, Percival, Makinson, Lees and Mbye.  The next cluster up and out are Blake, Lomax, Welsby, Whitley, Matautia, Bennison, Batchelor, Knowles.  The palest repeat is both top and leftermost and contains Ritson, Davies, Robertson, Paasi, Stephens and Vaughan.  There is another section, all pale yellow, above and to the left of them, it contains Walmsley, Burns, Wingfield and Royle. 

The concession network graph just looks odd. Network graph - while these is a central blob, this is more diffuse than the scoring network graph. Wingfield sticks out to the top and right, and links only to the central blob.  Stephens, Robertson, Paasi and Vaughan stick out bottom right, and have links between each other and the central blob.  Royle sticks out bottom left, and only has links to the central blob.  Walmsley sticks out at the top and only has links to the central blob.

Friday, 28 February 2025

Saints ahoy! - Game 21 and season to date

This is one of the games where I know there are errors in the data. At various points Stephens swapped on for players who weren't on the pitch and I'm not sure when Mbye came on. I do not blame the overworked Saints social media fella, but it'd be nice if Super League tried to give me this information.

(I am not entirely joking when I threaten to do this for St. George Illawarra this season because the NRL has proper stats. Lack of time will be the only thing that stops me.) 

Game 21 itself was also a disappointment, because Saints lost 46-4 to Leigh. So not only did they beat us twice, they beat us twice in leopard print undercrackers (https://www.saintsrlfc.com/2024/07/26/saints-well-beaten-by-leigh/). The two yellow cards for Saints didn't help. 

It turns out the reason the social media team didn't say when Mbye came on was because they were in denial about Welsby going off. Which I really don't blame them for. 

Some quick reworking later, there are better figures. 

This Leigh team are now the team who have scored the most against Saints in 2024. Bar chart of point-scoring moments against Saints.  Leigh in game 21 have the most with 15. 

There continues to be a pattern of Saints scoring in minute 50-53. Bar chart showing when Saints score.  The two minutes with five point-scoring moments in are minute 50 and 52.  Minute 51 and 53 have 3 point-scoring moments each 
There are 4 minutes where Saints have conceded 4 point-scoring moments, with some evidence that they concede often in the last 10 minutes. Bar chart of when Saints concede.  Minutes 11, 32, 76 and 80 have 4 point-conceding moments.  There is a general shape that suggests Saints concede often in the last 10 minutes. 
Because of injury in this match, Welsby is no longer ever present when Saints score. He is still the player most often present when Saints score, but that's because they only scored once in game 21. Bar chart of who is present when Saints score.  Welsby is still present for the most, 156, followed by Blake and Hurrell.  Paasi, Vaughan and Robertson are present for the least, but Vaughan and Robertson are new this season. 
Because of the injury, Welsby is no longer the player present most often when Saints concede. Bar chart of who is present when Saints concede.  Blake is now present for the most, followed by Welsby and Lomax.  Royle, Wingfield and Burns are present for the least. 

The "who is present together when Saints score" is now four quadrants, with a intermediate group between them. The intermediate group are Whitley, Batchelor and Bennison. Whitley is just back from injury, which might explain it. 

The line that interests me is Ritson's, because where it crosses Lomax, Percival, Blake, and Welsby's, it is darker than expected. Not by much, but enough to be seen. Matrix graph as described above.  The darkest, most often together, section is bottom left, with pale areas covering the top and leftermost parts. 

The who-is-present-together-when-Saints-concede matrix is fascinating. Matrix diagram of who is present together when Saints concede.  The reason it is fascinating is that the paler areas have parts that look like fractals or crenelations.  I cannot explain them statistically. 

My best guess for why is something about Welsby's injury, combined with the many point-conceding moments in this game. 

The network graph equivalent for point-scoring moments shows the central blob and the Stephens, Royle, Ritson and Paasi subgroup. Network graph.  There is the central blob.  Above it, at top and slightly right, is a subgroup with connections between it, containing Stephens, Royle, Ritson and Paasi.  Sticking out from the blob but with no links between them are Walmsley, Knowles and Wingfield but Knowles and Wingfield in particular are almost engulfed in the blob. 

The together-when-Saints-concede network graph looks more like the expected starfish, although there's signs of that subgroup in this one too. In this network graph, as well as the central blob there is sort of a Stephens, Royle, Ritson, Paasi, Vaughan and Stephens subgroup, this time top and turning round the corner to the right.  However, in this graph, the subgroup has more connections to the central blob.  At the bottom of the blob Wingfield and Walmsley stick out, at the right and left respectively. 

I think it's interesting that even with 21 games worth of data, the shapes and patterns are still changing.

Monday, 10 February 2025

Saints Ahoy! - Game 20 and the season to date

Every league has a team like Warrington. Their purpose is to look like they could win the league, if everything lines up for them, and then things suddenly just don't line up for them. And the just don't continues for a long period of time. 

In Warrington's case, the "and then something went wrong" has lasted since 1955 (they have won the Cup since then, but never the league). Even their own fans sing a song about it. "It's always our year, it's always our year, same as the next one, it's always our year." and so on. 

In 2024, everything was starting to look like they might win. Sam Burgess as coach seemed to be the magic ingredient. It didn't, of course, end with them winning the league but 2025 could be their year. 

I try not to torment them too much, because they aren't a bad team, usually, and because I really like Stefan Ratchford as a player (https://en.wikipedia.org/wiki/Stefan_Ratchford). Yes, I know, thou shalt not covet thy neighbour's stand-off, but I have wanted him on my team since before his nose was a non-Euclidean nightmare. 

Anyway, following Saints's loss to them in the quarter-final of the Challenge Cup (https://fulltimesportsfan.wordpress.com/2024/08/13/saints-ahoy-visualisations-from-game-9-challenge-cup-quarterfinal/), game 20 was Saints and Warrington's first meeting in the league. 

And Saints lost. 

Lost to a team who had a man red carded in the 20th minute. And another one yellow carded later. 

It wasn't going to be Saints's season, was it. 

As in the last game (https://fulltimesportsfan.wordpress.com/2025/01/26/saints-ahoy-game-19-and-the-season-to-date/), 4 out of the match day 17 were people who'd made their debuts this season. The season to date visualisations also started to see the effects of Hurrell's injury, as he dropped down the "present for" charts, and this mid-season bundle of Ritson, Royle, Stephens and Paasi really started to form up.

But I get ahead of myself... 

The point-scoring and point-conceding matrix diagrams look pleasingly similar with some small differences. 

Saints players who played together when Saints scored in game 20: Matrix chart of Saints players who played together when Saints scored in game 20.  The darkest chunk is Welsby, Vaughan, Sironen, Ritson, Percival, Lomax, Lees, Clark, Bell and Blake.  Then there is the orange chunk of next most often together, who are Robertson, Mbye and Paasi.  The palest, least-commonly together group are Stephens, Dodd and Royle, but the really interesting thing is the pale zone that shows Robertson, Mbye and Paasi did not play with Stephens, Dodd and Royle. 

The really interesting thing is the pale zone that shows Robertson, Mbye and Paasi didn't play with Stephens, Dodd and Royle. 

Now, from Saints's as it happened report (https://www.saintsrlfc.com/matches/2024/first-team/saints-v-warrington-wolves-2024-07-19/), I know Paasi and Stephens were swapping on and off for each other but I hadn't realised it for the others. 

Saints players who played together when Saints conceded in game 20: Matrix chart of Saints players who played together when Saints conceded in game 20.  The first chunk is the second darkest, a sort of dark ruby red.  It contains Paasi and Percival.  The darkest chunk is Welsby, Vaughan, Sironen, Ritson, Lomax, Lees, Clark, Bell and Blake, suggesting the there was at least one point-conceding moment that Percival was off for.  Then there is the orange chunk, paler than in the scoring version, who are Dodd, Royle, Mbye and Robertson.  Interestingly, Dodd and Royle and Paasi and Percival were together less often than expected.  The palest, least-commonly together group are Stephens and Bennison, but again, they play less often together with Paasi and Percival. 

So it's quite clear that Stephens and Paasi are the people swapping on and off for each other. 

How does that affect the season-long charts? 

20 players have now scored for Saints. Bar chart showing who has scored for Saints, Percival is still way out ahead. 
When do Saints score? Bar chart showing when Saints score.  The two peaks of 5 points over the season in that minute are at minutes 50 and 52, with several 4 point minutes after that. 

It looks like Saints score more in the second half than the first. 

Jack Welsby is still ever present when Saints score. Bar chart of who is present when Saints score.  Welsby is present for all of the points.  He is followed by Blake and Hurrell.  Least often are Robertson and Vaughan, season debutants, and Paasi, who has been injured. Hurrell is dropping down the ranks because of injury. 

The "who is present when Saints score?" matrix now looks really complicated. Matrix graph.  The darkest area is quite clear - it contains Welsby, Blake, Hurrell, Percival, Sironen, Dodd, Clark, Bell, Lomax, Makinson, Mbye, Matautia, Lees and Delaney.  There is variation in the colour with sort of orangier mottling.  The drop off from this darkest area is significant, with the rest of the graph being a pale yellow colour mottled with darker flecks. 

The Davies, Ritson, Stephens, Paasi and Royle subgroup is definitely starting to form. In the network graph, there is a central blob, then Davies, Ritson, Stephens, Paasi and Royle at the bottom, with lines between them and the central blob.  Sticking out at the top are Knowles, Walmsley and Wingfield.  Except one line between Knowles and Walmsley, there are no links between them, just links to the central blob. Warrington hold two of the top 3 places in the "who scored against Saints?" bar chart. Bar chart of the teams that scored the most points against Saints.  The team with the most are Hull KR from the first time they played Saints this season.  The next two are Warrington when they knocked Saints out of the Challenge Cup (game 9) and Warrington in game 20. When do Saints concede? Bar chart showing when Saints concede points.  There are peaks between minutes 9-12, and then a larger plateau between 70 and 80. 

The pattern of Saints conceding in minutes 9-12 or 70 onwards continues. 

Who is present when Saints concede? Bar chart showing who is present when Saints concede.  Welsby is ever-present for this too, followed by Blake and Lomax.  Wingfield, who has been injured, Robertson, Stephens and Burns (season debutants) have been present for the least. Because the last few games have featured Saints conceding, Hurrell's drop is even bigger here. 

The "who is present together when Saints concede?" matrix diagram is still made of three distinct thirds. Matrix diagram showing who plays together when Saints concede.  There is the darkest, most often together third, in the bottom right, then a paler third section (the smallest), then the palest third. 

The network graph of who is together when Saints concede looks very different, more like a starfish with the central blob having lots of extended tentacles. Network graph, the central blob is surrounded by, clockwise from top left, Walmsley, Wingfield, Knowles, Mbye, Ritson and Batchelor.  There is a second extension, all towards the bottom with more links between each other than that first six.  They are working right to left from under Mbye, Davies, Royle, Vaughan, Robertson and Paasi. Secondary sub-teams, playing together because of injuries to others, are definitely starting to appear.

Sunday, 26 January 2025

Saints Ahoy! - Game 19 and the season to date

Saints fans ask for very little. We just want to beat Wigan. Therefore losing to them 16-12 makes us sad.

I mean, I think we did very well given the number of children in our starting line up. Saints-vs-Wigan-120724 
Look at Harry Robertson, literally the poster boy for that line up. (https://www.saintsrlfc.com/teams/first-team/harry-robertson/) He's 19, making his debut and they throw him in against them!!! 

Of that starting 17, there are 4 players who made their debut this season!!! 

And you know what really doesn't help when you have a team that's almost a quarter infants (and a couple of players not much post that stage)? When one of your senior players gets himself yellow carded in the first minute. 

Matty Lees, give yourself a shake! 

It being such a low-scoring game means there's no figures for the game. (Don't worry, I am adding some extra analysis at the end to make up for it.) 

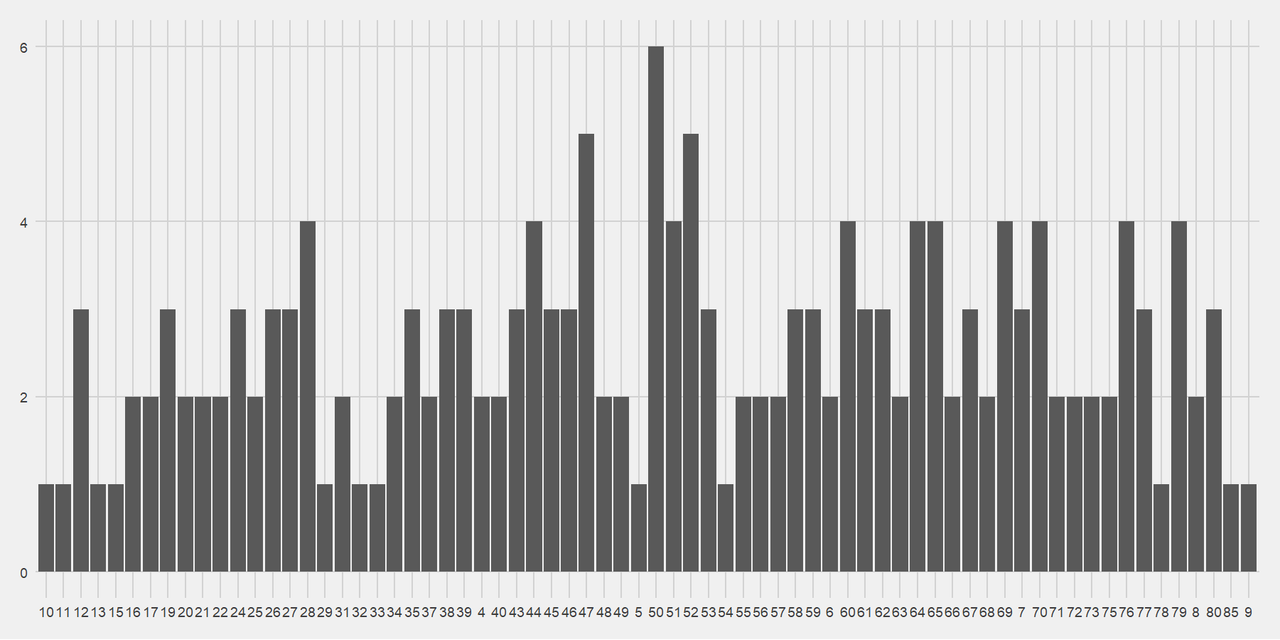
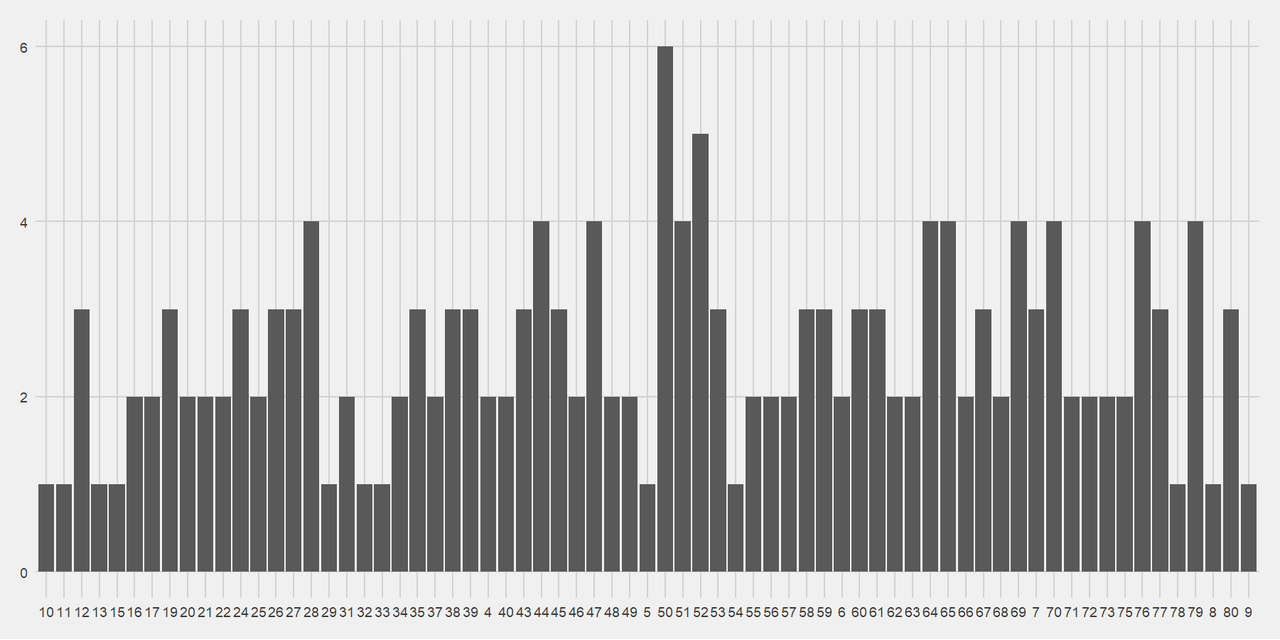
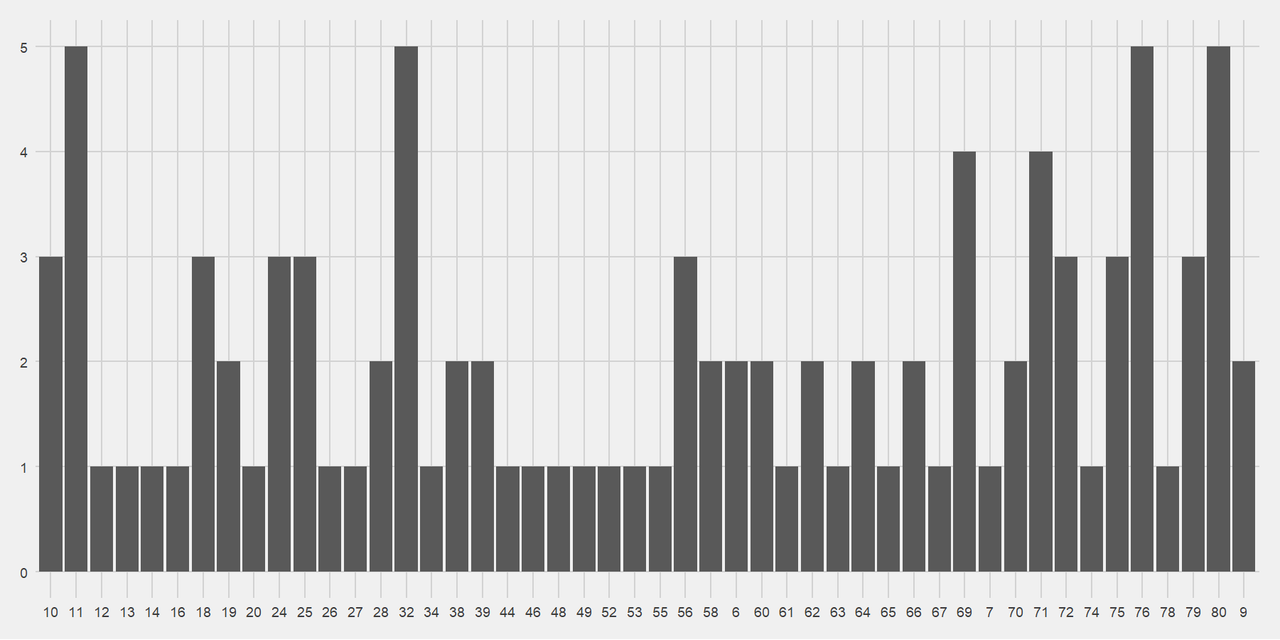
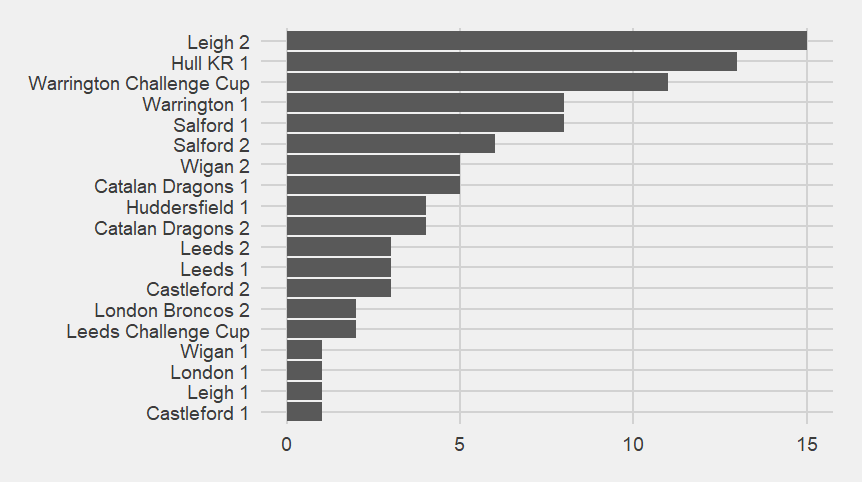
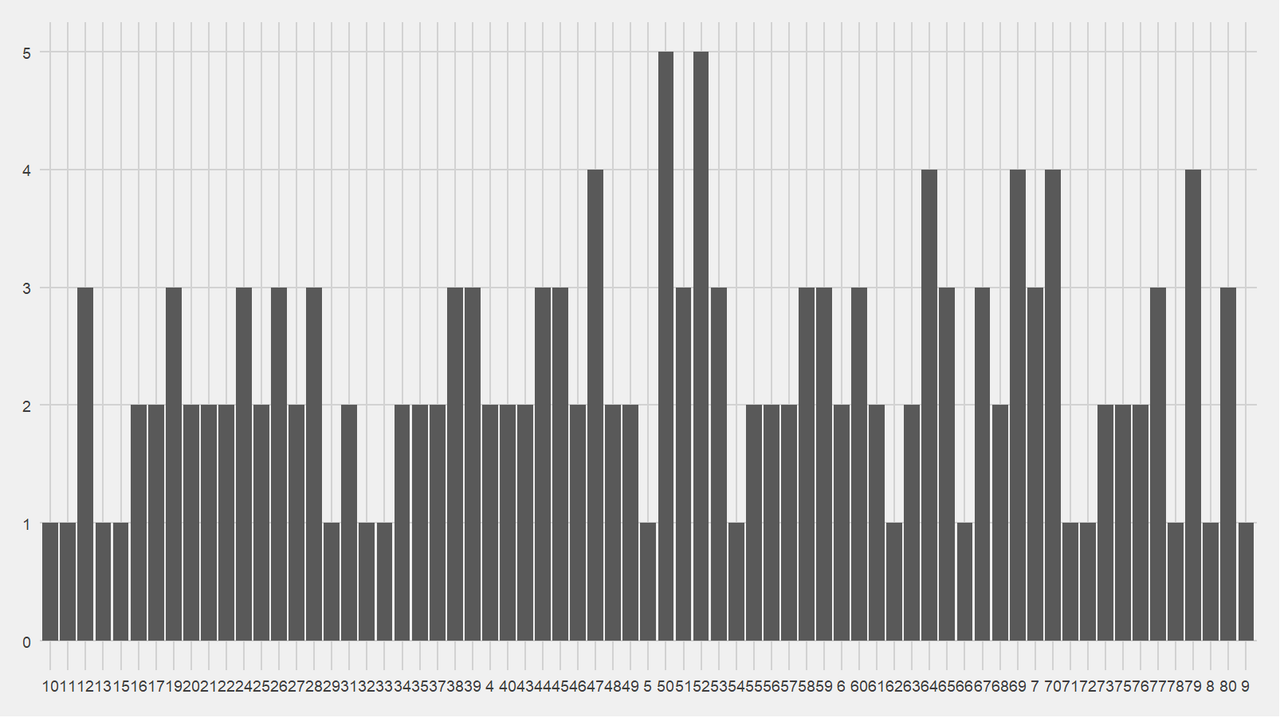
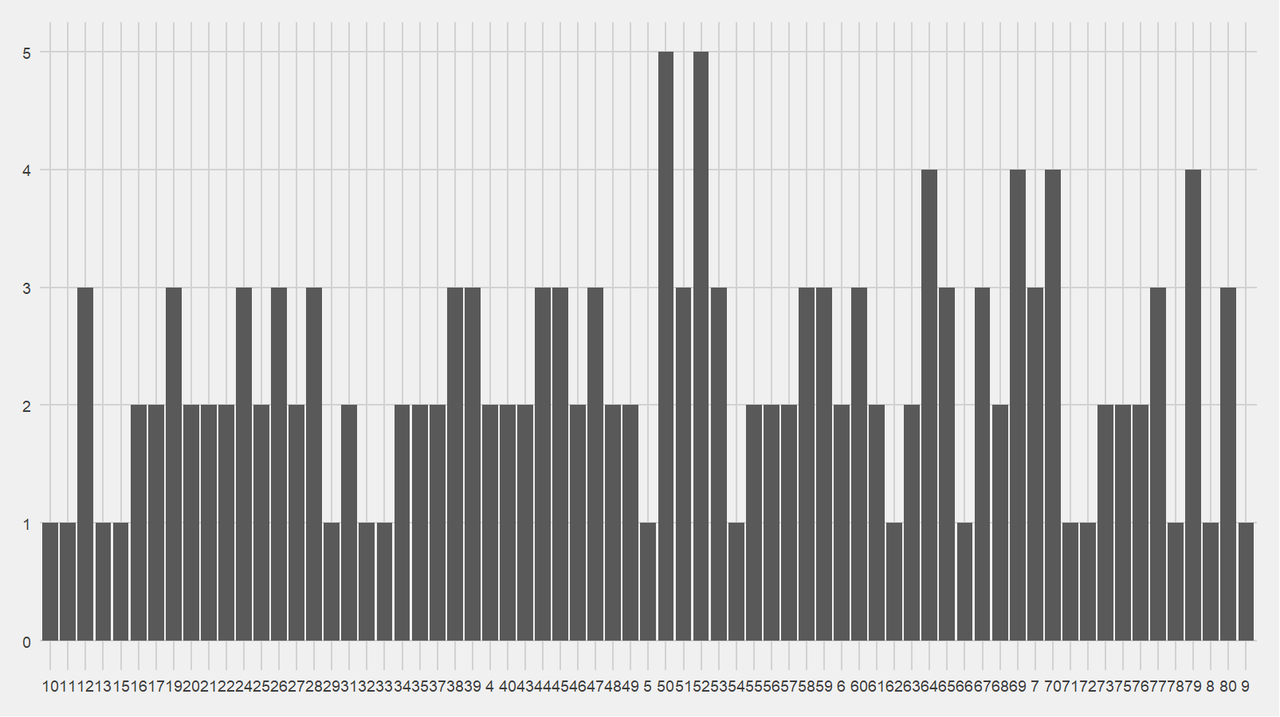
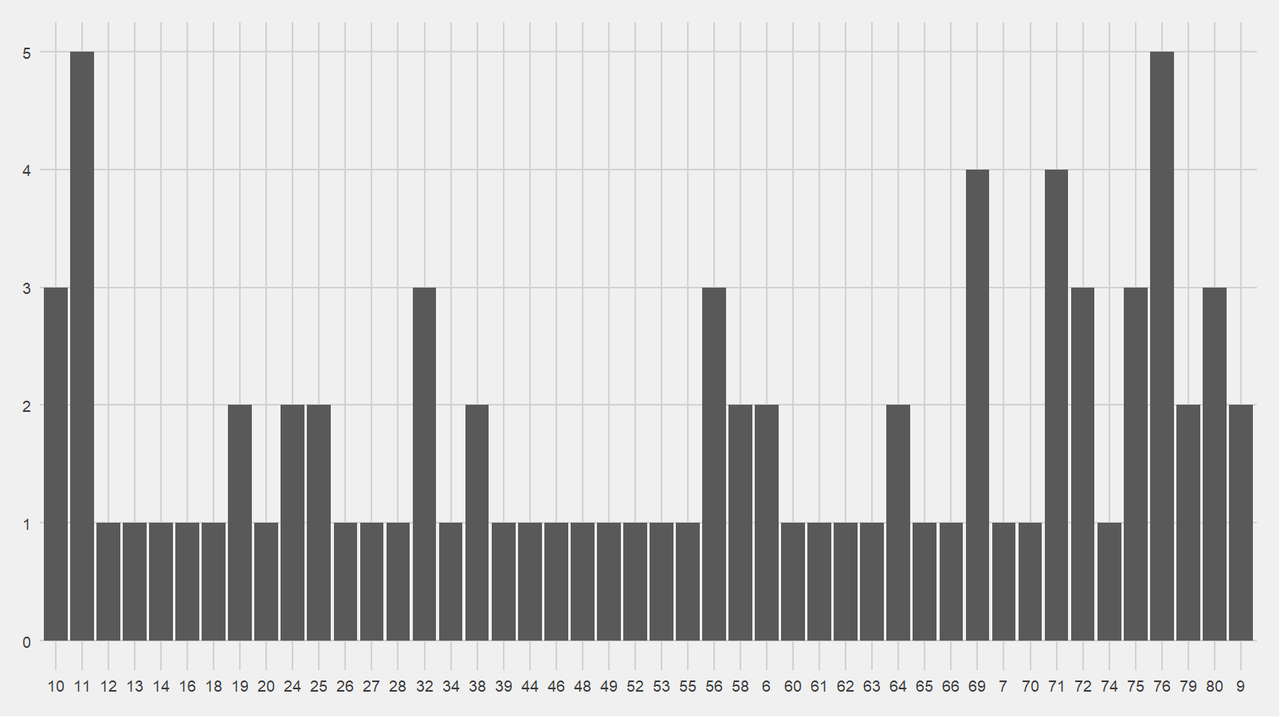
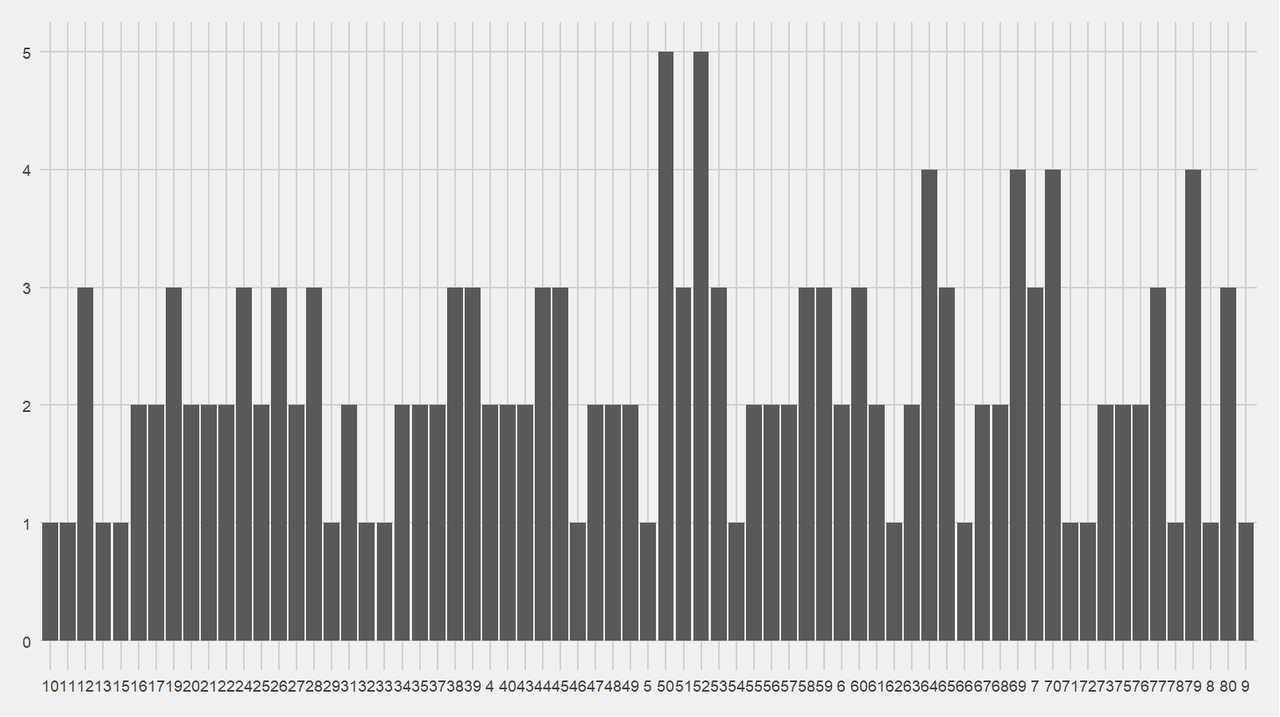
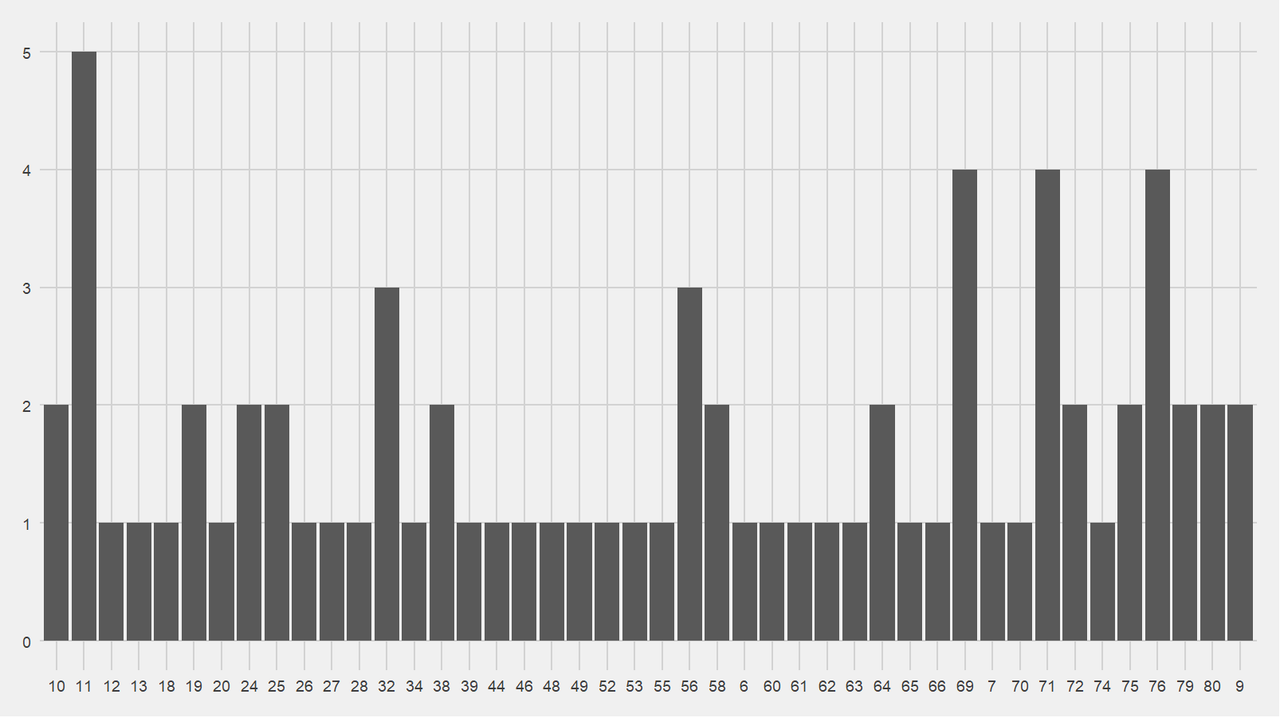
For the season to date, there may be starting to be a pattern of Saints scoring in minute 50-55. Bar chart of when Saints score.  Only minutes 50 and 52 have 5 point-scoring moments, while minutes 51 and 53 have 3 point-scoring moments. 

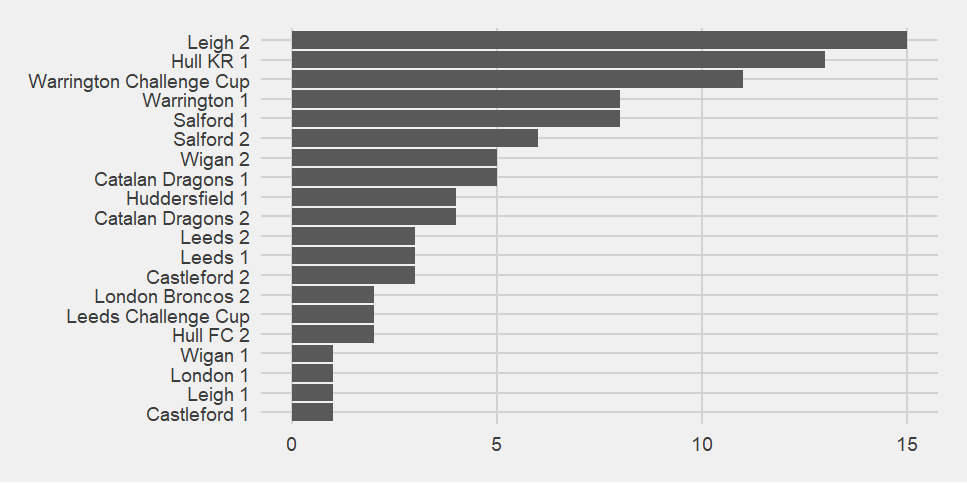
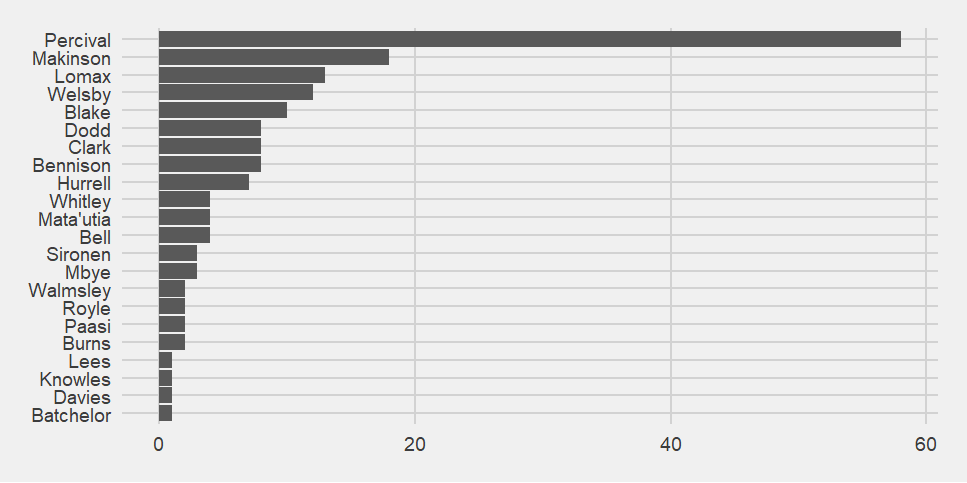
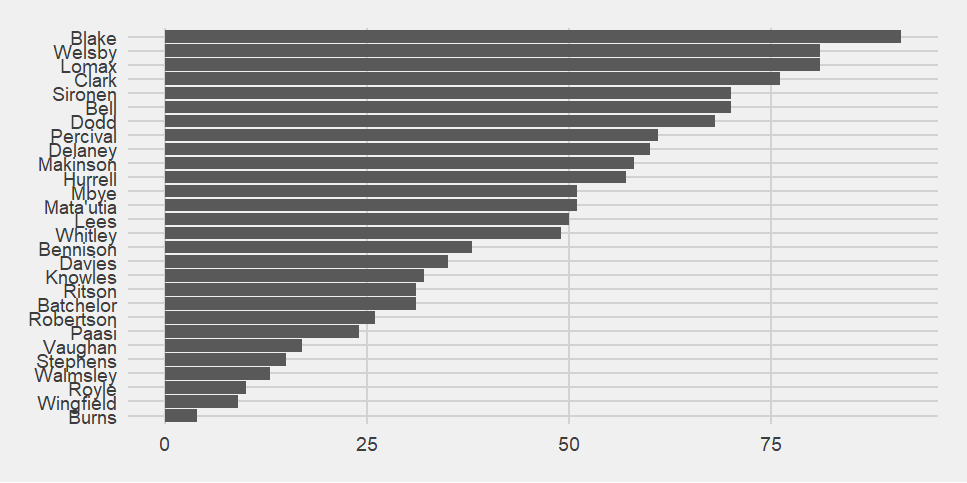
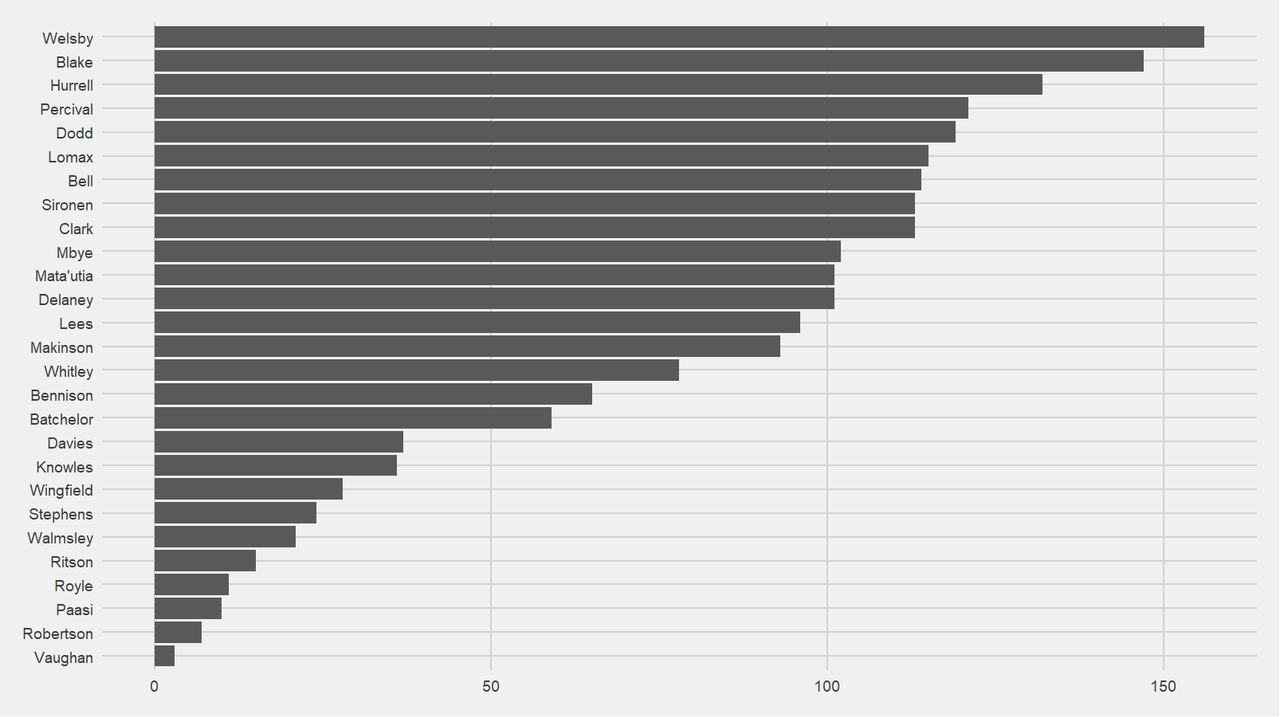
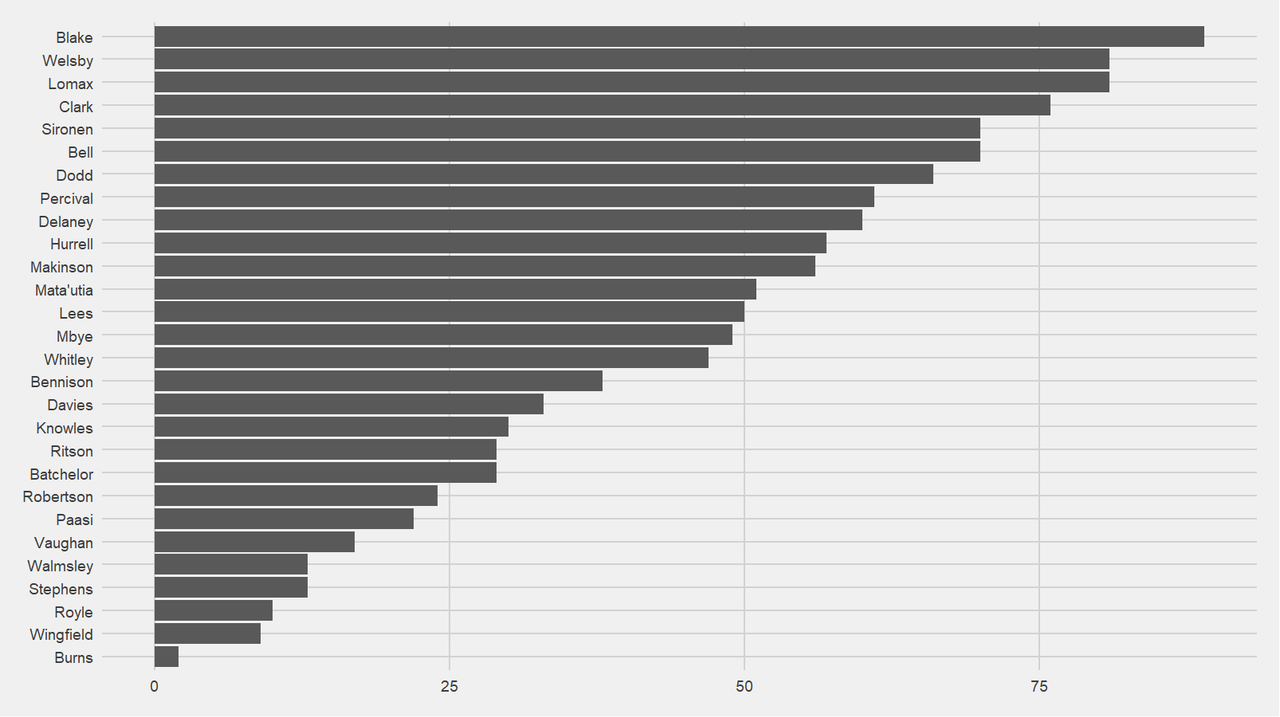
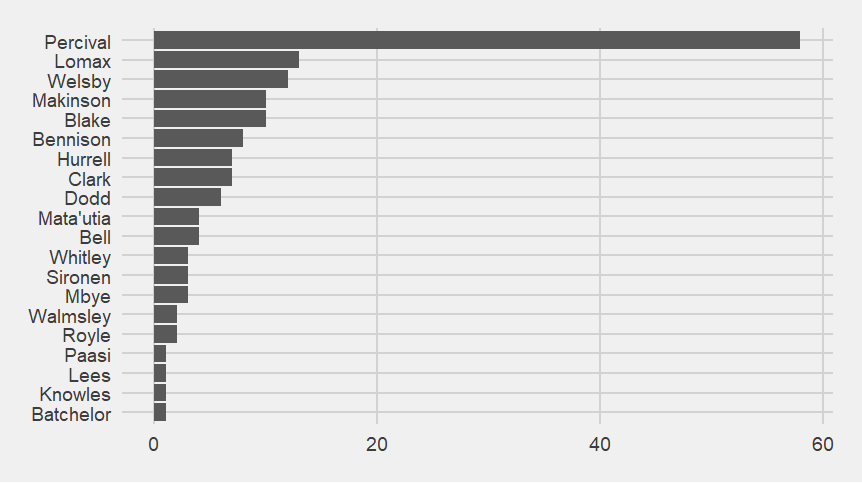
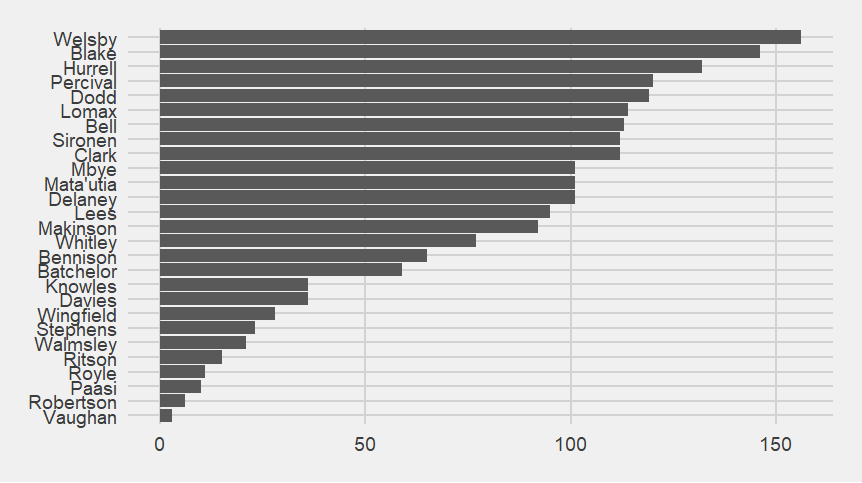
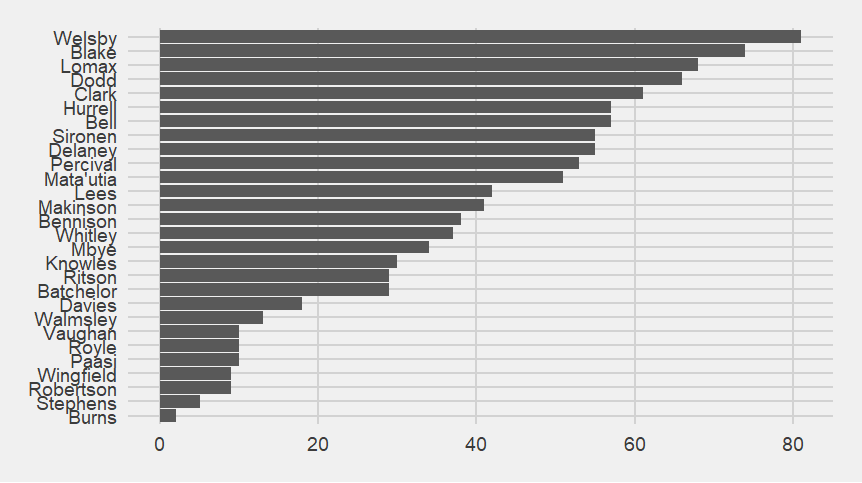
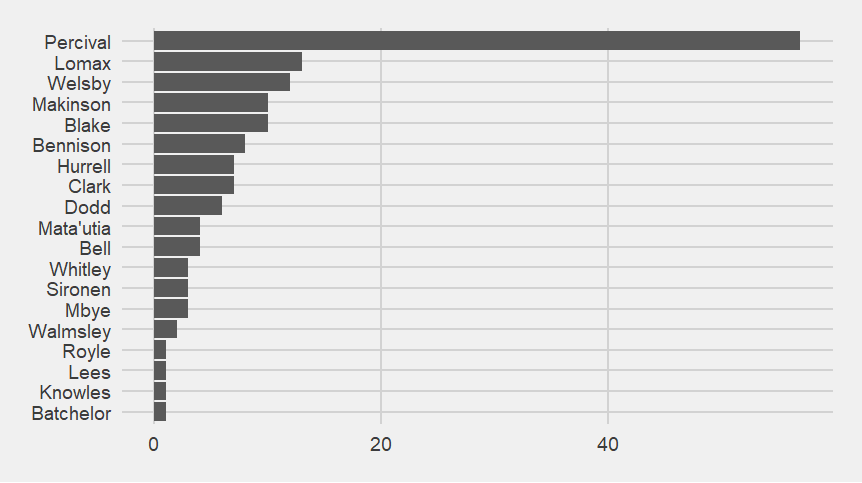
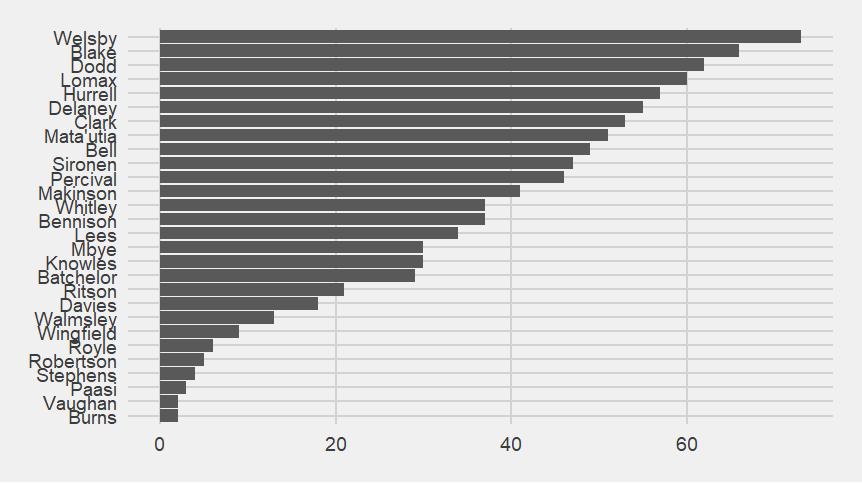
19 players have now scored for Saints at any point this season. 

Percival, the kicker, still leads the way. Bar chart of point-scorers for Saints.  The top line for Percival, the kicker, is the longest as expected.  It is about 4 times longer than the line of the next nearest player, Jonny Lomax. 
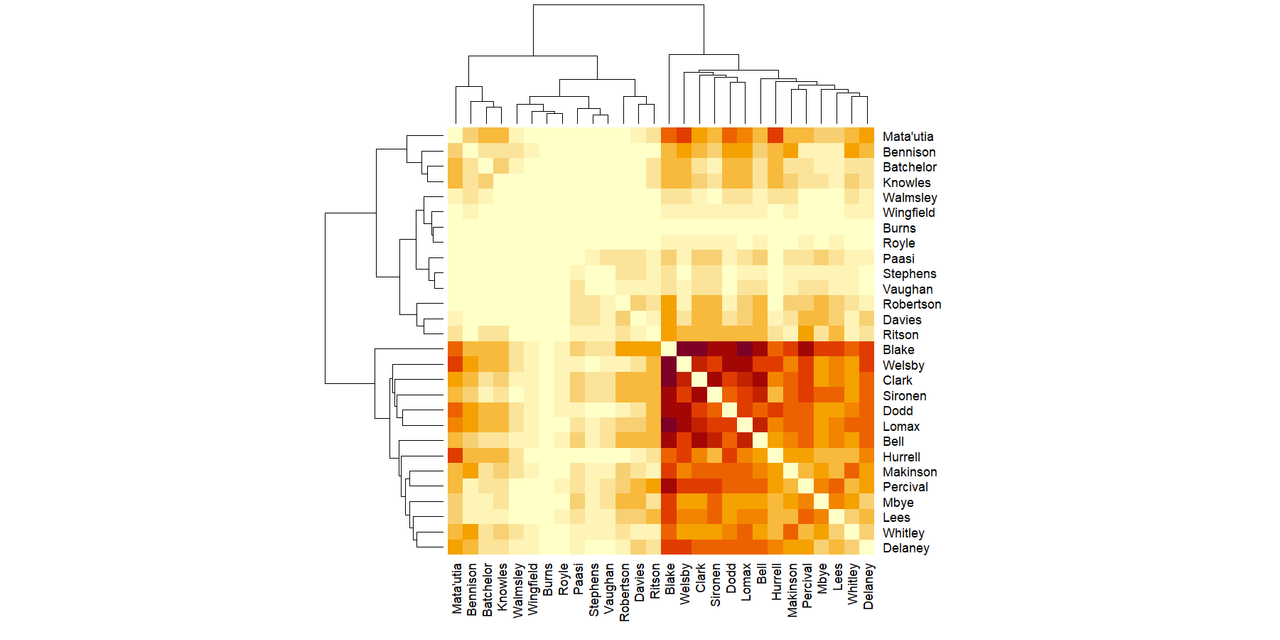
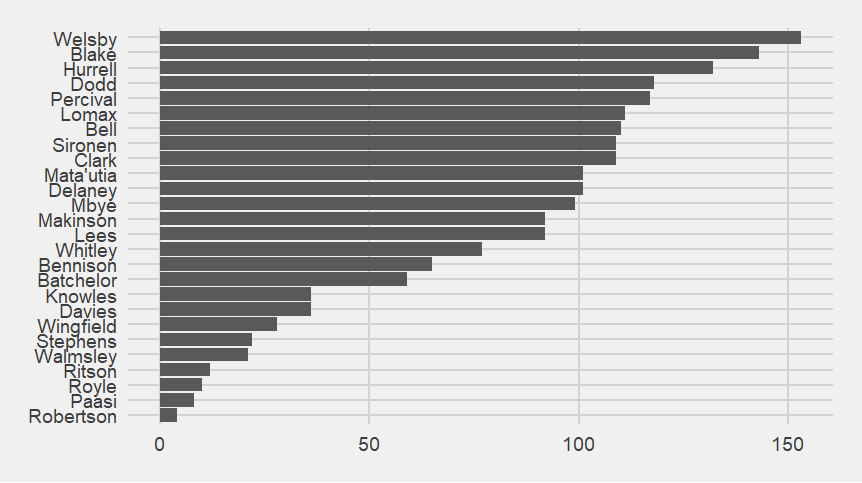
Welsby is still ever-present when Saints score, present for all 153 point-scoring moments. Bar chart of who is present when Saints score.  Welsby is present for all 153.  The next two most present are Blake and Hurrell.  The last 3 are Royle, Paasi and Robertson, who have been injured, injured and only made his debut in game 19, respectively. 
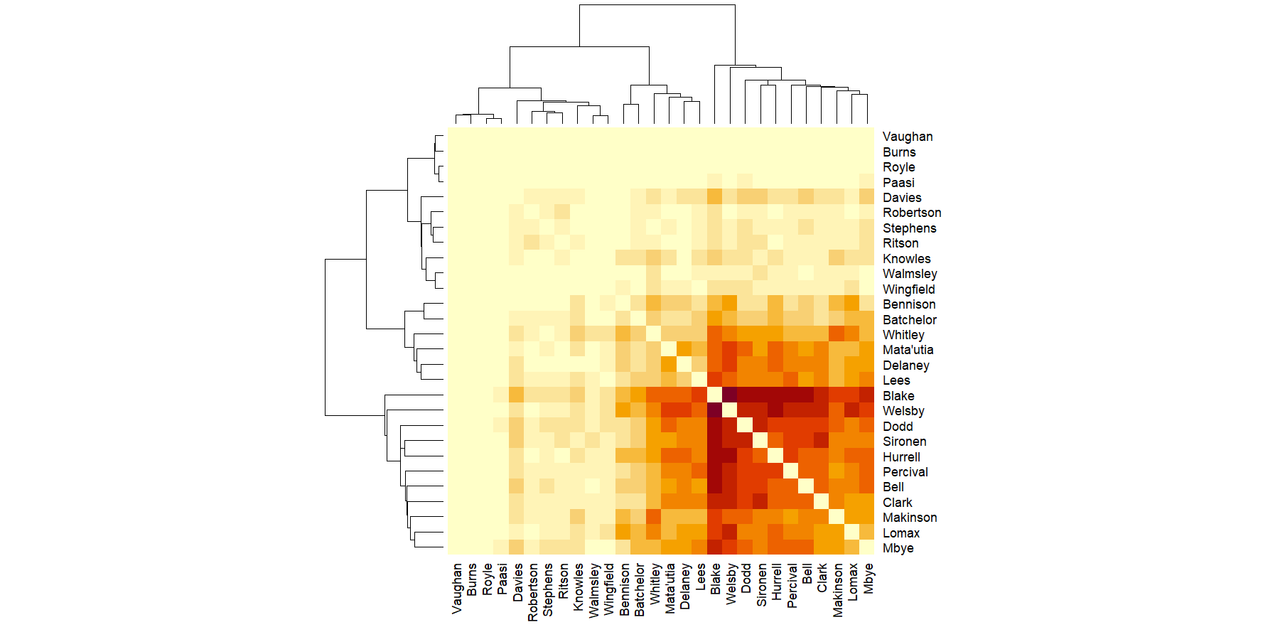
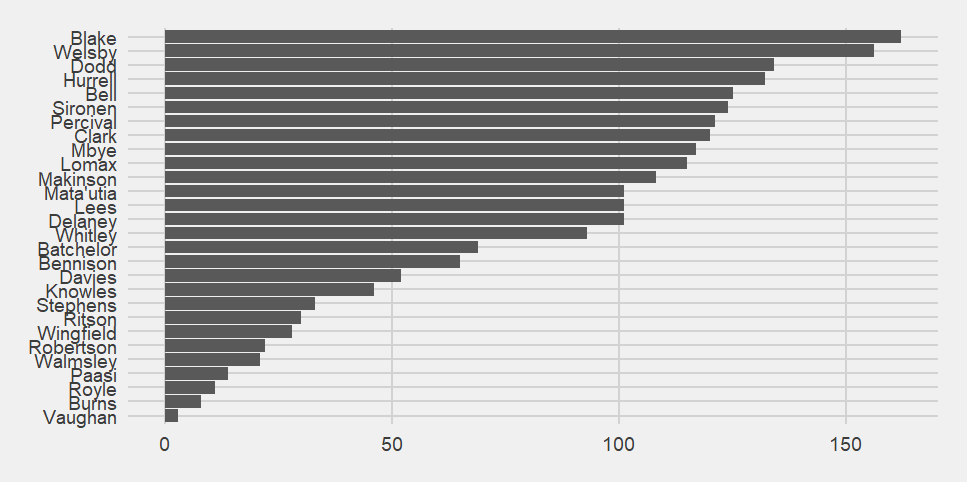
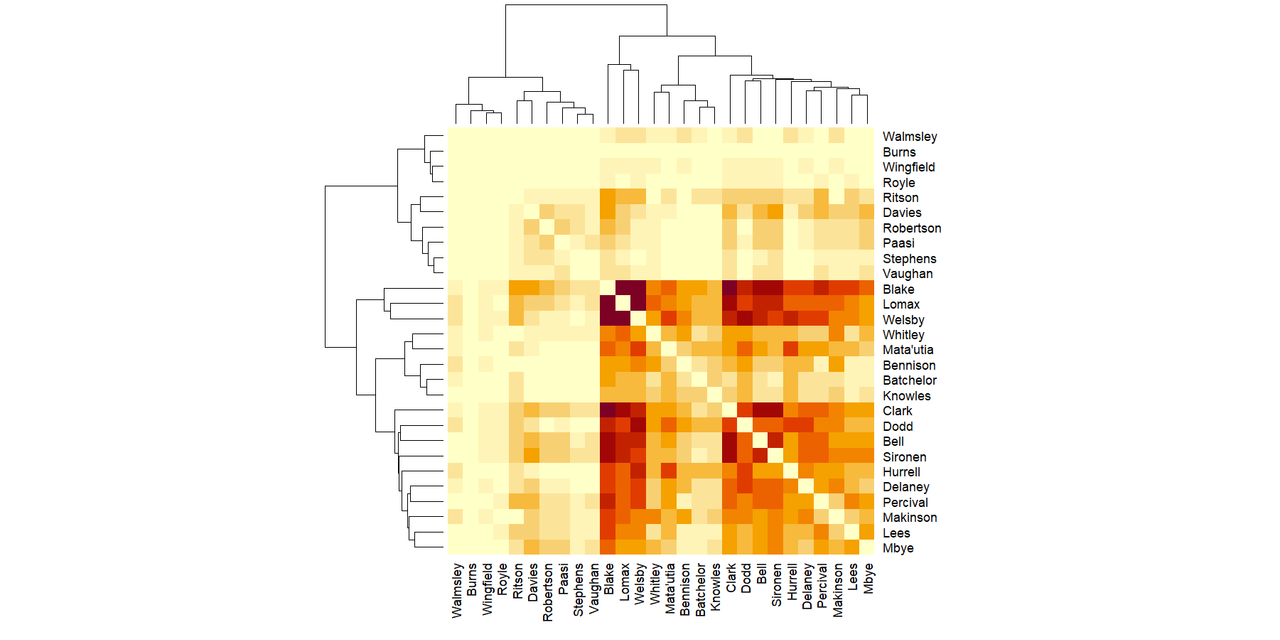
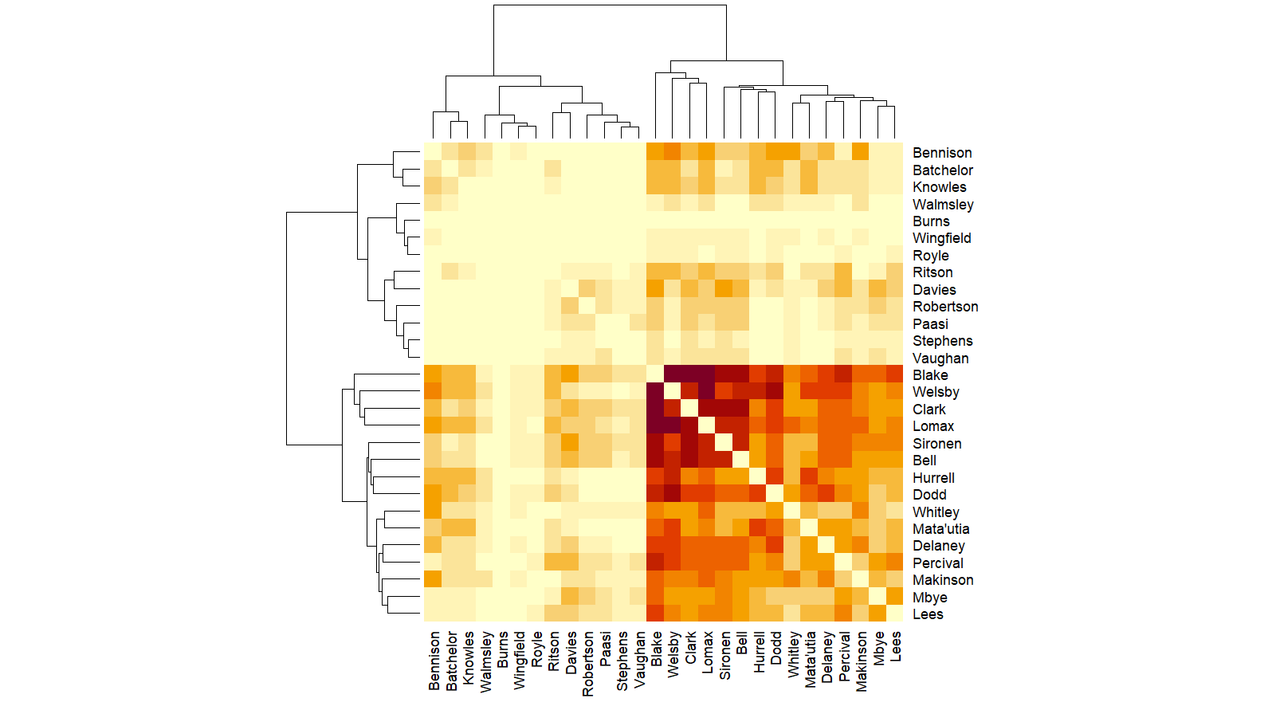
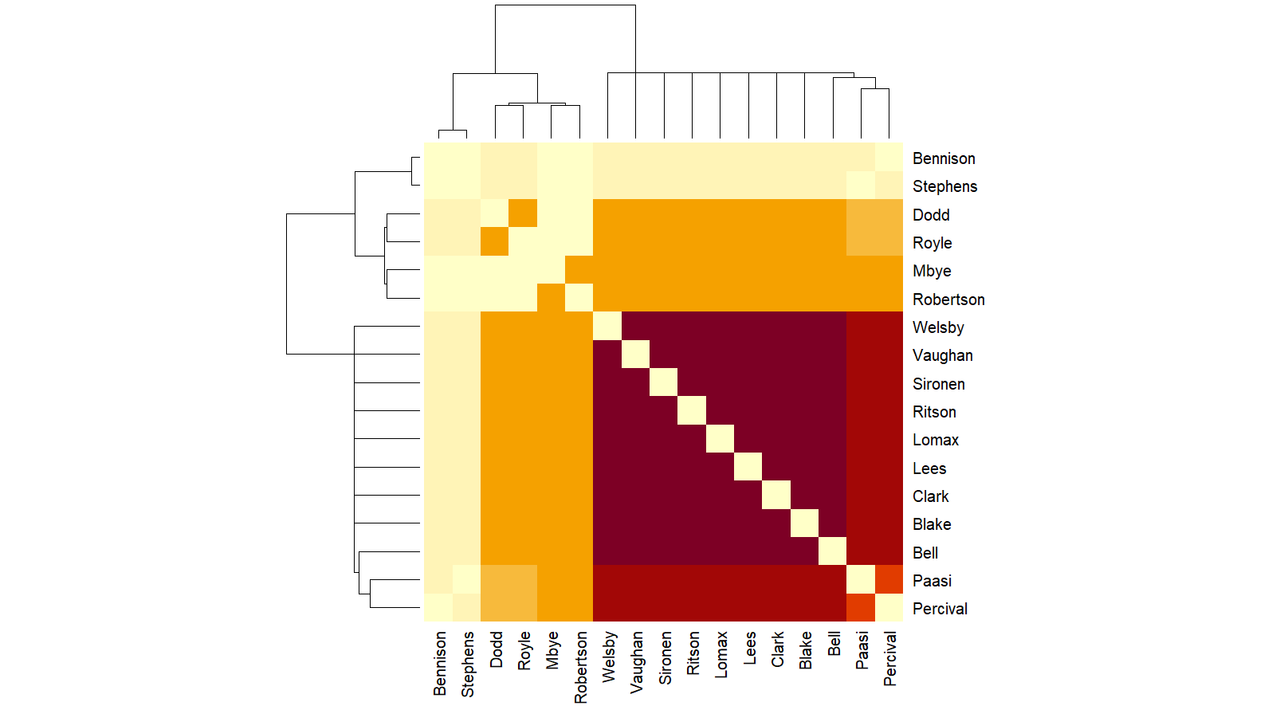
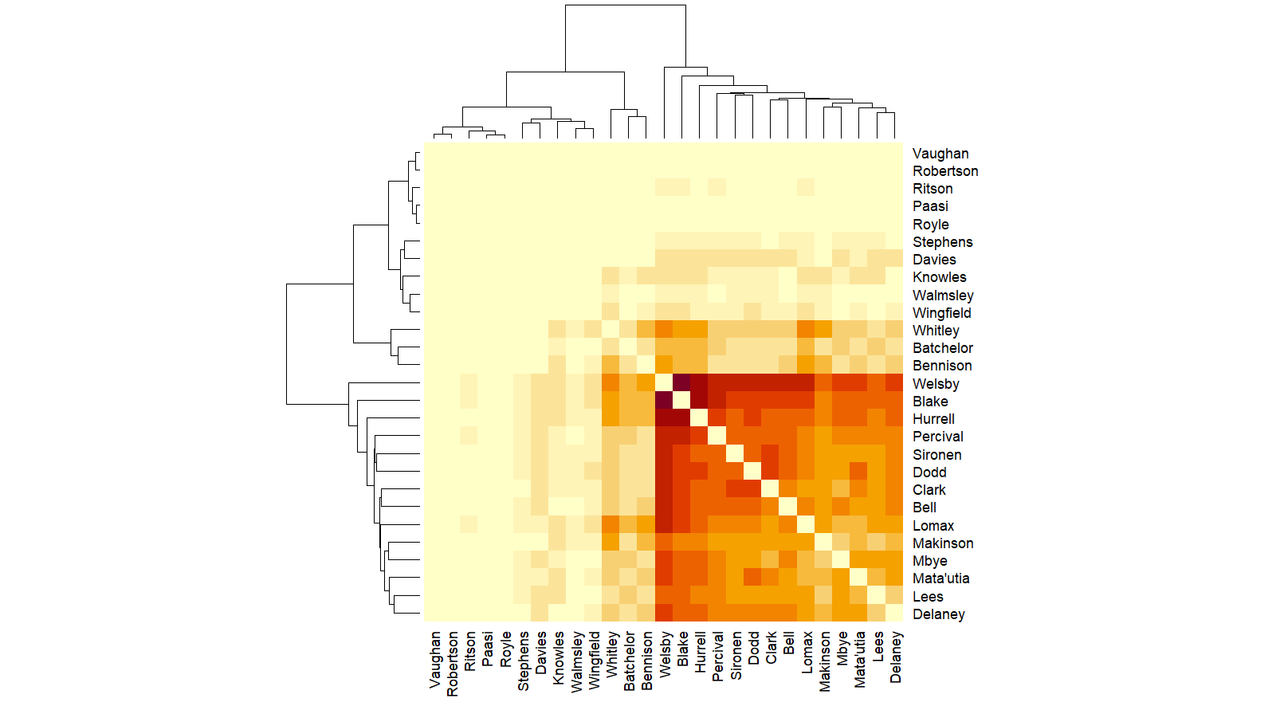
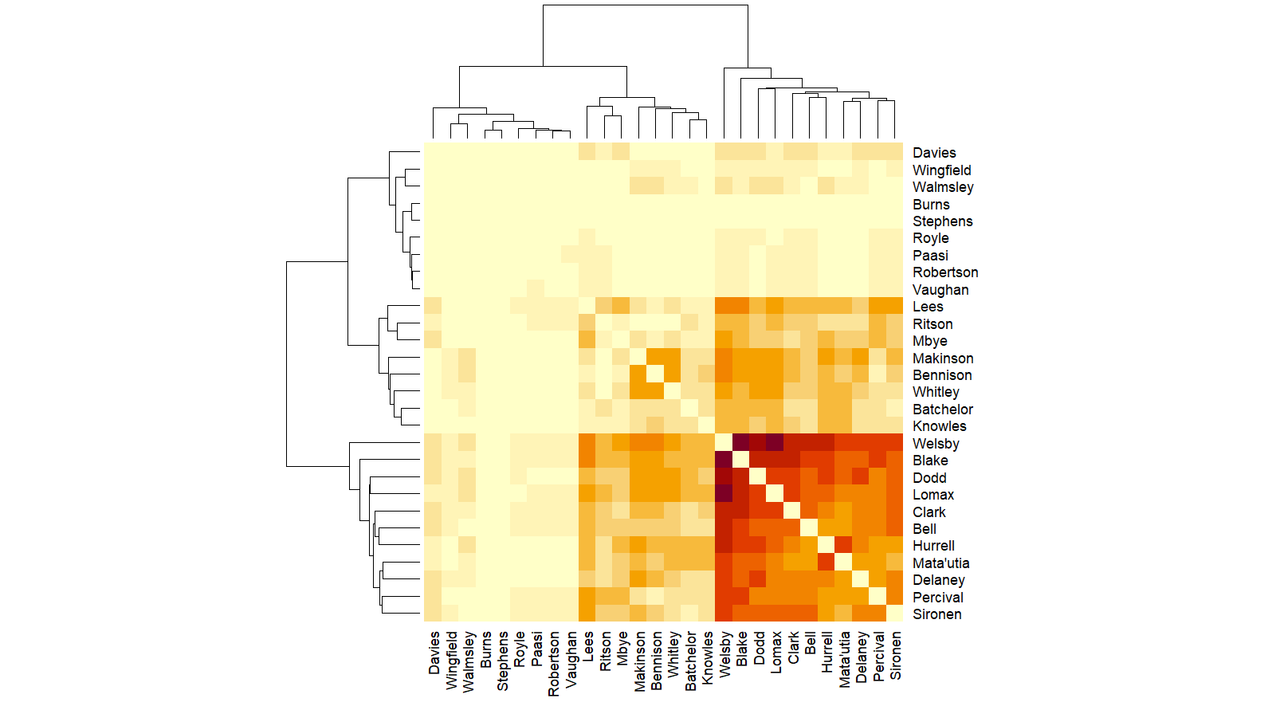
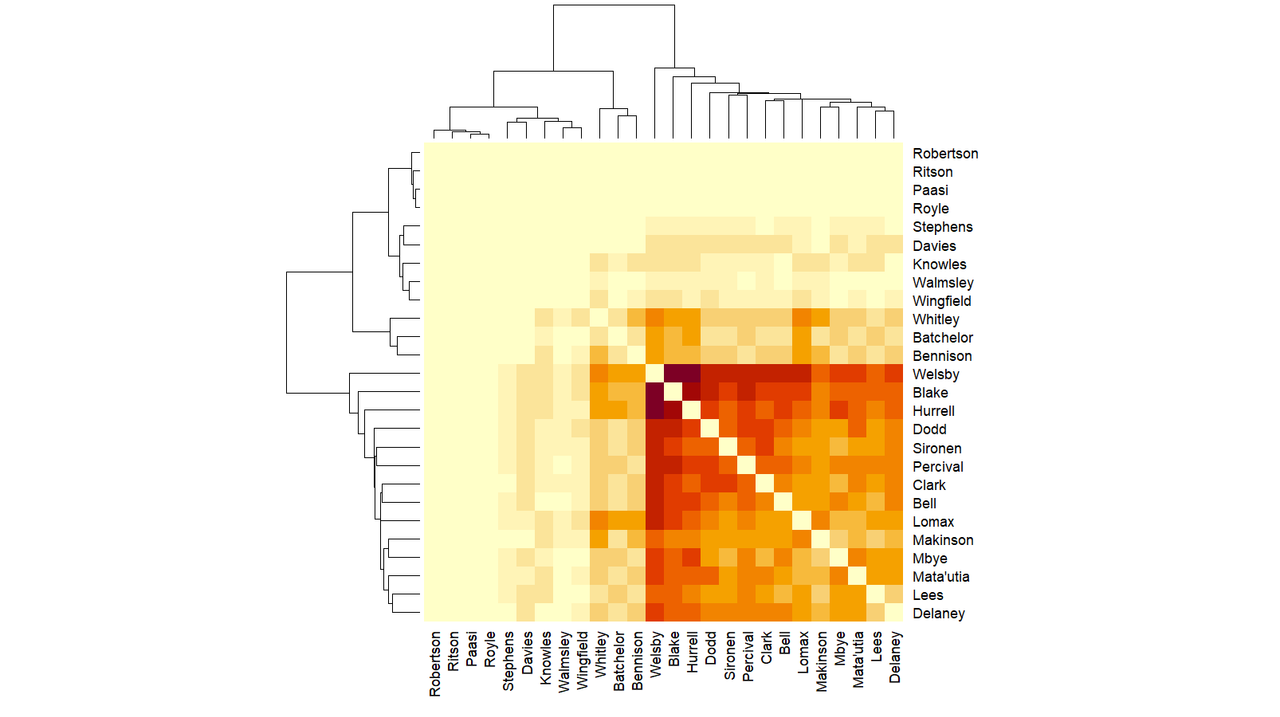
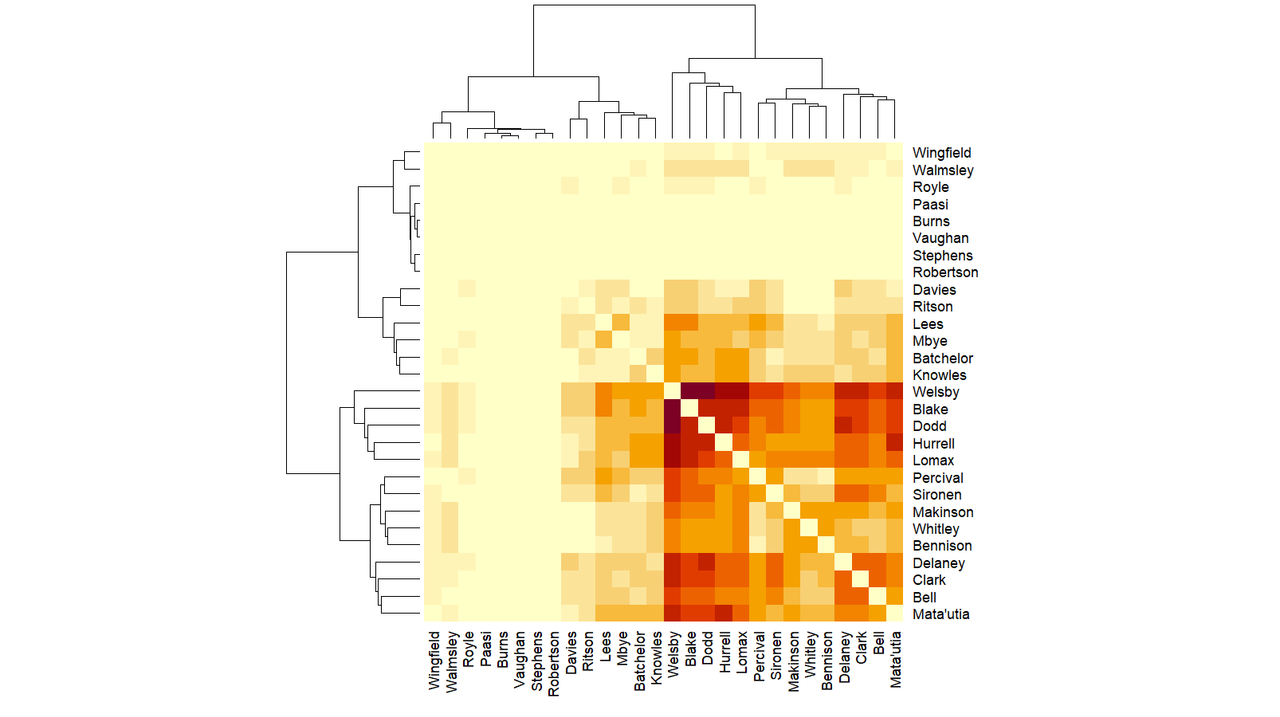
What does the matrix graph look like now? The righter-most and bottom half is the darkest, and contains 14 players.  Moving up or left is the next darkest chunk of 3 players (Batchelor, Whitley, Bennison).  Moving up and left again is the next palest chunk of 5 players (Stephens, Davies, Knowles, Walmsley, Wingfield), then the top most and lefter most palest chunk is Robertson, Ritson, Paasi and Royle.  There is very little difference in the colour of the two most pale chunks, but the darkest chunk is clearly the darkest. 

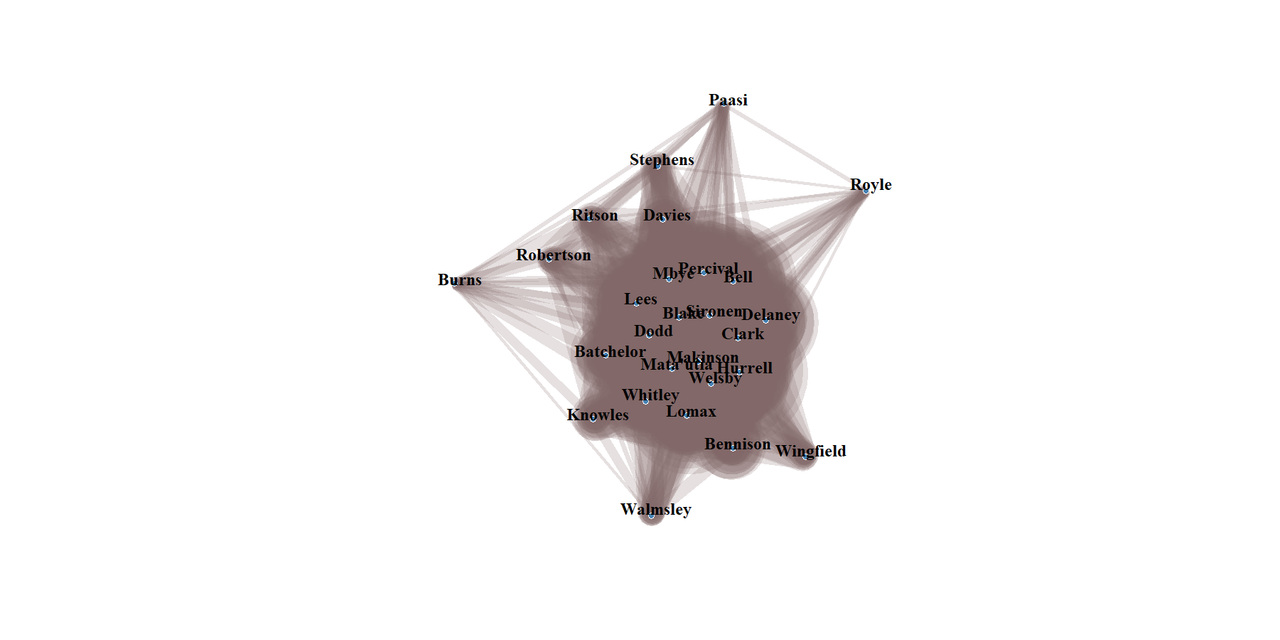
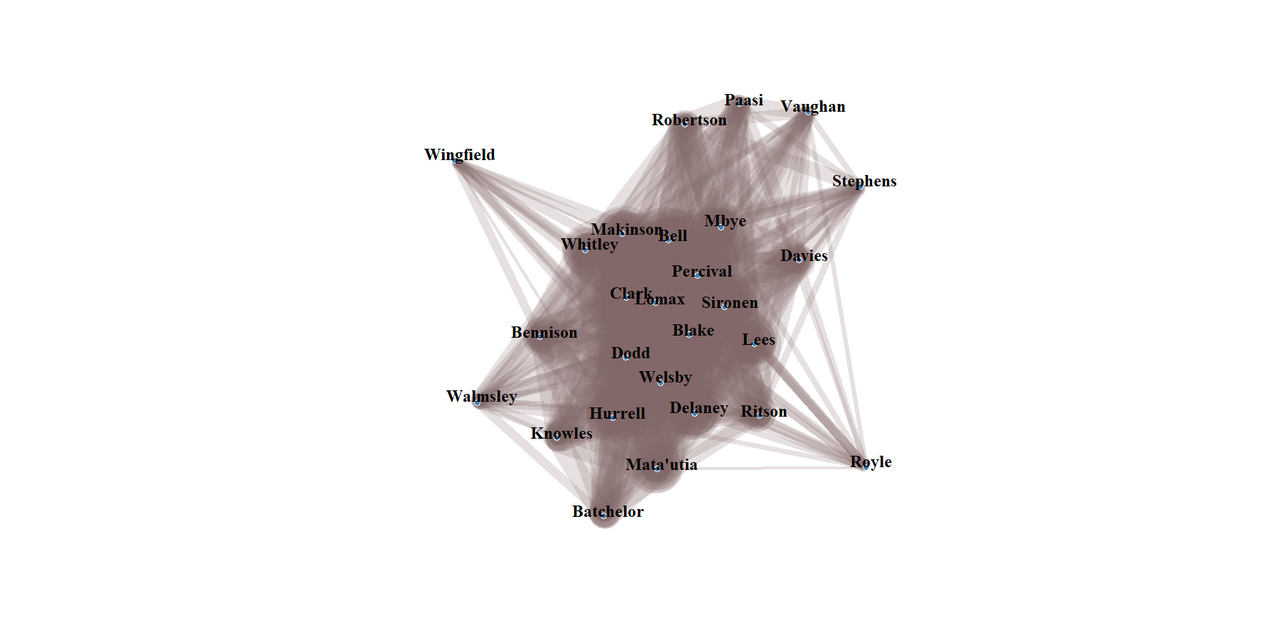
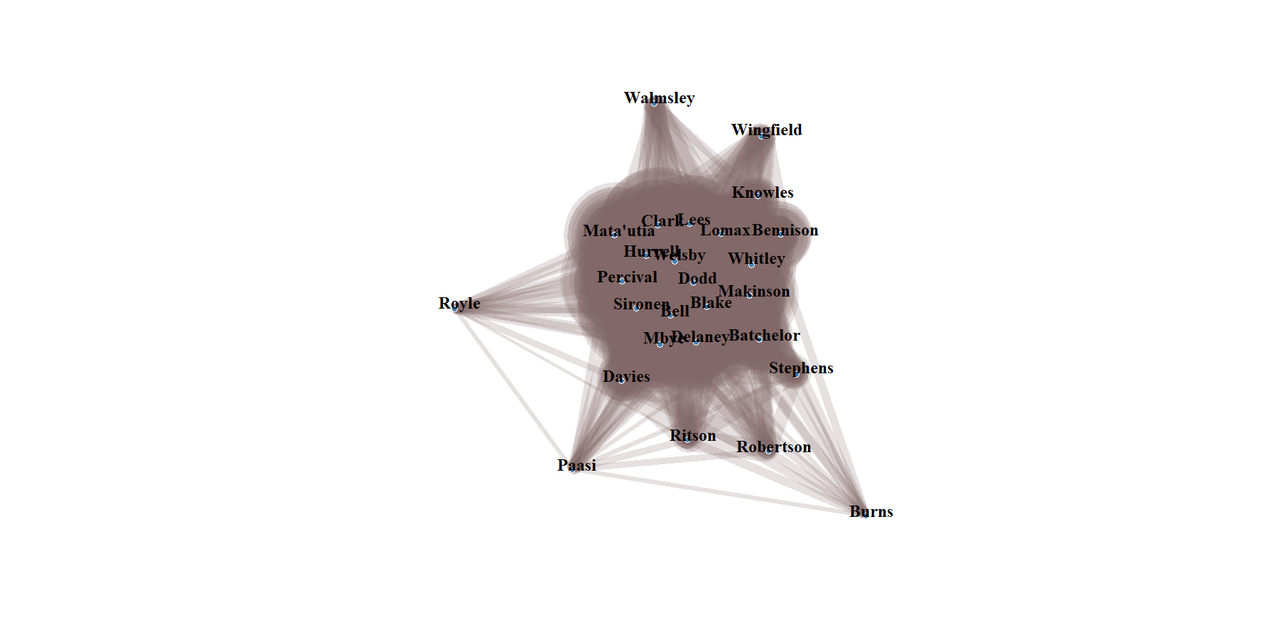
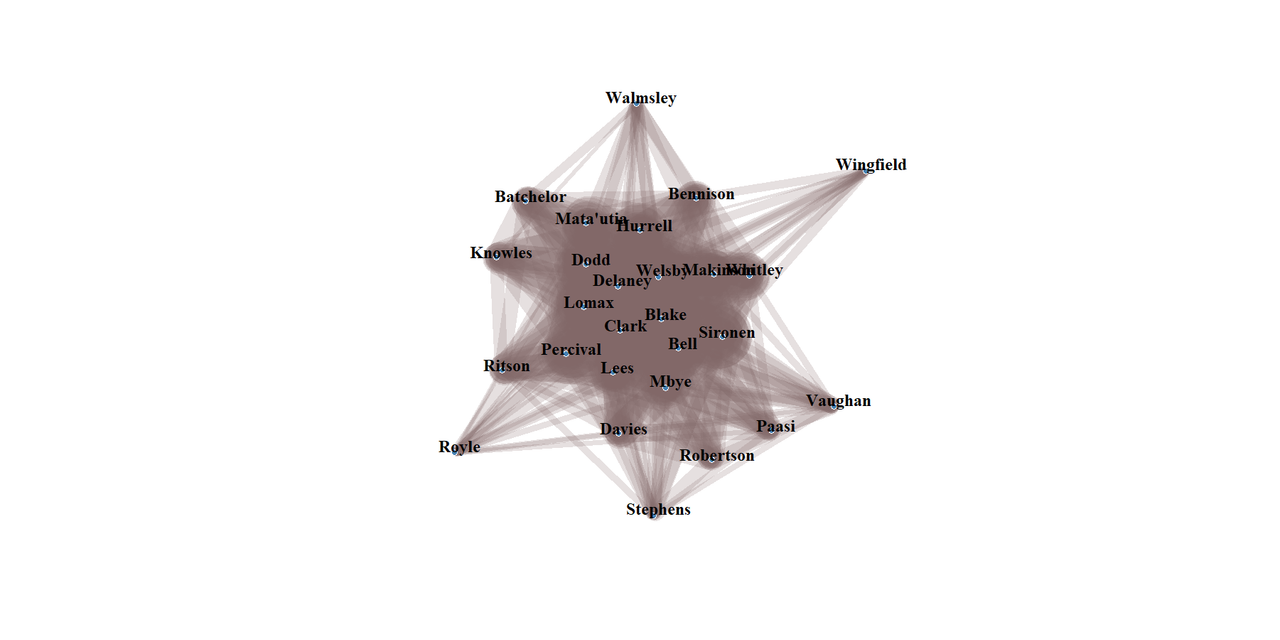
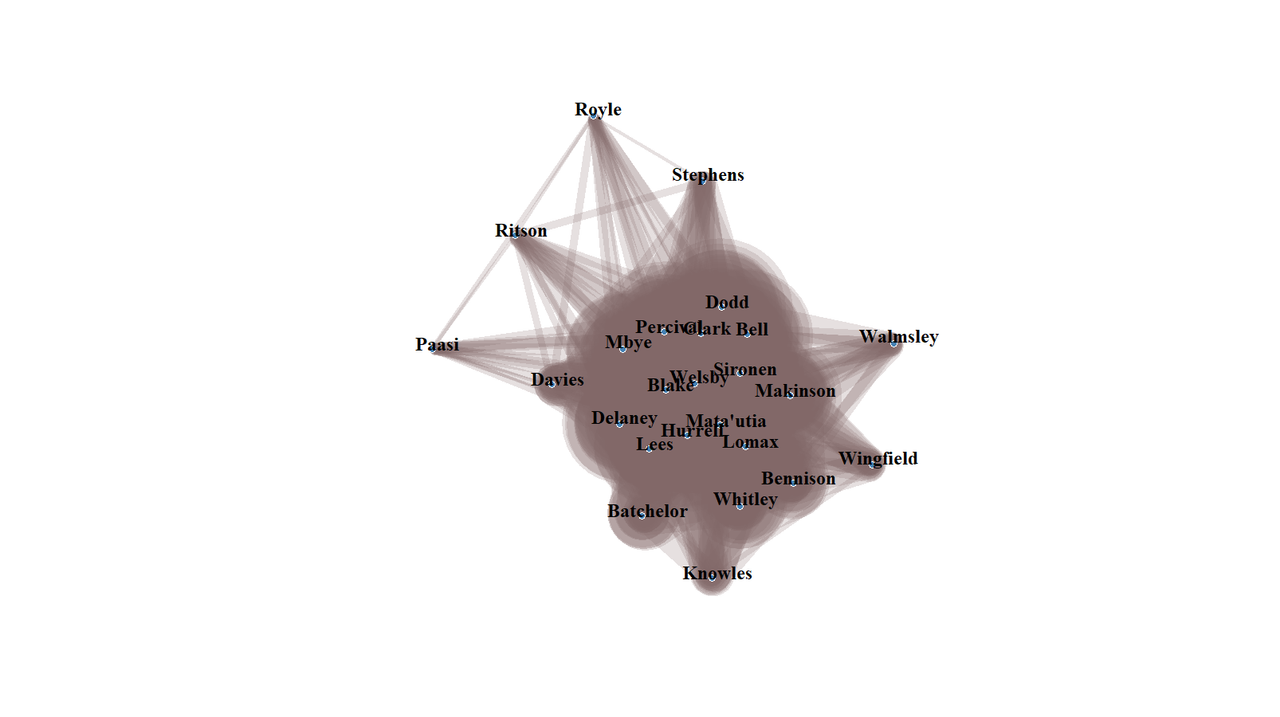
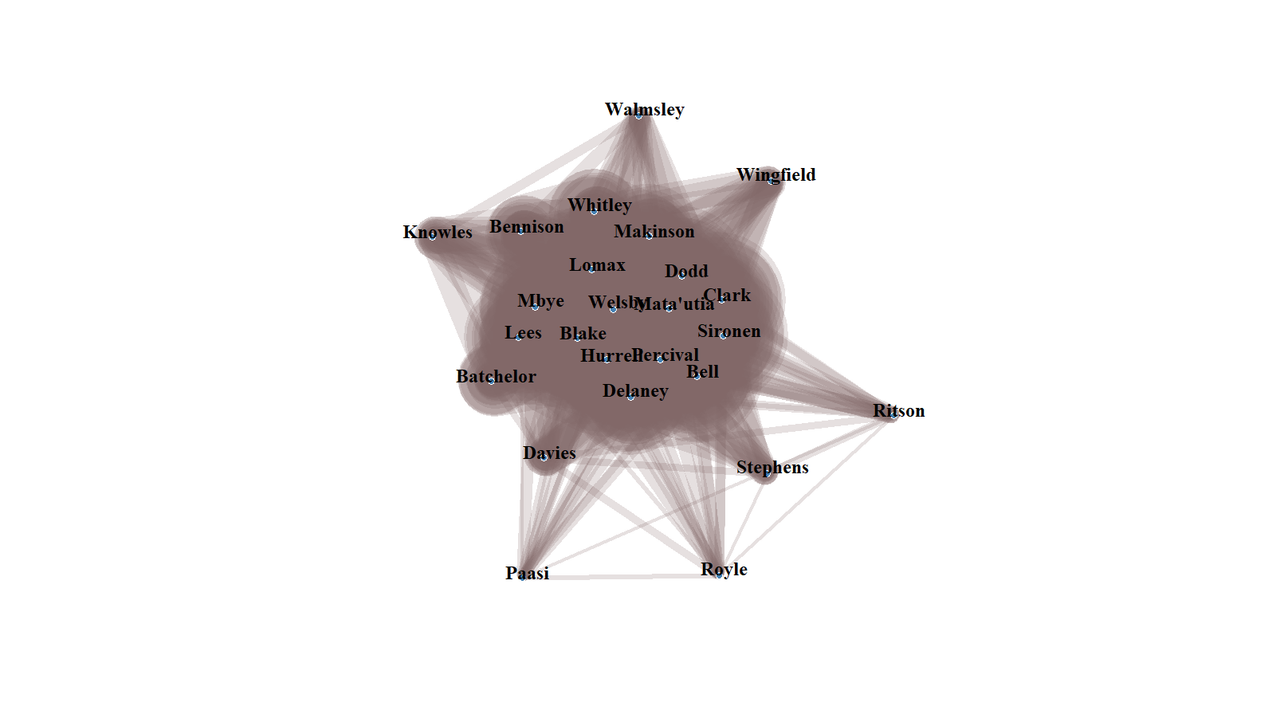
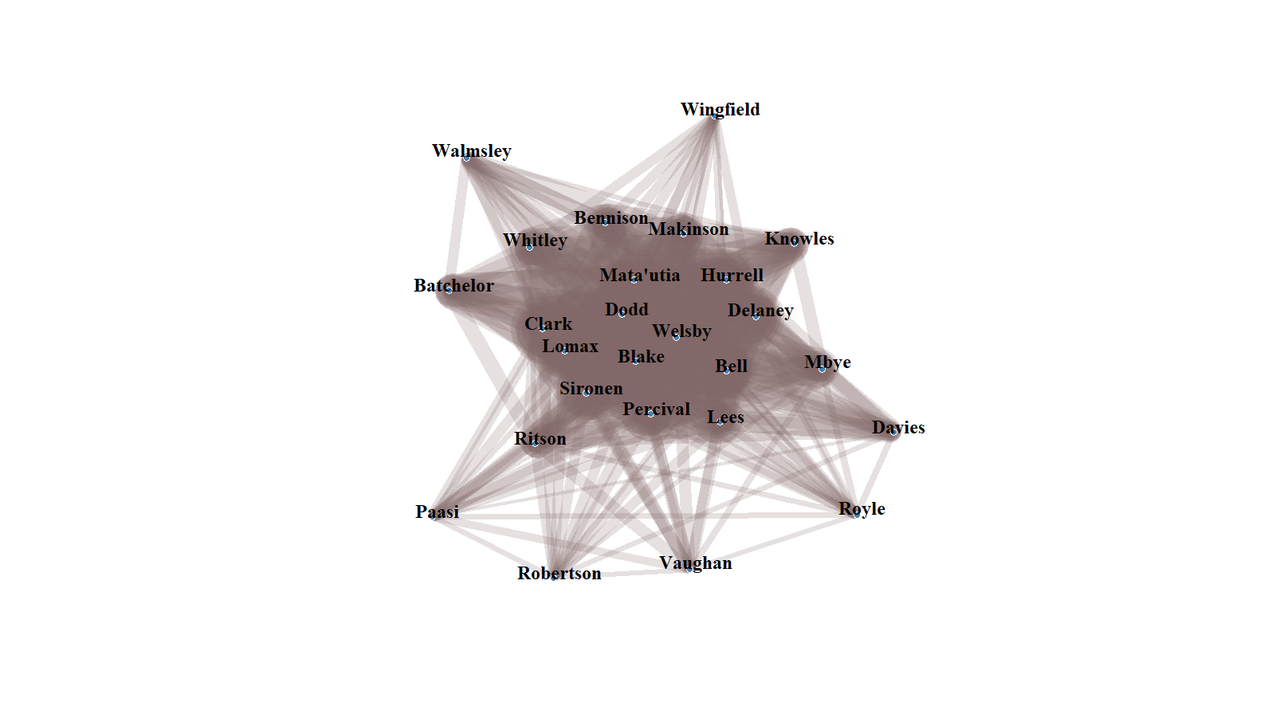
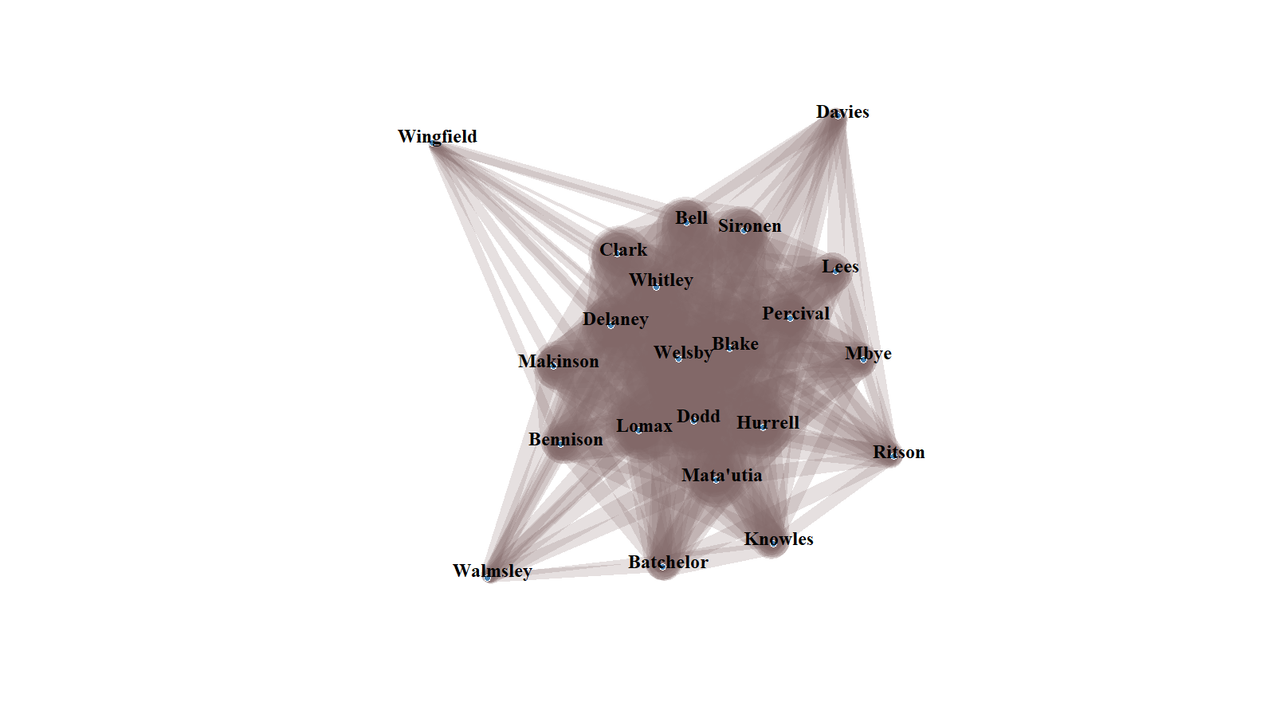
The network graph looks weird. Network graph of which Saints players are present together when Saints score.  There is a central blob and two players sticking up and out right (Wingfield up and Walmsley out right).  That is not the weird bit.  Davies and Stephens sticking out left (Davies) and down left (Stephens) also not weird.  Royle, Ritson and Paasi sticking out but almost making their own community between themselves, Stephens and Davies, that is the wierd bit. 

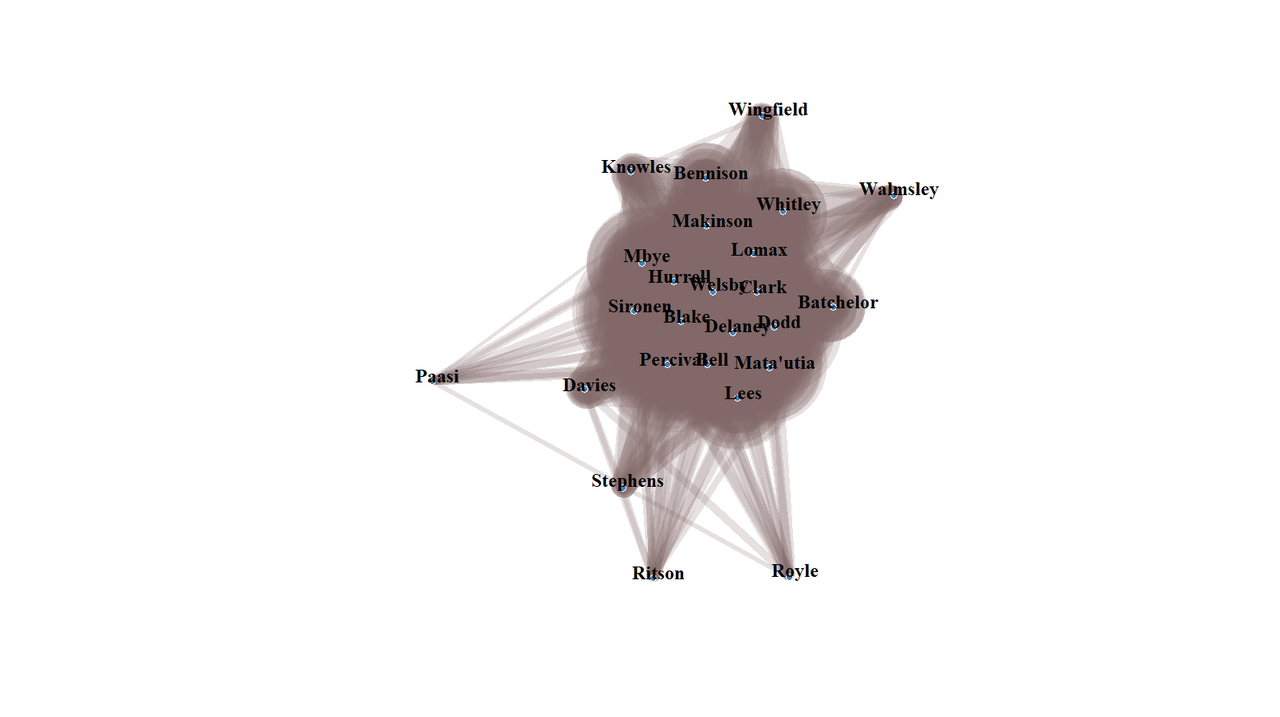
I can't quite explain why Royle, Ritson and Paasi look like they're making a sub-community with Davies and Stephens. I know why Royle, Ritson and Paasi, because the few games they have played have been together, but I didn't think that they'd shared that many with Davies (Stephens yes, Davies, not so much). This is one of the advantages of visualising the data. 

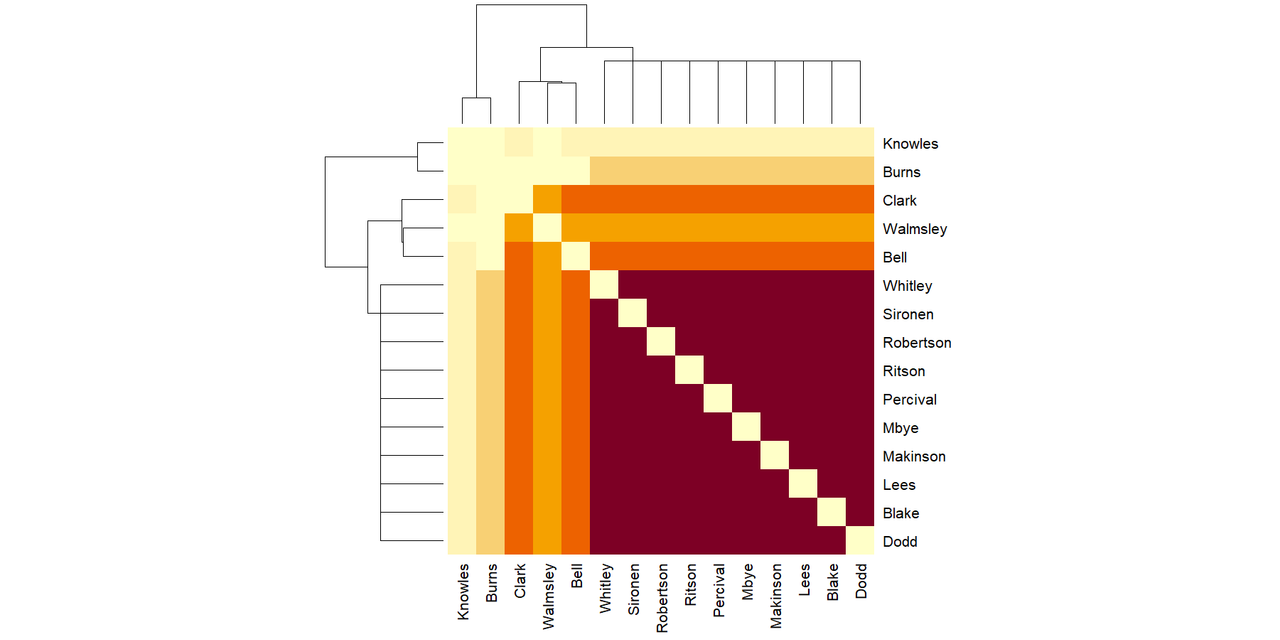
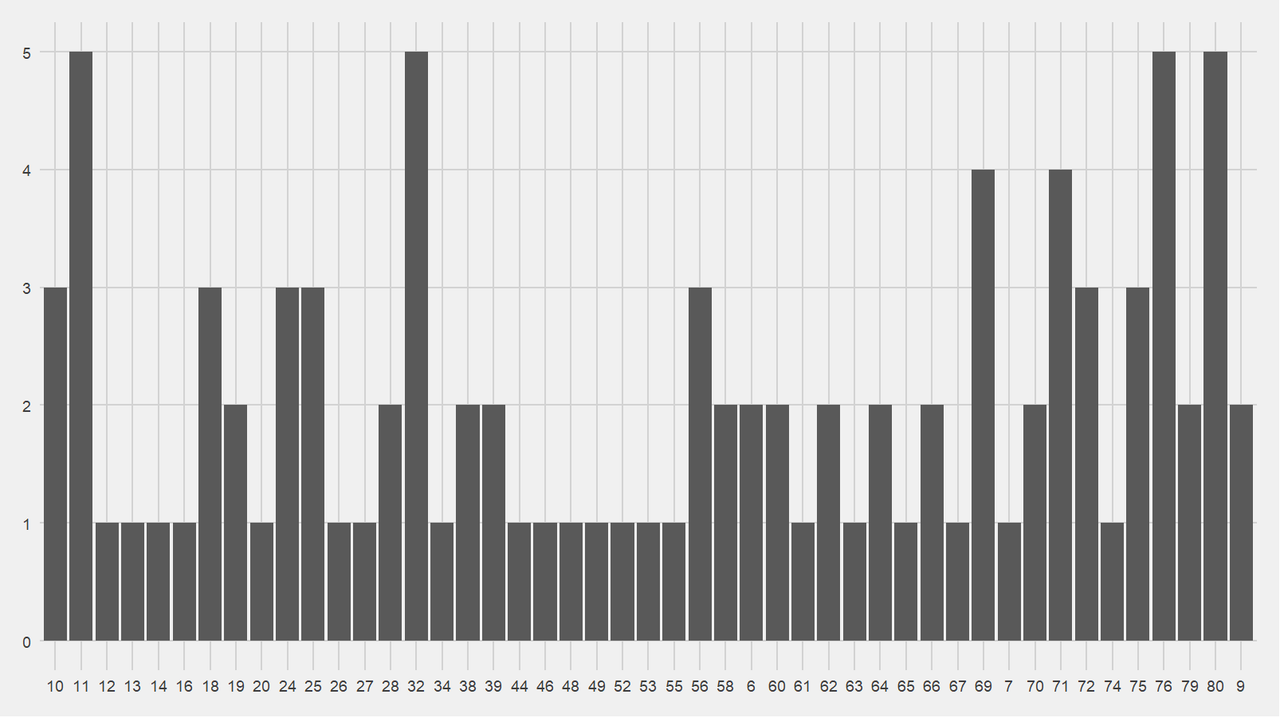
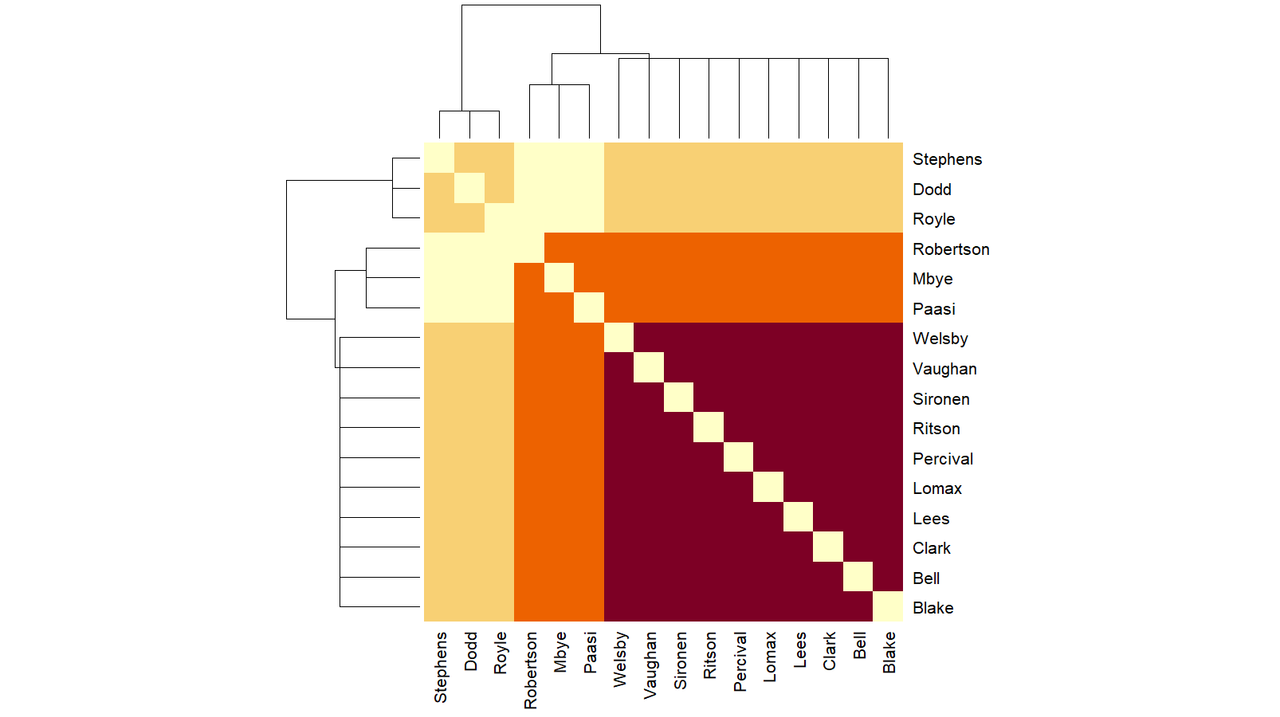
The pattern of when Saints concede has reduced. Bar chart showing when Saints concede.  The highest point is 5 point-conceding moments at minute 11, but there is no real pattern. 

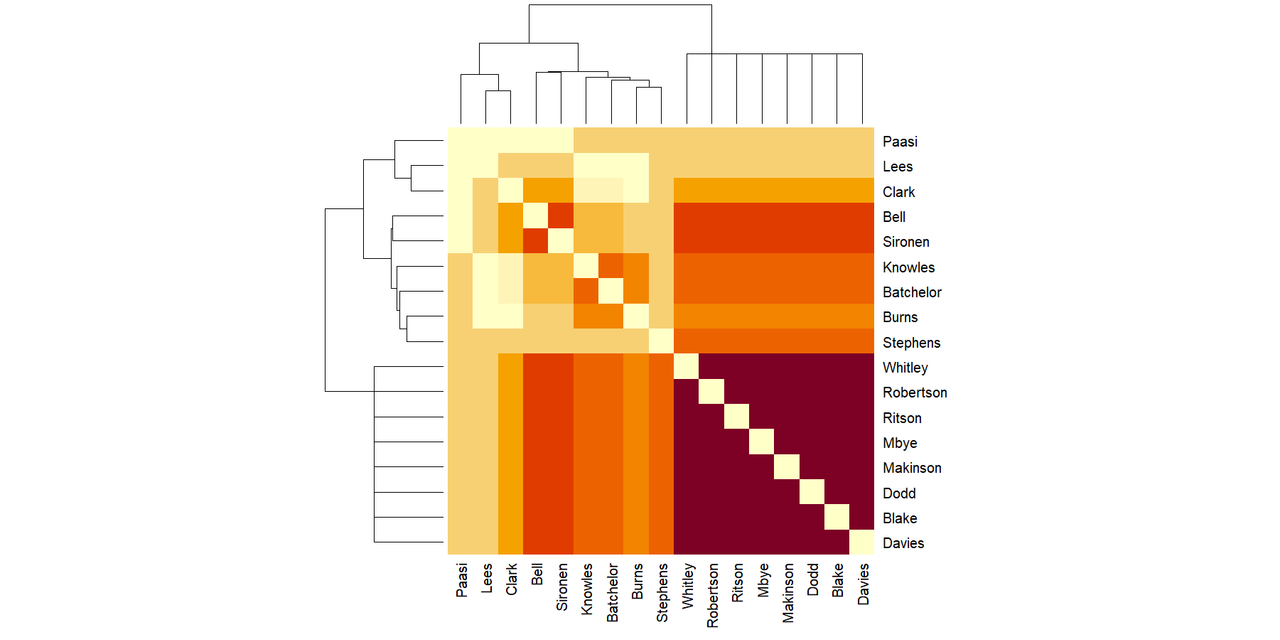
An ever-present when Saints score, Welsby has been ever-present when Saints concede. Bar chart showing players present when Saints concede.  Welsby is present for all 73.  The next two are Blake and Dodd.  The bottom 3 are Paasi, Vaughan and Burns. 

The who-is-present-together when Saints concede matrix looks odd. Normally they go, darkest, paler, even paler, palest (from one side to the other). This one goes darkest, paler, palest, paler than paler not as pale as palest. It appears to be an effect of the same sort of sub-community formation seen in the "present together when Saints score" network graph. Matrix diagram of players who play together when Saints concede.  The darkest area of the most often present together is in the bottom right hand corner.  There is a darker orange chunk containing Lees, Mbye, Batchelor and Knowles, then another paler orange sliver of Davies and Ritson.  Oddly the absolutely palest section of 5 players is next (Paasi, Burns, Vaughan, Stephens and Robertson - or 4 debutants and the injured), then last comes a darker yellow section of Wingfield, Walmsley and Royle. 

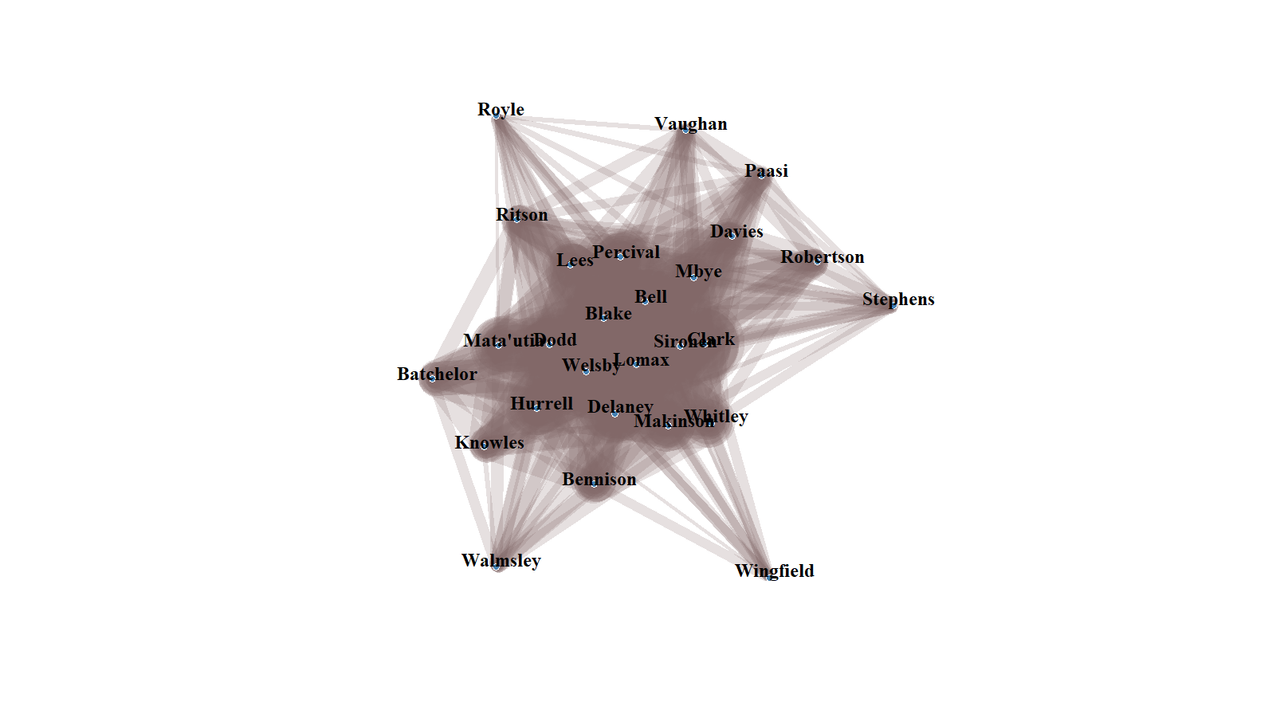
The equivalent network diagram actually looks more reasonably than the point-scoring equivalent. Network graph.  There is a central blob containing most of the players.  Sticking out are (clockwise from top left) Wingfield, Davies (top right), then arrayed along the bottom Ritson, Knowles, Batchelor and Walmsley. 

The last time I compared "rank in the list of present when Saints score" vs "rank in the list of when Saints concede" was game 13, when Saints had hit 100 point-scoring moments and point-conceding moments were about half that (https://fulltimesportsfan.wordpress.com/2024/10/31/saints-ahoy-visualisations-from-game-13-and-the-season-to-date/). 

In this game, Saints hit 150 point-scoring moments (now 153) and point-conceding moments is still ~ half that (73) so I thought this would be a good time to look at that again. 

As expected, the numbers have evened themselves out. 

The player present for the least point-conceding moments relative to point-scoring moments is Percival at -6, followed by Mbye and Stephens at -4. Percival is a mixture of being taken off at minute 50 early in the season and a couple of cards and Mbye tends not to be the starting hooker in the big games (the ones Saints are more likely to concede more in). Stephens is the one who intrigues me because he's a forward who has been given his debut this season, so those are happy numbers. (L will tell you I was excessively fond of Stephens even before this stat.) 

Looking at it the other way (players present relatively more often when Saints concede than when they score) [and ignoring Robertson who has only one game], the only one with numbers >2 (which I am calling insignificant) are Delaney and Ritson and neither of those are explicable. 

I'll keep an eye out on this stat going forward.