Tuesday, 24 June 2025

Saints Ahoy - Game 27 and the 2024 Season to Date

Game 27 was a dismal loss to Warrington. 

Dismal because Warrington, and even more dismal because the only points that Saints scored was from a penalty. It seemed to be that sort of game (https://www.saintsrlfc.com/2024/09/07/saints-beaten-by-warrington-at-the-halliwell-jones-stadium/), with lots of their points also coming from penalties and 3 yellow cards - 2 for them, 1 for us. 

Yup, the team with fewer cards lost.

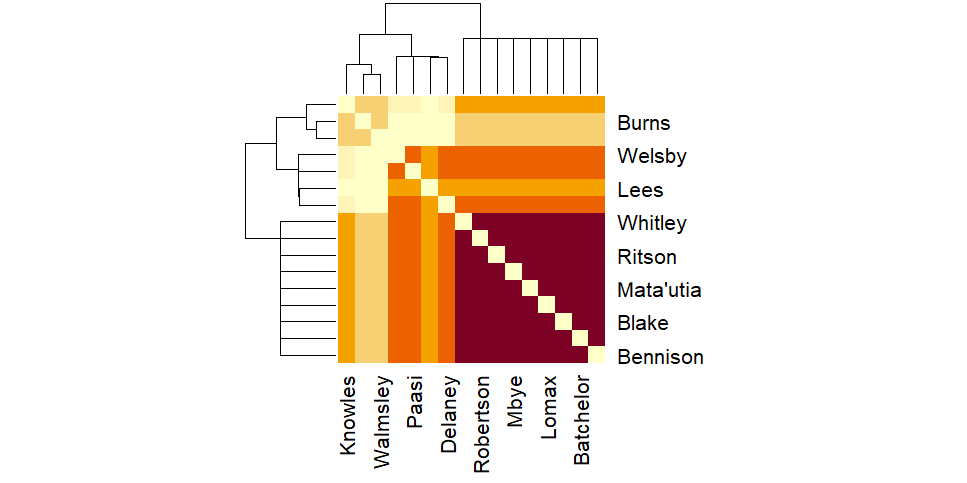
The "who is present together when Saints concede in game 27" matrix indicates quite clearly who the "missing" player was, enveloping Matty Lees in one group even though his line is paler than the players around him. 

Yes, I wonder who got the yellow card! Matrix chart of who is present together when Saints conceded in game 27.  Of interest is the second darkest group (they are in orange), containing Welsby, Paasi, Lees and Delaney.  The line for Lees is a paler orange because he was not present with that group every time Saints conceded.  On this occasion, it is a mark of shame because he had been yellow carded, which Warrington exploited to score twice. Looking at the season to date: 

When do Saints score? Bar chart showing when Saints score.  The highest number of point-scoring moments is 7 in minute 50.  The next highest if 5 point-scoring moments, which has happened in minutes 47, 51, 52 and 65. 
Bennison is now equal to Welsby in the "who scores for Saints?" bar chart. Game 27 was when Welsby made his return from injury. Bar chart showing who scores for Saints up to game 27.  Percival is still way in the lead, as befits the kicker.  He is followed by Makinson, Lomax and now Welsby and Bennison, who are on the same number of point-scoring moments. Who is present when Saints score, up to game 27? Bar chart of who is present when Saints score.  Blake is still way in the lead, then comes Welsby (some way behind) and then Dodd, a little bit behind that. 

To my mind, the interesting thing here is you've got the three present the most (Blake, Welsby and Dodd), followed by one slowly declining cluster (Mbye, Hurrell, Sironen, Percival, Bell, Lomax, Clark, Makinson, Lees, Whitley, Mata'utia and Delaney) then a drop to the bottom cluster who also slowly reduce in number present as you go down the list (Batchelor, Bennison, Knowles, Davies, Ritson, Stephens, Robertson, Walmsley, Wingfield, Paasi, Burns, Royle, Vaughan and Whitby). 

In the matrix of who plays together most often when Saints score, now updated to game 27, the top left border of Whitley, Bennison and Batchelor, first seen in game 26 is still there. Matrix of which players are together most often when Saints score.  There are now 4 clear sections - the darkest, most often together section, in the bottom right corner (Blake, Welsby, Dodd, Sironen, Hurrell, Percival, Clark, Lomax, Mbye, Bell, Delaney, Lees, Matautia and Makinson).  The next two groups are much paler, the first is pale yellow with the occasional beige square, and contains Davies, Knowles, Wingfield, Walmsley, Ritson, Robertson and Stephens.  Then there is the palest section, all pale yellow, which has Burns, Whitby, Vaughan, Royle and Paasi.  Then there is the odd, darker (pale brown, orange and yellow) border along the top and left.  It contains Whitley, Bennison and Batchelor. 

The network graph looks like this:Network graph, there is a central blob.  Sticking immediately out from that blob, clockwise starting from 12 are Walmsley, Paasi at 2.30, Ritson at 3.30, Robertson at 4, Stephens at 5.30, Davies at 5.45 and Wingfield at 9.  Further out is Royle out in the bottom left, Burns all the way out centre right and then Vaughan far far away in the top right. When do Saints concede? Bar chart showing when Saints concede.  The minute with the most point-conceding moments is minute 76 with 7.  The next highest are minutes 11, 32 and 80 with 5. 

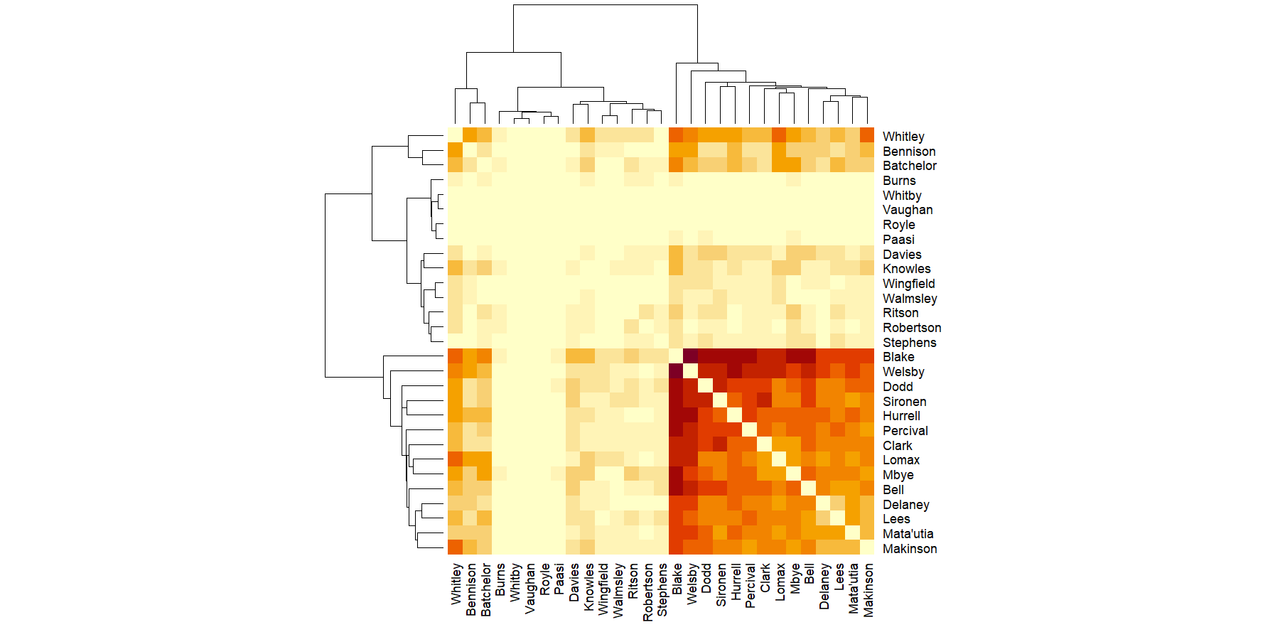
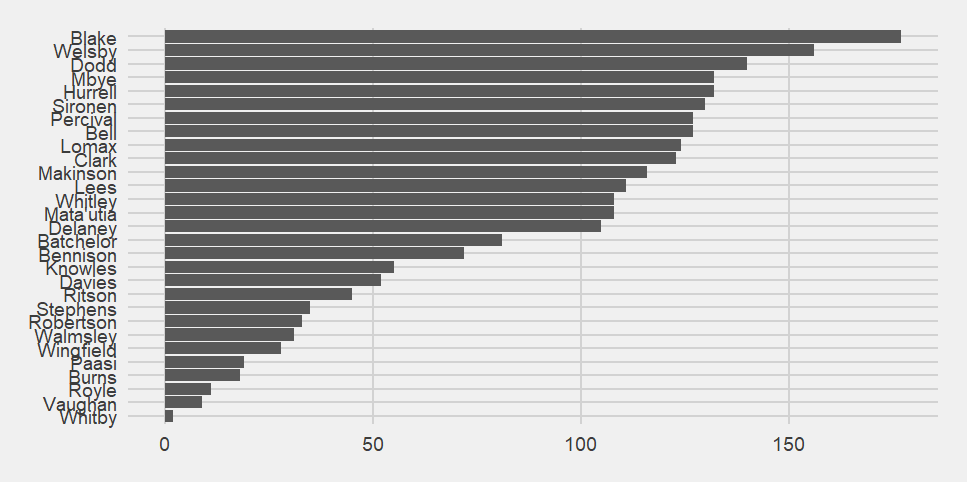
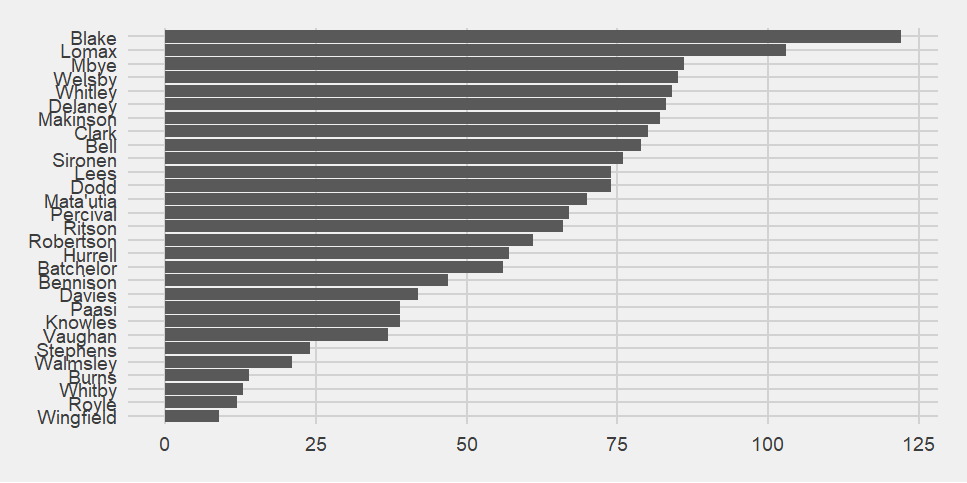
The "who is present when Saints concede" chart has a very different shape to the "who is present when Saints score" bar chart. While that has three distinct sections, this chart has Blake and Lomax in the lead (because they have played a lot of minutes), then a slowly degrading curve covering most of the other players, then a small section of the infrequently present players at the bottom. Bar chart of who is present when Saints concede.  Blake is far in the lead, followed, some way behind by Lomax, then Mbye in third.  Mbye is at the start of that sloping curve I mentioned above.  The small section of infrequently present players are Stephens, Walmsley, Burns, Whitby, Royle and Wingfield. 

The concede matrix looks very similar to last time, except fuzzier once more. It's interesting that as there's more data, the boundaries between the groups get weaker, then they suddenly pop back into strong colours, then weaken again (and so on). Matrix chart of players together when Saints concede.  The darkest area, the players most often together when Saints concede, is in the bottom right hand corner and includes Blake, Lomax, Clark, Whitley, Mbye, Lees, Ritson, Makinson, Welsby, Bell, Matautia, Dodd, Sironen, Percival and Delaney.  The next most commonly together section is much paler, with occasional swirls of darker colour.  It includes Davies, Stephens, Vaughan, Paasi, Robertson, Hurrell, Batchelor, Knowles and Bennison.  The top and left-most is the palest and least often together.  It includes Walmsley, Wingfield, Royle, Whitby and Burns. 
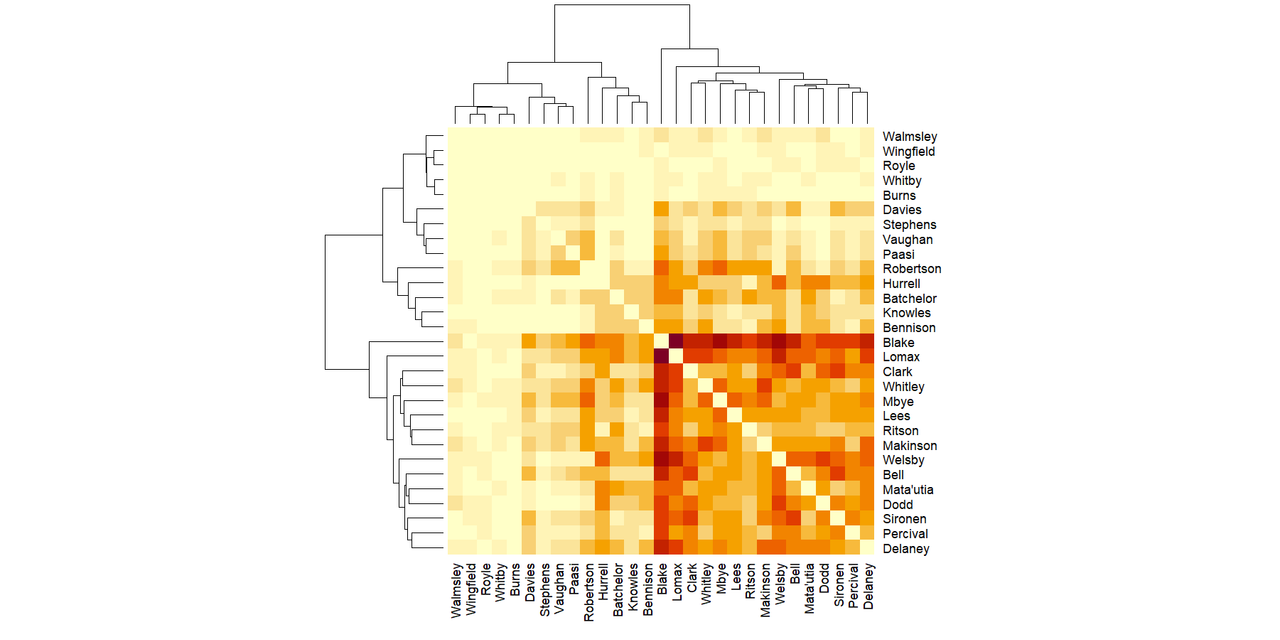
Another interesting this is that, although the shape is similar, some of the players have moved section e.g. Ritson has moved from the middle group to the darkest group, in just one game. 
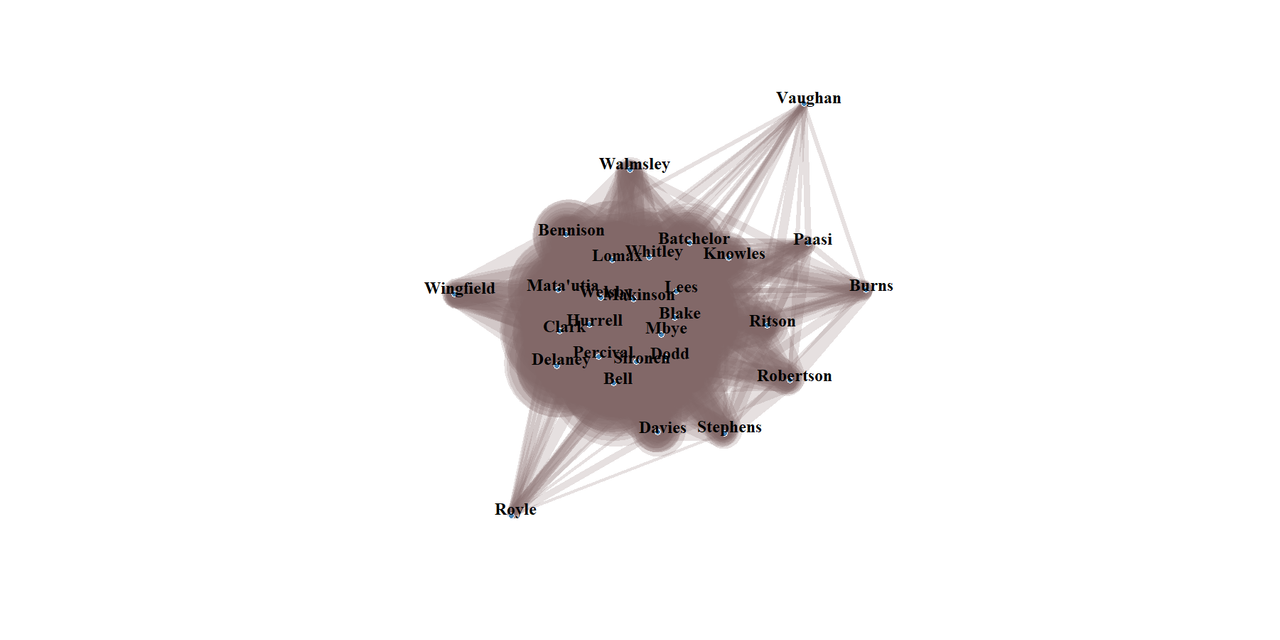
The network graph is the same shape but has shifted about 15 degrees clockwise. Last time I suggested that players were either being sucked into the centre or moving out. It was being sucked in because they're all much closer now. Network diagram showing which players are present together when Saints concede.  Standing out from the central blob, clockwise starting at 10 are Wingfield, Burns at 3, Whitby at 5, Stephens at 6 (but he is almost within the central blob) and Royle at 8. 
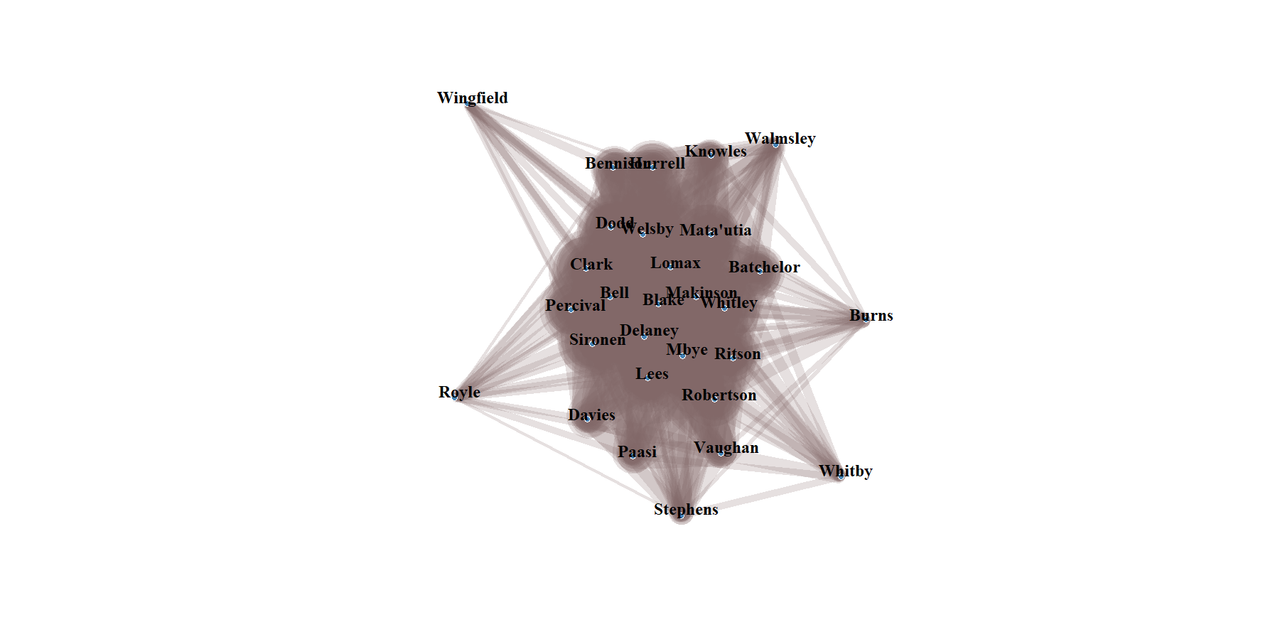
Despite the piles of data, there are still changes, and the players brought in as other players were injured are now clearly part of the main group due to number of matches played. It's been interesting to watch that exchange of players coming in and out of the matchday squad. 

There may be a slight delay as I work on the Women's Euro 2025 network graphs. I am already seeing some interesting patterns.

No comments:

Post a Comment