Wednesday, 18 June 2025

Saints Ahoy - Game 26 and the Season to Date

Game 26 was Saints away at Huddersfield, which Saints won (https://www.saintsrlfc.com/matches/2024/first-team/huddersfield-giants-v-saints-2024-09-01/?swcfpc=1

The biggest news to my mind was Morgan Knowles coming back. I was not alone in this opinion - https://www.sthelensstar.co.uk/sport/24556400.morgan-knowles-brought-saints-return/ 

As that article by the St. Helens Star, a biased source I grant, says, "He missed the best part of three months with a groin issue – a period that coincided with the beginning of Saints’ picking up other injuries and then subsequent run of defeats." It also points out he then missed 3 games due to a ban for a high tackle. 

Saints lost 7 of the 11 games Knowles missed. 

The really terrifying thing is that 2024 was Knowles's 10th year with Saints. Time flies, eh? 

While the game was a victory for Saints, it also highlighted a worrying trend for yellow cards (although I forgive Noah Stephens entirely). 

Bennison having to do the kicks reassured me in the "there is another" with regards to kicks if Percival is off the pitch. 

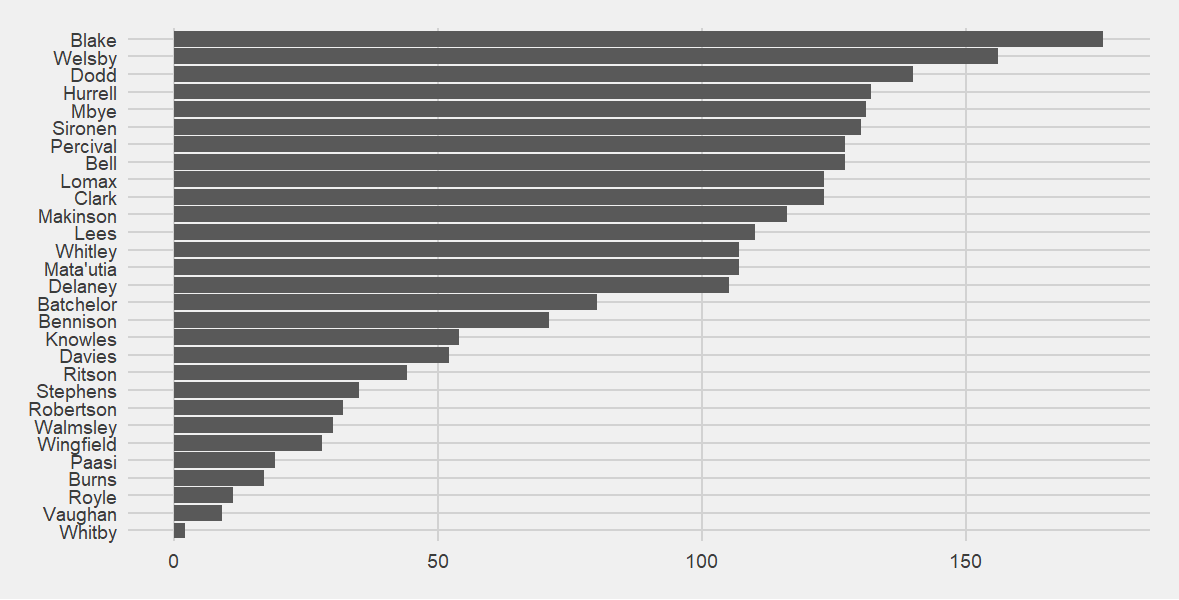
None of match-specific pictures are all that interesting so I'll move on to the season to date diagrams. 

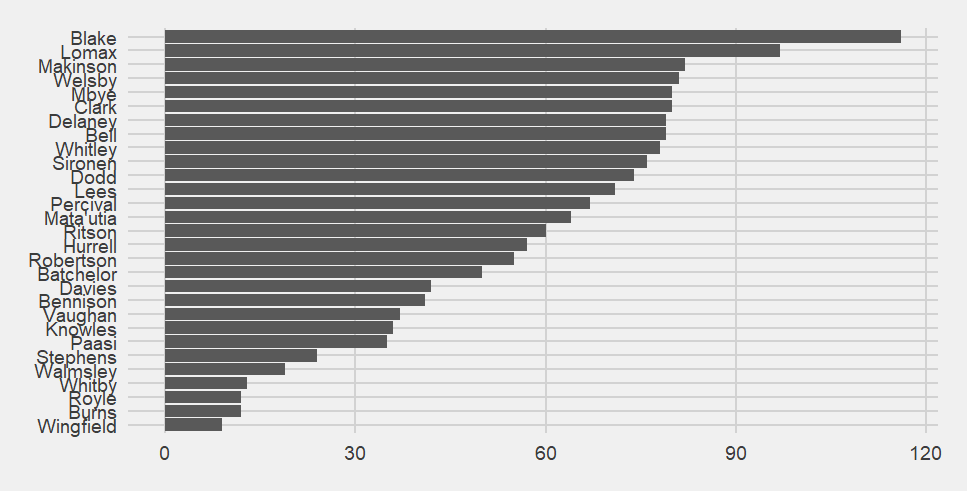
Seeing Bennison shoot up the "who scores for Saints?" diagram after just one game shows how important the kicker is. Bar chart showing who scores for Saints.  Percival, who is normally the goal and conversion kicker, is still the highest with 60 point-scoring moments.  Bennison has moved from 8th on the chart after game 25 to 6th after game 26. 
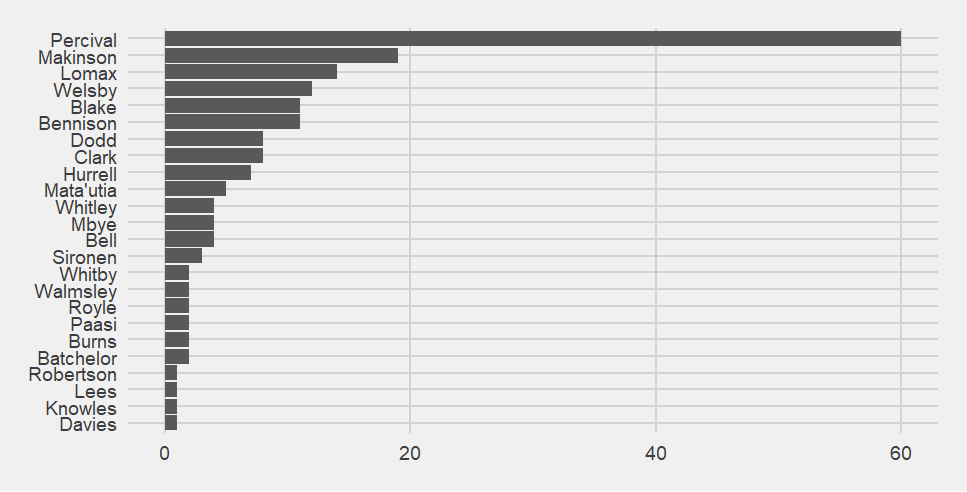
Robertson is now on the list after scoring his first ever try for Saints. 

Overall 24 different players have scored either a try or conversion for Saints in 2024. 

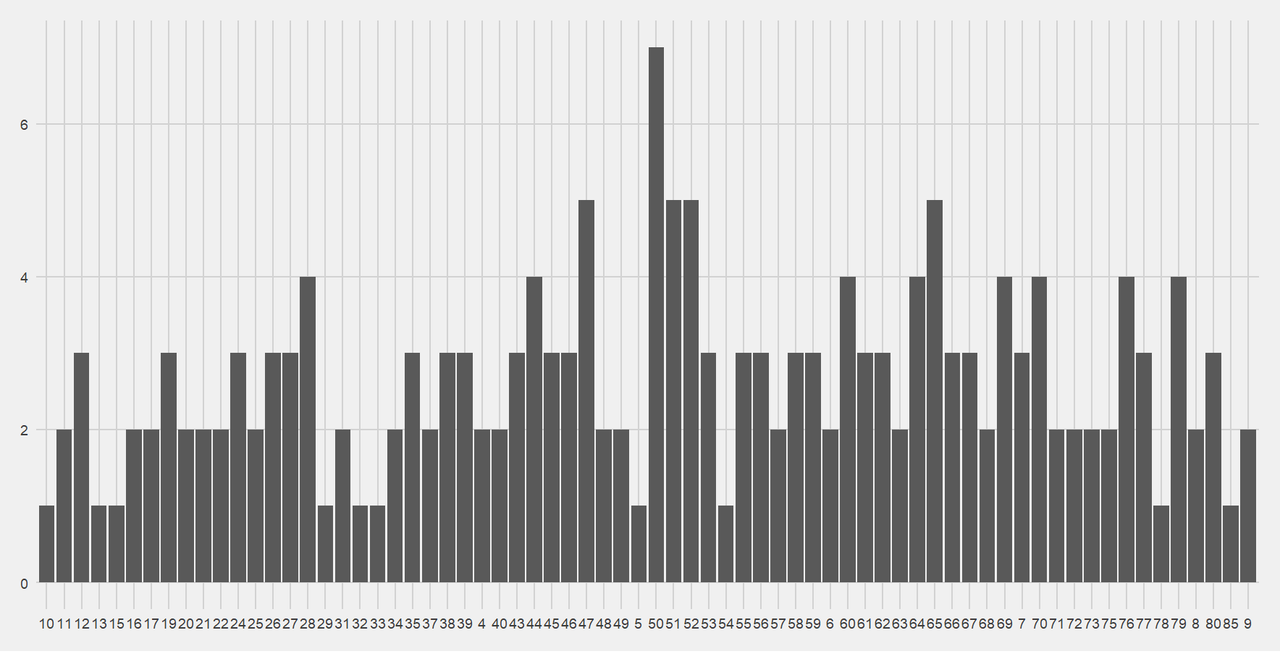
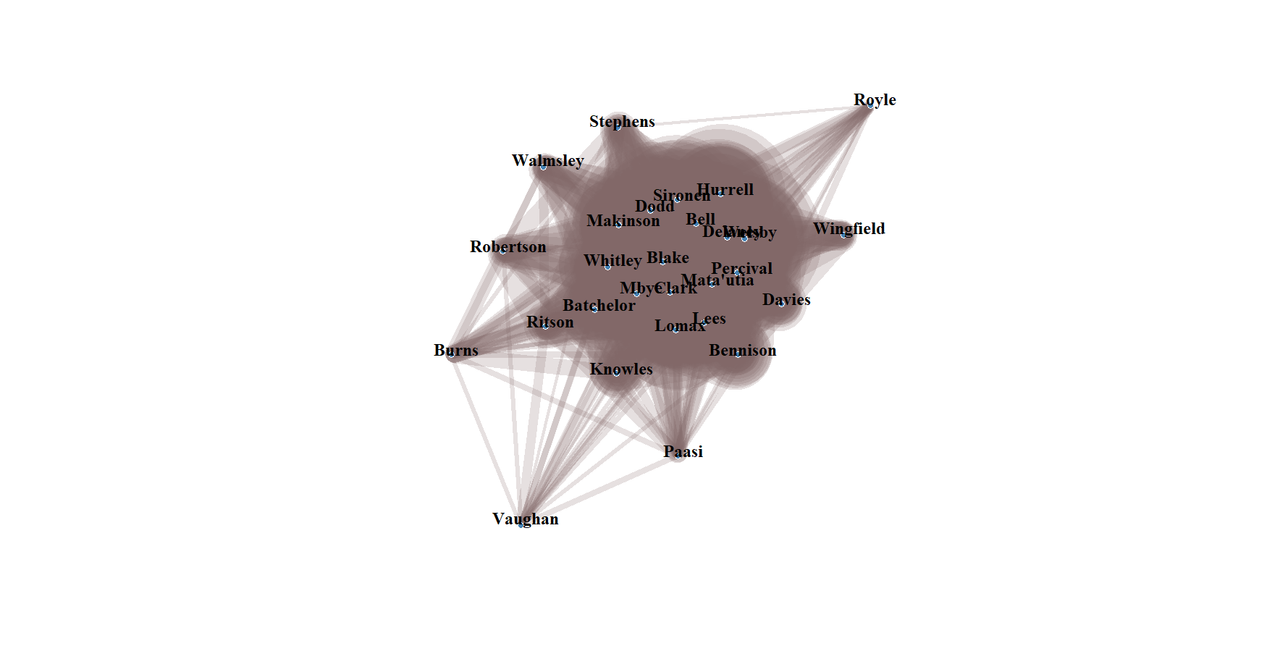
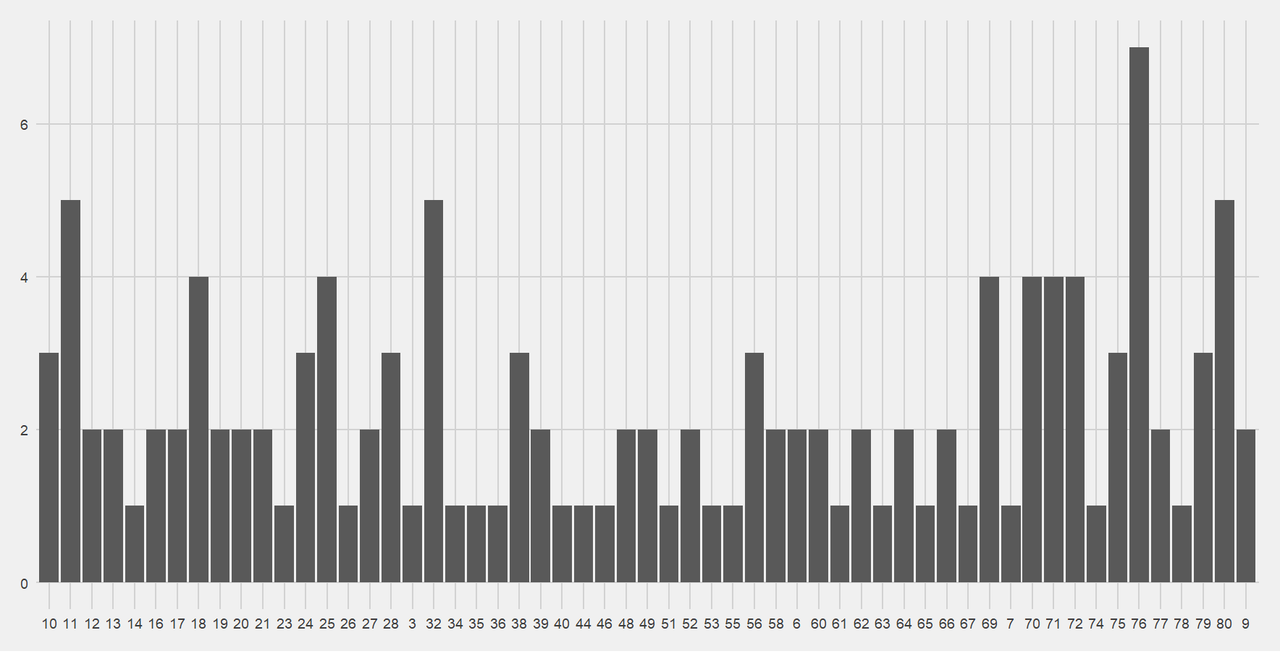
When do Saints score? Bar chart of when Saints score.  Minutes 45-55 still have the most and it still looks like a Gaussian distribution.  Minute 50 has the most with 7 point-scoring moments.  Minutes 47, 51 and 52 have 5 point-scoring moments, as does minute 65. 
Who is present when Saints score? Bar chart of who is present when Saints score.  Blake is still in the lead, followed by Welsby and Dodd. 

The matrix of who is present when Saints score is interesting: Matrix of who plays together when Saints score.  The darkest part of the diagram (the players who play together most often when Saints score) is in the bottom and right part of the diagram and goes about halfway up.  It contains Blake, Welsby, Dodd, Sironen, Hurrell, Percival, Clark, Lomax, Mbye, Bell, Makinson, Matautia, Delaney and Lees.  Next up and out is a noticeably paler section of Davies, Knowles, Wingfield, Walmsley, Ritson, Robertson and Stephens.  Then is the palest area, of Whitby, Vaughan, Burns, Royle and Paasi.  Oddly, there is a dark border around the top and left hand side (of Whitley, Bennison and Batchelor, which suggests they are often together when Saints score but not with the others.  Probably this is due to extended absences from the team for all 3. 
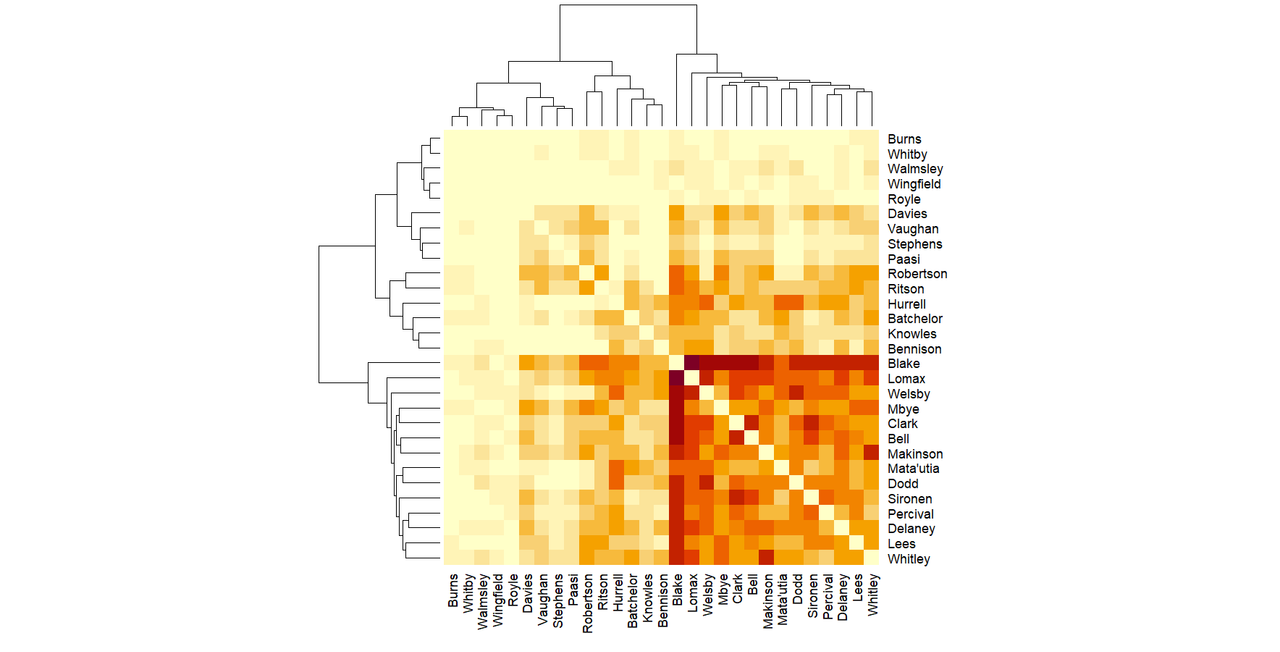
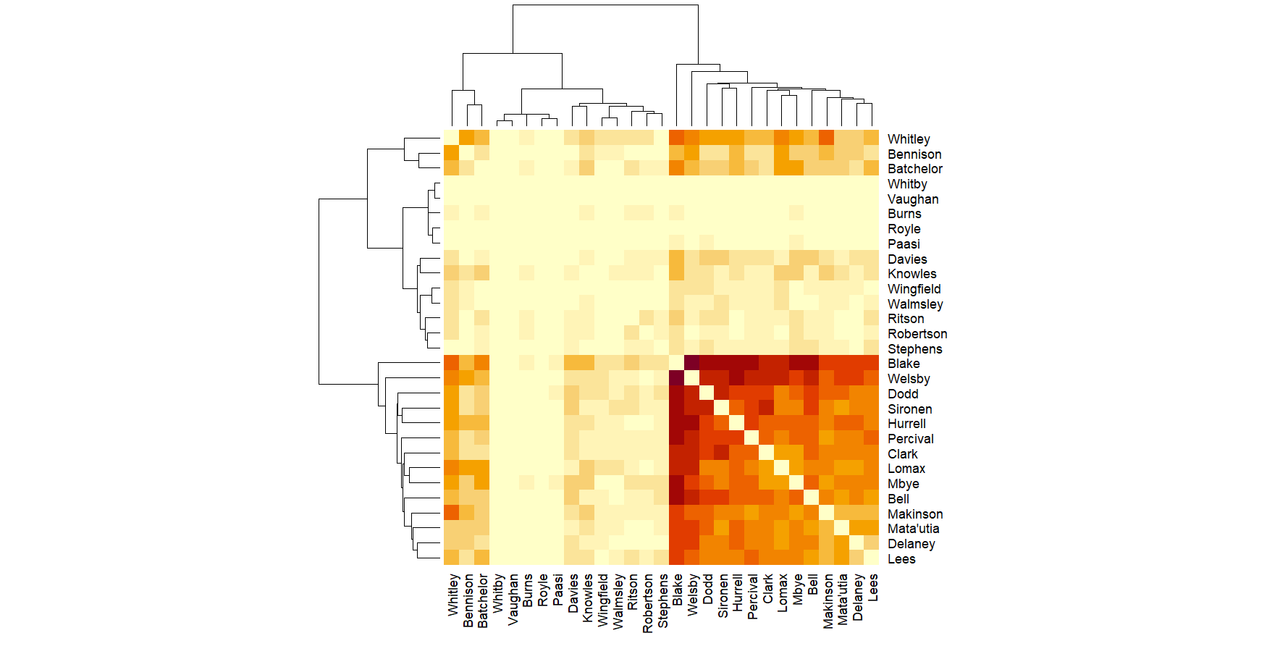
Normally it would go darkest (most often together) in the bottom right hand corner and paler (less often together) as it moves up and to the left. 
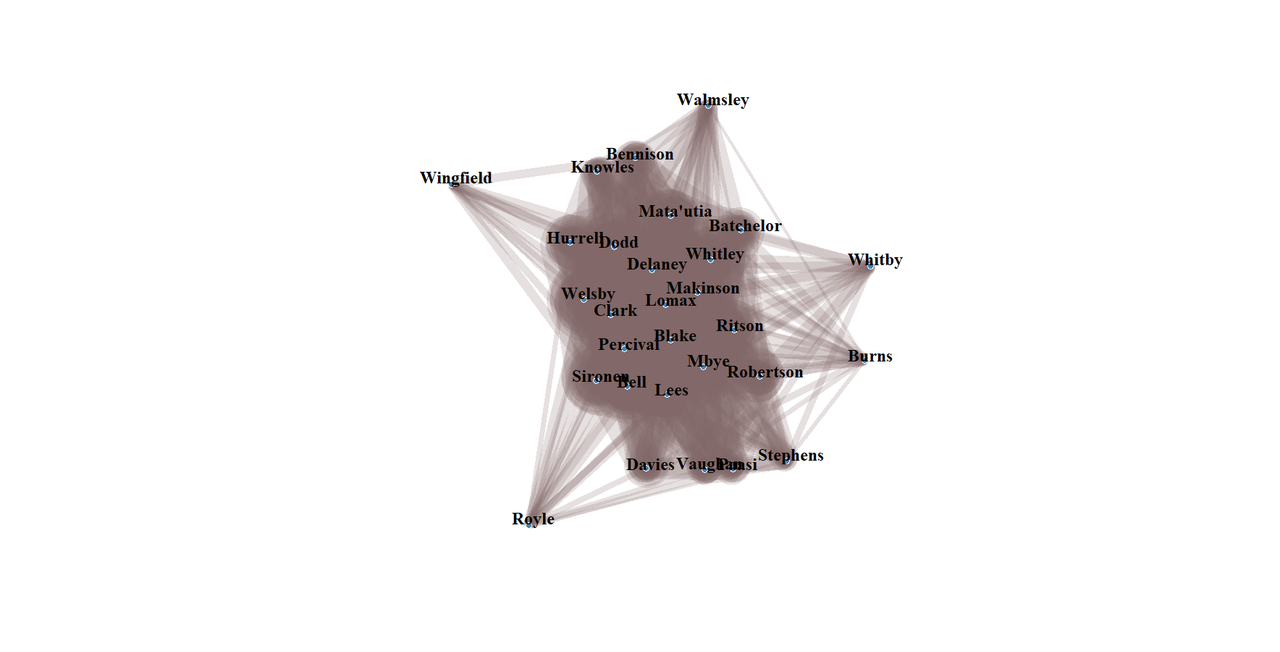
This time, that pattern happens but then there's a suddenly dark border along the top and left which consists of Whitley, Bennison and Batchelor, suggesting Saints score when they are on the pitch together. The grouping makes some sort of sense because Batchelor definitely missed some matches with an injury. 

The equivalent network graph is slightly different again. Network graph of who is present together when Saints score.  There is the central core, with a secondary ring around it.  On the second ring, clockwise, starting at 3 on the clock are Wingfield, Davies, Bennison, Knowles, Ritson, Robertson, Walmsley and Stephens.  Sticking out top right is Royle, bottom centre is Paasi, bottom left is Vaughan, left but up a bit Burns. 

It's interesting that two ways of presenting the same data give subtly different results. 

There's no real changes to the pattern of the "who scores against Saints" diagram so I haven't included it. 

The last 10 minutes of the game is still when Saints are most vulnerable. Bar chart of when Saints concede.  The minute with the most point-conceding moments is minute 76 with 7.  Next highest are minutes 11, 32 and 80 with 5, but minutes 69, 70, 71 and 72 all have 4 point-conceding moments. 
Blake also leads the "who is present when Saints concede?" chart Bar chart showing who is present when Saints concede.  Waqa Blake is present for the most, and he is a long way ahead of the next most present - Jonny Lomax. 

The matrix diagram of who is present together when Saints concede is not as pretty as it was after game 25 (https://fulltimesportsfan.wordpress.com/2025/06/11/saints-ahoy-game-25-and-the-2024-season-to-date/). It think it's because the "curls" of more often together in the mid-section are less well defined than they were last time. Matrix chart of players together when Saints concede.  The darkest area, the players most often together when Saints concede, is in the bottom right hand corner and includes Blake, Lomax, Welsby, Mbye, Clark, Bell, Makinson, Matautia, Dodd, Sironen, Percival, Delaney, Lees and Whitley.  The next most commonly together section is much paler, with occasional swirls of darker colour.  It includes Davies, Vaughan, Stephens, Paasi, Robertson, Ritson, Hurrell, Batchelor, Knowles and Bennison.  The top and left-most is the palest and least often together.  It includes Burns, Whitby, Walmsley, Wingfield and Royle. Unlike the "who is present when Saints score?" matrix and network graphs, the concession network graph mostly matches the matrix diagram. Network graph of who is on the pitch together when Saints score.  The central blob matches the darkest parts of the matrix chart but does contain a couple of the players in the lighter parts of the matrix diagram, so it contains Blake, Lomax, Welsby, Mbye, Clark, Bell, Makinson, Matautia, Dodd, Sironen, Percival, Delaney, Lees and Whitley, as well as Hurrell, Ritson, Robertson and Batchelor.  The remainder of the next darkest area in the matrix chart are the 7 players whose names are either being sucked into the central blob or are escaping from it.  They are, at the top of the diagram, Bennison and Knowles, and at the bottom of the diagram, Davies, Vaughan, Paasi and Stephens.  The players in the palest area are also those furthest away from the centre of the network graph.  They are Walmsley at the top, centre right, Whitby, Burns slightly down from him.  Bottom left is Royle, top left is Wingfield. 

I am now wondering whether the darker swirls in the matrix chart are those players who are in the intermediate group in the network graph.

No comments:

Post a Comment