I'd like to tip my hat to Ted Knutson (@mixedknuts on twitter, other microblogging platforms are available and I'm mostly at @kpfssport@mastodonapp.uk) for the concept of "something or bug", which came from the effect of that year that Burnley really outperformed expectations on Statsbomb’s analyses. Burnley’s data was so different to everyone else’s that after every analysis they had to check whether any outlier was a bug or just Burnley being Burnley.
I strongly suspected that Erling Haaland's goalscoring stats would have that effect on my graphs but he had such a good first season in the Premiership that I couldn't really say no to L's suggestion when he said "why don't you add Haaland's stats to the analysis?".
I was right to think Haaland's numbers were going to do terrible, terrible things to my graphs.
First of all, he's so young that for actual data, there's only numbers up to age 22.
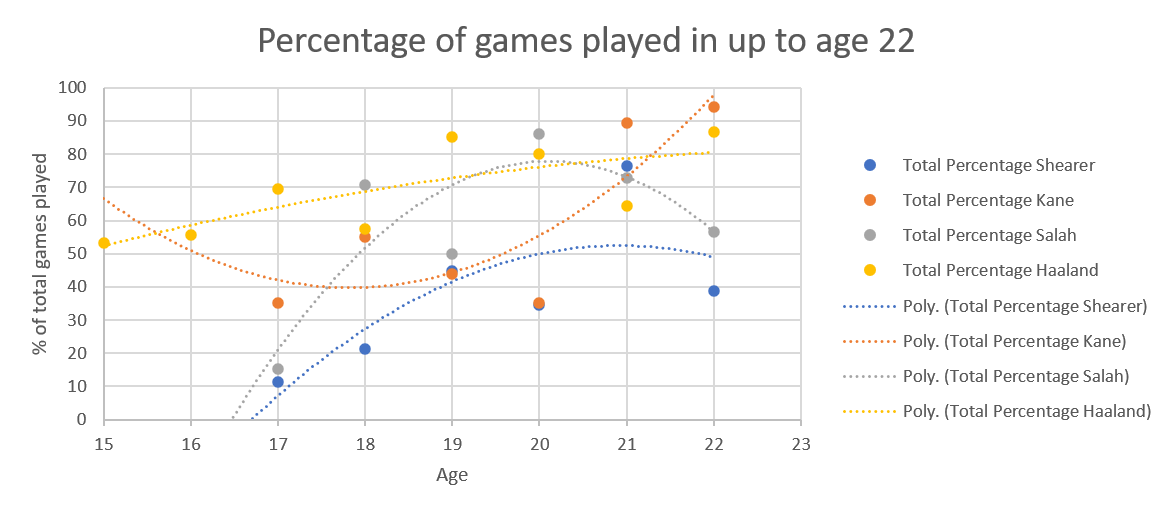
For percentage of games played, that makes the data look wild.
The percentage of games young players play varies so much depending on circumstance, things like depth of talent at their club, whether they've been loaned out to another club to get some seasoning, whether the coach wants to build them up slowly. So many variables, so it's really messy when you look at data from that age.

That variability is most clearly seen in Kane's graph, which is upside down compared to the others.
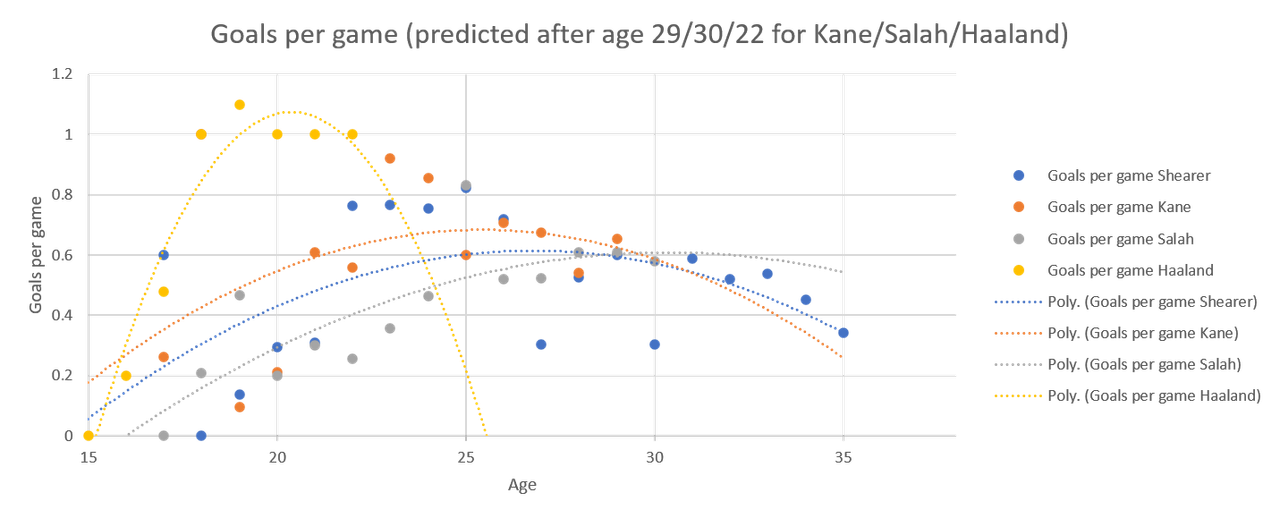
Because there's so little real data, the extrapolation in the graph to end of career, 35 years of age because that's when Shearer stopped, particularly effects Haaland's numbers. On the other hand, the extrapolation is needed because everyone's numbers go up after 22. 

I think that explains why Haaland's numbers drop so quickly in this graph and I think that'll steady itself with another year's data. I mean, according to this, his numbers max out at 24 and, barring injury (and may he be kept from those) that doesn't reflect footballing truth.
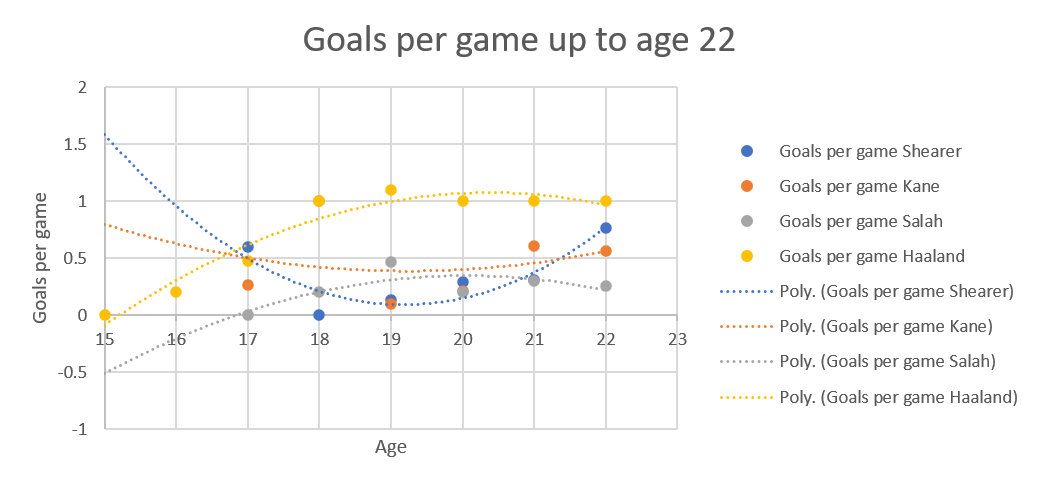
The goals per game up to the oldest point all four players have reached is another one bent and mangled by lack of data.
 That's two upside down curves versus two right way up curves, because of the extrapolation needed because Haaland started in the adult leagues earlier than the others.
 That's two upside down curves versus two right way up curves, because of the extrapolation needed because Haaland started in the adult leagues earlier than the others.
 Also, this was all while Salah was still a winger, which explains his low numbers.
On the other hand, you can imagine the nonsense extrapolation makes of Haaland's numbers if you send them forward to him being 35.
Behold, the nonsense: 

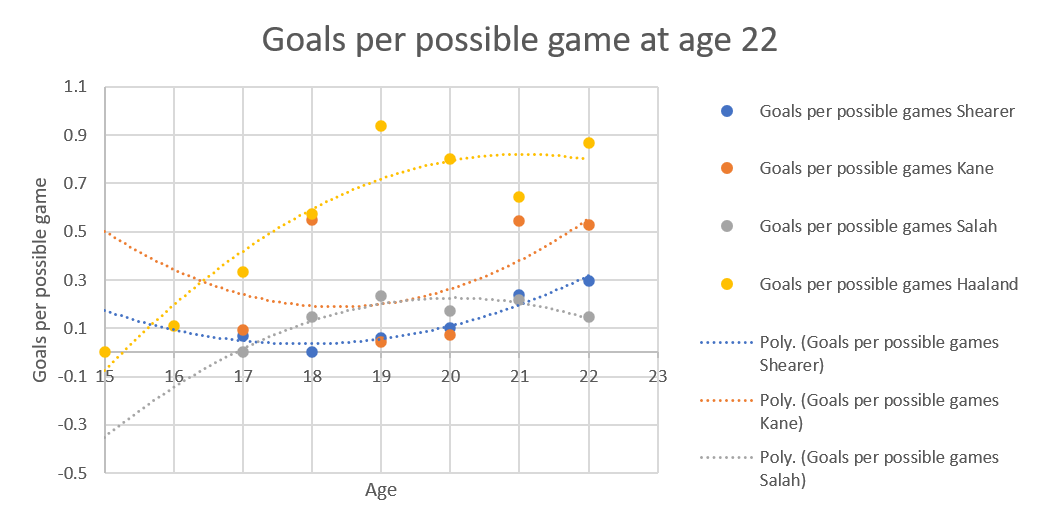
For goals per possible game, up to the oldest age all of them have achieved, we're back in the land of the banana curve, due to extrapolation.

Again, it's Kane and Shearer who are banana shaped, and Salah's goals per possible game is lower than everyone else's because he was still a winger.

Again, Haaland's is that shape due to a lack of data.


It'll be interesting to see the shape of his curve change next year.
No comments:
Post a Comment