Showing posts with label statistics. Show all posts

Friday, 23 February 2024

Haaland or Bug: Comparing Haaland's stats to Shearer, Kane and Salah

As promised in the update post comparing Shearer, Kane and Salah (https://fulltimesportsfan.wordpress.com/2024/02/14/the-king-his-heir-apparentand-the-pharaoh-waiting-in-the-wings-shearer-kane-and-salah-games-and-goals-per-season-updated-to-the-end-of-the-2022-2023-season/), here is what the the figures look like with Haaland added. 

I'd like to tip my hat to Ted Knutson (@mixedknuts on twitter, other microblogging platforms are available and I'm mostly at @kpfssport@mastodonapp.uk) for the concept of "something or bug", which came from the effect of that year that Burnley really outperformed expectations on Statsbomb’s analyses. Burnley’s data was so different to everyone else’s that after every analysis they had to check whether any outlier was a bug or just Burnley being Burnley. 

I strongly suspected that Erling Haaland's goalscoring stats would have that effect on my graphs but he had such a good first season in the Premiership that I couldn't really say no to L's suggestion when he said "why don't you add Haaland's stats to the analysis?". 

I was right to think Haaland's numbers were going to do terrible, terrible things to my graphs. 

First of all, he's so young that for actual data, there's only numbers up to age 22. For percentage of games played, that makes the data look wild. The percentage of games young players play varies so much depending on circumstance, things like depth of talent at their club, whether they've been loaned out to another club to get some seasoning, whether the coach wants to build them up slowly. So many variables, so it's really messy when you look at data from that age. Dot plot with the dots joined by dotted lines the same colour as the dots.  Blue dots are Alan Shearer,  orange are Harry Kane, silver is Mo Salah and yellow is Erling Haaland.  The Shearer curve starts at 0, rises to 53 percent at 21 and then drops to 50 percent at 22.  The Kane curve is upside down compared to the others because it starts high, at 68 percent, then drops to 40 percent at age 18 and then starts to rise again, finishing at 98 percent at 22.  The Salah curve starts at 0, reaches a maximum of 78 percent at 20, and then drops to 58 percent at 22.  The Haaland curve meanwhile is more of a steady rise, starting at 52 percent finishing at the highest point of 80 percent at 22.
That variability is most clearly seen in Kane's graph, which is upside down compared to the others. Because there's so little real data, the extrapolation in the graph to end of career, 35 years of age because that's when Shearer stopped, particularly effects Haaland's numbers. On the other hand, the extrapolation is needed because everyone's numbers go up after 22.   Dot plot with the dots joined by dotted lines the same colour as the dots.  Blue dots are Alan Shearer,  orange are Harry Kane, silver is Mo Salah and yellow is Erling Haaland.  The Shearer curve starts at 0, reaches a maximum of 86 percent at 31 then drops to 79 percent at 35.  The Kane curve starts at 20 percent, rises to a maximum of 89 percent between 29 and 30 years of age, then drops to 80 percent at 35.  The Salah curve starts at 15 percent, rises to a maximum of 93 percent between 27 and 28 years of age, then drops to 62 percent at 35.  The Haaland curve starts at 52 percent, rises to a predicted maximum of 82 percent at 24 and then drops to 40 percent at 35. 

I think that explains why Haaland's numbers drop so quickly in this graph and I think that'll steady itself with another year's data. I mean, according to this, his numbers max out at 24 and, barring injury (and may he be kept from those) that doesn't reflect footballing truth. 

The goals per game up to the oldest point all four players have reached is another one bent and mangled by lack of data. Dot plot with the dots joined by dotted lines the same colour as the dots.  Blue dots are Alan Shearer,  orange are Harry Kane, silver is Mo Salah and yellow is Erling Haaland.  The Shearer curve starts at 1.6 due to a nonsense of extrapolation.  It drops to a minimum of 0.1 goals per game at 19 then rises again to 1.75 at 22.  The Kane curve starts at 0.8, again due to extrapolation, reaches a minimum of 0.4 goals per game between 19 and 20, then rises to 0.55 goals per game by 22.  The Salah curve starts at 0.5, rises to a maximum of 0.4 at 20 then drops slightly to 0.3 at 22.  The Haaland curve starts at 0, reaches a maximum of 1.1 between 20 and 21, then drops slightly 1 goal per game at 22. That's two upside down curves versus two right way up curves, because of the extrapolation needed because Haaland started in the adult leagues earlier than the others. 

Also, this was all while Salah was still a winger, which explains his low numbers. 

On the other hand, you can imagine the nonsense extrapolation makes of Haaland's numbers if you send them forward to him being 35.

Behold, the nonsense:   Dot plot with the dots joined by dotted lines the same colour as the dots.  Blue dots are Alan Shearer,  orange are Harry Kane, silver is Mo Salah and yellow is Erling Haaland.  The Shearer curve starts at 0.6 goals per game, rises to a maximum of 0.6 goals per game at 27, then drops to 0.35 at 35.  The Kane curve starts at 0.19, rises to a maximum of 0.7 between 25 and 26, then drops to 0.26 at 35.  The Salah curve starts at 0, rises to a maximum of 0.6 at 30, then drops to 0.37 at 35.  The Haaland curve starts at 0, rises sharply to maximum of 1.05 between 20 and 21 then drops back to 0 by 26. According to the nonsense, Haaland stops scoring at 26. Again, may he be kept from injury, that is clear nonsense. 

For goals per possible game, up to the oldest age all of them have achieved, we're back in the land of the banana curve, due to extrapolation. Dot plot with the dots joined by dotted lines the same colour as the dots.  Blue dots are Alan Shearer,  orange are Harry Kane, silver is Mo Salah and yellow is Erling Haaland.  The Shearer curve starts at about 0.19, drops to a minimum of 0.05 at 20 years of age, then rises to 0.3 goals per possible game at 22.  The Kane curve starts at 0.5 goals per possible game, drops to a minimum of 0.2 between 18 and 19, then rises to 0.54 goals per game at 22.  The Salah curve starts at -0.35 goals per game, I blame extrapolation, then rises to a maxium of 0.21 at 20, then drops to 0.15 goals per possible game at 22.  The Haaland curve starts at -0.1 goals per possible game, rises to a maximum of 0.82 goals per possible game at 20 then drops slightly to 0.8 goals per possible game at 22. Again, it's Kane and Shearer who are banana shaped, and Salah's goals per possible game is lower than everyone else's because he was still a winger. Dot plot with the dots joined by dotted lines the same colour as the dots.  Blue dots are Alan Shearer,  orange are Harry Kane, silver is Mo Salah and yellow is Erling Haaland.  The Shearer curve starts at 0 goals per possible game, up to a maximum of 0.5 goals per possible game between 27 and 28, then drops to 0.29 goals per possible game at 35.  The Kane curve starts at 0, rises to a maximum of 0.58 goals per possible game between 26 and 27 and then drops to 0.28 at 25.  The Salah curve starts at 0, then rises to a maximum of just over 0.6 at 33 before dropping just below 0.6 goals per possible game at 35.  The Haaland curve starts at 0, before rising to a maximum of 0.83 at 21, before dropping like a stone to 0 at 27. Again, Haaland's is that shape due to a lack of data. 

It'll be interesting to see the shape of his curve change next year.

Wednesday, 14 February 2024

The King; his Heir Apparent…and The Pharaoh waiting in the wings

Shearer, Kane and Salah, games and goals per season, updated to the end of the 2022-2023 season 

In the first post in the series I compared the games per season, goals per game and goals per possible game for Alan Shearer, the Premier League's all time top scorer, and Harry Kane and Mo Salah, the two players who had the best change of beating his record back in 2021 when L first had the idea. 

At the end of the post, I suggested two bits of future work; to update the stats at the end of each season, and to then look at Erling Haaland's numbers in comparison. This post covers the first of those two bits of future work, a second one with Haaland's data is in the works. 

Comparing Shearer, Kane and Salah using data up to the end of the 2022-2023 season 

Looking at percentage of games played in only up to the point where all 3 players are 29, it looks like this. Dot plot with the dots joined by dotted lines the same colour as the dots.  Blue dots are Alan Shearer,  orange are Harry Kane and silver is Mo Salah.  The Shearer curve bends sharply to the lowest point of any of the three, stopping at 80 percent of games played.  His curve is pulled down by having played few games when he was 27.  The Salah curve has a very similar shape but stops at 85 percent.  The Kane curve is also a parabola but is still rising when he reaches 29.  At 29, his curve is at 90 percent. 

It's now the Salah and Shearer curves that are the most similar. 

Shearer's curve is being brought down by the ankle injury when he was 27, while Salah's is being brought down by the relatively lower percentage of games he played last season. Possibly because Tottenham Hotspur relied so much on him, so played him a lot, Kane's curve is not dropping. 

If we use all the data from Shearer's career, and then extrapolate from the data available for up to 29 years of age for Kane and 30 for Salah the curves look like this: Dot plot with the dots joined by dotted lines the same colour as the dots.  Blue dots are Alan Shearer,  orange are Harry Kane and silver is Mo Salah.  All three are parabolas.  The Shearer curve starts at 0 percent, reaches a maximum of about 85 percent at the age of 31, and then drops to about 79 percent at 35.  The Kane curve starts at 20 percent, reaches a maximum of about 90 percent at the age of 30 and then drops to 80 percent at 35.  The Salah curve starts at 14 or 15 percent, reaches a maximum of 92 or 93 percent between 27 and 28 years of age, and then drops to about 64 percent at 35. Salah's curve is really affected by the way the extrapolation handles the relatively few games he played at age 29, but the curve shape going forward is going to heavily depend on how many games he plays this year. 

Looking at goals per game, up to the age of 29, the curves look like this: Dot plot with the dots joined by dotted lines the same colour as the dots.  Blue dots are Alan Shearer,  orange are Harry Kane and silver is Mo Salah.  All three are parabolas, but the Salah curve is almost a straight line.  The Shearer curve starts at about -0.1 goals per game, reaches a maximum of about 0.62 goals per game at age 25, then drops to 0.56 goals per game at 29.  The Kane curve starts at about 0.19 goals per game, reaches a maximum of 0.7 goals per game at about age 26 and then drops to 0.61 goals per game at 29.  The Salah curve starts at -0.1, and is still increasing when it ends at 0.61 at 29 years of age. The three curves are very similar to last year's. Shearer's is still brought down by the limited number of goals he could score at the age of 27 when he had an ankle injury, but you can also see him recovering from that, and the goals per game rising back up again. 

The different shape of Salah's curve reflects him being repurposed from a winger to a striker, while the other two have always been out and out strikers. 

If we look at all the data, the curves look like this: Dot plot with the dots joined by dotted lines the same colour as the dots.  Blue dots are Alan Shearer,  orange are Harry Kane and silver is Mo Salah.  The Shearer curve starts at 0.5 to 0.6 goals per game, reaches a maximum of 0.61 goals per game at 27 years of age, and then ends at 0.35 goals per game at 35.  The Kane curve starts at 0.19 goals per game, reaches a maximum of 0.68 to 0.7 between 25 and 26, and ends at 0.27 at 35.  The Salah curve starts at 0, reaches a maximum of 0.61 between 30 and 31 and then drops to 0.56 at 35. Previously, the shape of the curves was really different, with Shearer and Kane having parabolas and Salah's being a steadily rising straight line. The relative drop off in goals per game in the last two years for Salah is probably what's bending his curve now. 

Salah's curve still doesn't drop as much as the other two, possibly reflecting the steady rise after he switched from winger to striker. Kane's numbers are hurt by the dip in goals per game at the age of 28. 

The goals per possible game metric was added to account for Shearer's Newcastle having fewer games so less likelihood of him being rested. Up to age 29, it looks like this. Dot plot with the dots joined by dotted lines the same colour as the dots.  Blue dots are Alan Shearer,  orange are Harry Kane and silver is Mo Salah.  The Shearer curve starts at -0.4 goals per possible game, reaches a maximum of 0.6 goals per possible game at 26, then drops to 0.48 goals per possible game at age 29.  The Kane curve starts at -0.05, rises to a maximum of 0.55 at 27, then drops slightly to 0.54 at 29.  The Salah curve starts at -0.1 and is still rising to 0.6 goals per game at the age of 29. Shearer and Kane's curves resemble each other, while Salah's is a completely different shape, again, an artefact of his role changing. 

If all the available data is used, it looks like this: Dot plot with the dots joined by dotted lines the same colour as the dots.  Blue dots are Alan Shearer,  orange are Harry Kane and silver is Mo Salah.  The Shearer curve starts at 0, rises to a maximum of 0.52 goals per possible game at 26 and then drops to 0.29 at 35.  The Kane curve starts at 0, rises to a maximum of 0.58 goals per possible game between 26 and 27 and then drops to 0.28 at 35.  The Salah curve starts at 0, rises to a maximum of 0.6 goals per possible game at 33 and then drops slightly by 35. This is one where there's been a major change, with Kane's curve no longer dropping like a stone, which it did last year (I still blame Antonio Conte). 

I think the changes show the value of continuing to look at this at the end of each season. Obviously a couple of things have happened this season which will affect these plots going forward; Kane moving to Bayern Munich and Salah missing some Liverpool games playing for Egypt at the African Cup of Nations. That hasn't affected Salah's numbers before but since he got injured, it may have a greater effect this time. 

Kane leaving for Bayern almost certainly means he won't break Shearer's record. I'll still look at his stats, because I've included Salah's Fiorentina spell in the stats, but I acknowledge it'll no longer be a direct comparison because of the difference between the English and German leagues. 

Salah is now the active Premiership player closest to Shearer's record, he's on 153 goals, while Shearer finished on 260. The next nearest active player on the list is Raheem Sterling on 120 goals.

Wednesday, 15 March 2023

Formula 1 - Did the fastest lap and sprint points make any difference in 2022?

Last year, I looked at whether the fastest lap points and sprint race points had any effect on the 2021 Championships. The answer was no, as it had been for the fastest lap points for the 10 years previous. I’m feeling decidedly justified in declaring them a gimmick. 

I would expect them to have had very little effect in 2022 either, not least because of the size of Red Bull’s victory margin.
The fastest lap points winners from 2022 can be found below.   2022-Fastest-Lap 
7 different drivers and 4 different constructors won fastest lap points which is in line with an average season. 

The final standings for the Constructors' Championships, with and without the fastest lap points. 2022-Constructors Removing the fastest lap points makes no change in the Constructors Title. 

How about in the Drivers's championship? 2022-Drivers Once again, the fastest lap points lead to no changes. 

That means if we put together the calculated total points if there had been fastest laps from 2009-2018, and the actual results in 2019, 2020, 2021, and 2022, 0 constructors results out of 149 have been affected by fastest lap points. 
In the drivers’ championship, the number of results affected is 11/327 (3.36% of all results), and none of those are in the top 3 of any given year. 

Let’s look at the sprint races, maybe they had an effect, especially with the extra points available in 2022, after the damp squib the sprint races had been in 2021. 

The sprint race points were as follows: 2022-Sprint-Points Because there were points available for more sprint race places in 2022, I've also made tables for which constructors and drivers got points. Sprint-races-2022-teams Sprint-races-2022-drivers 

Do the sprint race points have an effect on either championship? 2022-Constructors-sprint 
* and ¶ = teams whose positions swapped.
  2022-Drivers-sprint 
*, ¶ and § = drivers whose positions swapped. 

Giving points to almost half the field 3 times a year changes the position of 6 of the drivers. Only 2 of those drivers are really at the pointy end of the championship. 

So, what have we learned 
• The 1 point for fastest lap is too small to affect anything. I think that’s also why the top teams don’t really go for extra pitstops just to get it. 
• The increase in points for the sprint races in 2022 meant they did affect things. 
• But probably not enough to justify the extra time and effort 
• Plus it’s not like they actually produce more racing, either during the sprint or the main race 
• Help, I am agreeing with Christian Horner about something.

Wednesday, 15 February 2023

The King; his Heir Apparent...and The Pharaoh waiting in the wings - Shearer, Kane and Salah, games and goals per season.

This started as either a drunken conversation, a disagreement or a follow up to a Match of the Day stat. How vague my memory of parts of it is suggests one option above the others, but it has also been some time since the conversation happened which might also explain it. 

Some time ago, Harry Kane missed a couple of matches due to an ankle injury, again. The "again" was the problem. It had become clear that if Kane had a weakness, it was his ankle not his game. Cue L saying that the thing that would stop Kane reaching Alan Shearer's goal-scoring records would be injuries, because once you start having to miss games due to recurring injuries to the same body part, the number of games missed because of it is only going to increase. 

L wanted to know whether the games per season Kane played up to this point matched Shearer's or not. 

I raised an objection, which is that Kane, playing for a decent Spurs team, probably has more chance of playing more games than Shearer had while at Newcastle, because while every team plays the same number of league games, there's cups and European games to consider as well. (Shearer at Newcastle, excellent example of 'the things we do for love'.) 

So, it was agreed to calculate percentage of possible games played for Shearer and Kane. Alongside their stats, I was asked to include Mo Salah because he was scoring at a ridiculous rate and might have beaten Kane to any given record. 

I used TransferMarkt's data for all the players. 

When Kane was 27 and Salah was 28 the data looked like this - dotted lines are polynomial lines of best fit.
  Percentage-Predicted-27 Obviously, for Shearer (blue dots and dotted line) we had stats for his whole career. The noticeable thing is that even at the end of his career, he was playing in a high percentage of Newcastle's games (in his last year he played in 85% of Newcastle’s games), but this might have been because Newcastle really never had a replacement for Shearer ready at the time. 

There is a reason he has a statue outside of St. James's Park. Photo-2021-09-05-12-39-06 

For the other two, the dotted lines are predictions and the lines look pretty different. 

Let’s look at it if we only use the data up to the age of 27, the maximum age all had reached at that point. Percentage-up-to-27 
The curve for Shearer is heavily affected by his lack of games at the age of 27 (due to a long injury layoff). 

You can see Shearer's curve is a very different shape to the other two. 

At the start of this year, when there was an extra year's data, the percentage of games played with extrapolation looked like this: Percentage-Predicted-28 
You can see the addition of that extra year's data changes the shape of Kane's curve a lot. His curve was being brought down by one low percentage season. I don't think the difference is an artifact, because if you look at the shape of the curves from actual data, not extrapolated (below), the shape hasn't changed with the extra data. Percentage-up-to-28 
Okay so we have the data, but the point of a striker is to score goals, so how does goals per game look for the three? 

Looking to the projected stats at 27, they look like this: Goals-Predicted-27 The two lower blue dots for Alan Shearer, at 27 and 30 years, reflect the years he had his worst injuries, which does suggest that injuries also reduce potency as you come back. 

If we look at goals per game only up to 27, it looks like this: Goals-Per-Game-27 The really interesting thing is that Salah's curve has a completely different shape to the other two, possibly reflecting his change from winger to striker, whereas the other two have always been strikers.

After the figure was updated to include the data once Kane was 28 and Salah 29, the goals per game curve (predicted) looks like this: Goals-Predicted-28 The shape of the three curves is quite different, Salah's constantly increasing, Shearer's a parabola, but a fairly shallow one, while Kane's is a much sharper parabola. I'm not sure if that's because of low goals per game last season skewing the whole curve, that frankly ridiculous season he had at 18 or a side effect of Spurs playing him slightly deeper now. 

Looking only at data up to the age of 28 does suggest it's an effect of Kane's excellent year at 18, because in this view, his curve and Shearer's are very similar, while Salah's continue to show an increase, possibly due to him moving from wing to striker. Goals-Per-Game-28 

It makes sense to combine the two analyses and provide the goals per possible games, because yes, Shearer had fewer opportunities. On the other hand, it may make Kane and Salah's data look worse unfairly, given the modern tendency to squad rotation. 

The extrapolated version at 27 looks like this: Goals-per-possible-games-27 which is unexpected. I would have expected deleterious effects to hit Kane and Salah equally but Kane's curve really is warped by the poor year at 27. 

I think it's mostly the extrapolation going haywire, because if you look just up to 27 without it (below), Kane's curve and Shearer's again match. Salah's remains different (possibly reflecting that Klopp doesn't really do squad rotation). Goals-per-possible-games-27-data 

I updated this at the end of last season. The extrapolated curve from Kane being 28 and Salah being 29 looks like this: Goals-per-possible-games-predicted-28 While it could be Kane's production dropping precipitously, I think it's the extrapolation because the curves without extrapolation look like this: Goals-per-possible-games-28 Where can this go? Well, there are 3 possible future things I'm thinking of looking at. 

Going from most obvious to least obvious: 

1 - Yearly updates of this data, to find out a) how good the extrapolation was at predicting what will happen, b) find out if Liverpool's 'orrible year this year has any effect on that stunningly straight curve shape of Salah's, and c) see if the drop for Kane in the prediction is just a blip. 

2 - Include Wayne Rooney's data. He'd act as a nice control, retired player, whose position shifted from striker to something deeper. 

3 - Add Haaland. This is another suggestion from L. I don't think it's because he wants to drive me round the twist but I fear it's going to weird things to my graphs. 

@mixed_knuts for @statsbomb once gave a talk where he discussed the effect that year Burnley really outperformed expectations had on Statsbomb's analyses. Burnley's data was so different to everyone else's that after every analysis they had to check whether any outlier was a bug or just Burnley being Burnley. 

I think Haaland would cause the same thing. His goalscoring for his age is ridiculous. On the other hand, he's young enough there's no saying he'd be able to keep it up. That's the one advantage to the above comparison being Kane and Salah, they were already in the middle of their careers when I started it, there was a solid amount of data. Even from that, the very basic extrapolation done by Excel has problems fitting the data. I dread to think what it'll do to Haaland's data.

Thursday, 9 February 2023

Benford's Law - From February 2021 to the end of August 2021

I never actually drop projects, I just don't update them for a while. So let us return to the Benford's Law project, with information about the first digits in the top news article on the BBC website on 26 out of the 31 days of August 2021. 

In those 26 articles, there were 398 numbers with leading digits. That's ~ 15 per day, which about the same as June, but more than July. 

 Most of those numbers came from the article on the 8th of August (https://www.bbc.co.uk/sport/olympics/58112331) which was about the performance of different sports at the Tokyo Olympics compared to their funding. August-only 

No number appeared exactly as often as expected, 5 was the closest, but even that was 1% away from expected. 1 and 2 are the most different to their expected values, both are over-represented. 

If you add together the sum of all the values of (observed-expected)squared, all divided by the expected, the calculated test statistic is 8.5, the highest since February itself. 

The critical chi squared value for 9 items with only one line is ~ 15.507 The test statistic smaller than the critical value therefore the difference is not significant. This data does not disobey Benford's Law. 

If we look at the rolling total from February to the end of August, there have been 2258 numbers with leading digits. February-to-August 

No number exactly its expected value, 5 is the closest. 1 is the number furthest away from its expected value and remains over-represented. 

If you add together the sum of all the values of (observed-expected) squared, all divided by the expected, the calculated test statistic is 3.00, not reducing the way it should do with the addition of more first digits that obey Benford's Law. However, as the critical chi squared value for 9 items with only one line is ~ 15.507, the test statistic smaller than the critical value therefore the difference is not significant. This data does not disobey Benford’s Law. 

The test statistic continues to fluctuate rather than reduce which is interesting.

Wednesday, 20 April 2022

Benford's Law - From February 2021 to the end of July 2021

Today's post was supposed to be about cycling, and withdrawals from the Giro Rosa/Giro d'Italia Femminile compared to withdrawals in the men's Tour de France, but it requires more prose than I am presently capable of (running fencing competitions takes it out of you). 

Instead, let us return to an update to the Benford's Law project which has been chugging along in the background. 

In July, I recorded the first digits in the top news article on the BBC website on 25/31 days. In those 25 articles, there were 261 numbers with leading digits. That's 10-11 per day, which is a less than February but the same as March and May.

July numbers - 

  Azzeqb.png 

No number appeared exactly as often as expected, 8 was the closest, only 0.1% away from expected. 

1 and 7 are the most different to their expected values with 1 being over-represented and 7 under-represented. 

If you add together the sum of all the values of (observed-expected)squared, all divided by the expected, the calculated test statistic is 3.6, the lowest monthly total so far. 

The critical chi squared value for 9 items with only one line is ~ 15.507 The test statistic smaller than the critical value therefore the difference is not significant. This data does not disobey Benford's Law. 

If we look at the rolling total from February to the end of June, there have been 1860 numbers with leading digits.

Rolling total numbers

  Azz9IX.png 

No number exactly its expected value. 1 is the number furthest away from its expected value and remains over-represented. 

If you add together the sum of all the values of (observed-expected) squared, all divided by the expected, the calculated test statistic is 2.45, reducing as it should with more numbers. 

The critical chi squared value for 9 items with only one line is ~ 15.507 The test statistic smaller than the critical value therefore the difference is not significant. This data does not disobey Benford’s Law.

This is a reduction from the test statistic of the total to May, but it's not as low as it was in April.

Wednesday, 3 November 2021

Benford's Law - From February to the end of June

 In June, I recorded the first digits in the top news article on the BBC website on 24/30 days.  In those 24 articles, there were 353 numbers with leading digits.  That's 14-15 per day, which is a lot more than in March, April and May, but about the same as in February.

2 is appearing the expected percentage of times. 1 and 8 are the most different to their expected values with 1 being over-represented and 8 under-represented. If you add together the sum of all the values of (observed-expected)squared, all divided by the expected, the calculated test statistic is 4.9, the same as May.

The critical chi squared value for 9 items with only one line is ~ 15.507

The test statistic smaller than the critical value therefore the difference is not significant. This data does not disobey Benford's Law.

If we look at the rolling total from February to the end of June, there have been 1599 numbers with leading digits.


2 is exactly its expected value.  1 is the number furthest away from its expected value and remains over-represented, the next furthest away is 6 which is under-represented. If you add together the sum of all the values of (observed-expected) squared, all divided by the expected, the calculated test statistic is 2.71.

The critical chi squared value for 9 items with only one line is ~ 15.507

The test statistic smaller than the critical value therefore the difference is not significant. This data does not disobey Benford’s Law.

This is a reduction from the test statistic of the total to May, but it's not as low as it was before May.

Wednesday, 6 October 2021

Benford's Law Posts - Back From A Break With May's Results

This follows the three previous posts.

I was better at remembering to add the daily article in May, adding articles on 29 of 31 days.

Looking at May's articles only, 313 leading digit numbers were used (10-11 per day, slightly more than April, about the same as March and less than February).

3 is appearing the expected percentage of times. 1 and 7 are the most different to their expected values wth 1 being over-represented and 7 under-represented. If you add together the sum of all the values of (observed-expected)squared, all divided by the expected, the calculated test statistic is 6.67, slightly higher than April.

The critical chi squared value for 9 items with only one line is ~ 15.507

The test statistic smaller than the critical value therefore the difference is not significant. This data does not disobey Benford's Law.

If we look at the rolling total from February to the end of May, there have been 1254 numbers with leading digits.

2 and 3 are the numbers closest to their expected values. 1 is the number furthest away from its expected value and remains over-represented, the next furthest away is 6 which is under-represented. If you add together the sum of all the values of (observed-expected) squared, all divided by the expected, the calculated test statistic is 2.84.

The critical chi squared value for 9 items with only one line is ~ 15.507

The test statistic smaller than the critical value therefore the difference is not significant. This data does not disobey Benford’s Law.

Interestingly, as more numbers from articles added you would expect the calculated test statistic to reduce.  Previously, it has (February = 8.6, February + March = 3.49, February + March + April = 2.29), but the test statistic has increased this time to 2.84, possibly explained by the articles from the 1st, 7th and 8th of May being very skewed towards the number 1 and having a lot of numbers in them.

Thursday, 3 June 2021

Do April's lead articles obey Benford's Law? And how does the running total look?

This is the results of the third month of monitoring news articles for which numbers they contain.

I missed a couple more days in April, I blame Easter, and I will catch these up at the end of the year.

In the 27 days I did manage to capture, 232 numbers were used in the leading news articles on bbc.co.uk (~ 8 to 9 per day).  This is slightly less than the 9-10 in March and a lot less than the 15 per day from February.


9 is the number closest to its expected value.  2 is over-represented, 8 is under-represented. If you add together the sum of all the values of (observed-expected)squared, all divided by the expected, the calculated test statistic is 5.7.

The critical chi squared value for 9 items with only one line is ~ 15.507

The test statistic smaller than the critical value therefore the difference is not significant. This data does not disobey Benford's Law.

If you look at the rolling total of February to the end of April, the numbers are starting to add up.  Since the start of February, there have been 941 digits in headline news articles.


5 is the number closest to its expected value.  1 remains over-represented, while 6 is under-represented. If you add together the sum of all the values of (observed-expected)squared, all divided by the expected, the calculated test statistic is 2.29.

The critical chi squared value for 9 items with only one line is ~ 15.507

The test statistic smaller than the critical value therefore the difference is not significant. This data does not disobey Benford's Law.

Interestingly, as more numbers from articles have been added the calculated test statistic has reduced (February = 8.6, February + March = 3.49, February + March + April = 2.29).  This is what you would expect to see if the numbers in the articles fulfill Benford's law.

Wednesday, 28 April 2021

Do March's lead articles obey Benford's Law? And how does the running total look?

 This is the results of the second month of monitoring news articles for which numbers they contain.

March featured the first days I missed (I blame Easter), so I will have to add two days on at the end of the year.

In the 29 days I did manage to capture, 273 numbers were used (~ 9 to 10 per day).  This is less than the ~15 per day from February.


1 and 8 are the closest to expected.  5 is over-represented. If you add together the sum of all the values of (observed-expected)squared, all divided by the expected, the calculated test statistic is 5.6.

The critical chi squared value for 9 items with only one line is ~ 15.507

The test statistic smaller than the critical value therefore the difference is not significant. This data does not disobey Benford's Law.

If you look at the rolling total of February and March, the numbers are starting to add up.  There were 709 digits in headline news articles.


7 and 8 are the closest to expected.  1 remains over-represented, as it was in February. If you add together the sum of all the values of (observed-expected)squared, all divided by the expected, the calculated test statistic is 3.49.

The critical chi squared value for 9 items with only one line is ~ 15.507

The test statistic smaller than the critical value therefore the difference is not significant. This data does not disobey Benford's Law.

Interestingly, as more numbers from articles have been added the calculated test statistic has reduced (February = 8.6, February + March = 3.49).  This is what you would expect to see if the numbers in the articles fulfill Benford's law.

Wednesday, 7 April 2021

Do February's lead articles obey Benford's Law?

Benford's Law gains its power with larger numbers, and I started my Benford's law project in the shortest month.  I don't think these things through, do I?  But you have to start somewhere.

The 28 daily news articles contained 436 numbers written as digits (~15 per day).


3 and 7 are found pretty much exactly as often as expected.  1 is over represented.  

If you add together the sum of all the values of (observed-expected)squared, all divided by the expected, the calculated test statistic is 8.6.

The critical chi squared value for 9 items with only one line is ~ 15.507 

The test statistic smaller than the critical value therefore the difference is not significant.  This data does not disobey Benford's Law.*

*That noise is L shouting "obey is the word you want" but to me there's a difference between 'stats show x' and 'stats show not x' and to me, these show 'do not disobey'.

Wednesday, 17 March 2021

Obey Benford's - It's The Law (an introduction to my Benford's Law project)

Introduction:

Some years ago, I read the book, “How Long Is a Piece of String?: More Hidden Mathematics of Everyday Life by Rob Eastaway” (as reviewed here), and one chapter fascinated me.  The chapter was chapter 12 - “Is it a fake?”, and the section that particularly caught my interest was about Benford’s Law.  Excessively simplifying, in naturally occurring numbers, the leading digits will follow a distinct pattern, and will not be randomly distributed.

The expected % of leading numbers for each digit can be seen in the table below:

If you have a large naturally occurring data set that doesn’t conform to this, it tells you there are either constraints on it so that the data doesn’t cover all of the possibilities (e.g. human heights in m are will start with a 1 or a 2, no one has ever been 4 m tall) or something else is going on.

Testing this theory:

I wanted to test this out on *something*.  Problem was, what?  Most sports data is possibility-limited e.g. fewer goals will be scored in football the 9th or 9xths minute than would be scored in the 8th and 8xths minute, not because of the minute, but because the game stops at the 90th minute.  Other data isn’t big enough.  I needed a source of numbers that was large and unlimited.

Eventually, possibly in a fit of cynicism, I decided to try the leading digits of numbers reported in the news.  Advantages to this plan - I can use a single, traceable data source - one article a day from the BBC news website.  The BBC doesn’t tend to delete pages so if someone wanted to double check my numbers, I could give them the links.

Disadvantages to this plan - when I first attempted it, Article 50 was in the news, and skewing my results.

Having looked at the results, and realised this and a few methodological errors, and going a bit stir-crazy because of lockdown 3, I decided to try it again.

Attempt Number 2:

These were the rules I developed to try to avoid that and similar pitfalls:

1 - no numbers in names e.g. 19 in COVID-19 does not count as a leading digit

2 - no numbers from dates (I had done this originally, but worth restating)

3 - only digits written as digits.  This threw up an unexpected problem - the BBC has somewhat intermittent editorial control on whether digits under 10 are written as words or numbers, and this may skew results.  I’ve saved the links to the articles I’ve used to put the project together so I can go through them again if I want to (or if someone else wants to look at them).

I started on the 1st of February 2021, and will carry on till 1st of February 2022 (barring disaster).  The other advantage of this system is that if I miss a day, I can fill them in with more days at the end.  I will give monthly updates and running totals, plus some commentary if I have any.

Saturday, 23 January 2021

F1 Fastest Lap Points - Full of Speed and Fury, Signifying Nothing

 In 2019, Formula 1 introduced a bonus point for the driver who sets the fastest lap at each race (1 point for the driver, 1 point for the constructor).  They added some conditions, the point would only be given to a driver in the top 10 - if someone outside the top 10 sets the fastest lap, no point is awarded.  That struck me as unfair because it's down amongst the bottom half of the constructors’ championship where that extra point will count at the end of the season, especially when it comes to the money given to the teams.

That's part of the problem, the idea seemed to have been to encourage the teams to do something in the often dead last quarter of the race, when the interesting part of the race is over because the cars are too wide to allow overtaking at most tracks and there's no more pitstops to permit over/under cuts. Having cars come in for fresh tyres towards the end of the race to aim for the fastest lap point is supposed to increase interest, rather than being a bad sign that there's enough distance between cars to allow for a pitstop without a loss of place. But at the same time, they didn't want it to have too big an effect, because we'd never hear the end of it if someone won the World title purely because of fastest lap points.

Overall, I doubt adding fastest lap changes that much (and everyone knows how I feel about pointless changes) so I decided to go through the last 10 years’ worth of results (okay 11, because this happened in 2019, and I'm only writing this in 2020) and see if it does change anything. For 2009-2018, would adding fastest lap points change either the drivers’ or constructors’ standings at the end of the season, for 2019 and 2020, would removing them change anything. Because there'll be a lot of numbers, I'm putting them in separate posts and linking to them at various points.

Before anyone else says anything about them, yes there are caveats.  Before fastest lap points became a thing, drivers may not have bothered to go for fastest laps because they were worth nothing (except bragging rights, and bragging rights should never be underestimated), therefore it is a slightly artificial experiment.

The results

2009 (link to results here).  To no-one’s surprise, Mark Webber was one of the first drivers who wouldn’t have got a fastest lap because of finishing outside the top 10.  He finished outside the top 10 when he was fastest at the Japanese Grand Prix. The shock is that the perpetually cursed-with-bad-luck Webber was not the first person this happened to, no, that would have been Timo Glock at the European Grand Prix. Nine different drivers (ten if you want to count Glock) different drivers, driving for seven different constructors, would have gained points.

There would be no changes to the standings in the constructors’ title, and only 16th and 17th place would swap in the drivers’ standings.

For 2010 (link here), three races would have had no fastest lap point awarded.  Six different drivers (or seven counting Petrov who didn’t finish in the top 10 when he set the fastest lap at the Turkish Grand Prix) for four manufacturers would have received fastest lap points.  There would have been no changes to either the Drivers’ or Constructors’ Championship standings.

2011 (link here) would have been the first season that a fastest lap point would have been awarded at each grand prix, because all the people who set fastest laps finished in the top 10 of each particular race.  Six drivers for three teams would have won fastest lap points.  However, it would have had no effect on final standings.

2012 (link here) was much more of a mixed bag.  Four races would not have seen fastest lap points awarded because the person who set the fastest lap either didn’t finish in the top ten or didn’t finish at all.  Even with that, 8 drivers from 5 teams would have won fastest lap points (the unawarded ones raises that to 12 drivers and 7 teams).  This makes no difference to the Constructors’ Championship, but does cause a small movement in the Drivers’ Championship.  In the real world, Lewis Hamilton finished in 4th on 190 points, with Jenson Button finishing in 5th on 188 points.  In our counter-factual universe, where fastest lap points are awarded, Hamilton won none of these (the one race where he set a fastest lap, he did not finish), Button won two, and therefore, they are tied on 190 points.  It then goes to count back.  Both drivers won three races, but Button’s next best finish, 2nd, is better than Hamilton’s next best, 3rd.  Therefore, Button move into 4th and Hamilton is knocked down to 5th.

There are no changes due to the award of fastest lap point in 2013 (link here).  All but one race would have seen a point awarded (Esteban Gutierrez unluckily finishing in 11th at the Spanish Grand Prix).  Six drivers from five teams would have won fastest lap point (seven from six teams if Gutierrez had been luckier).  However, nothing would have changed in the Constructors’ or Drivers’ Championships.

2014, or the year of the silly attempt to add excitement by awarding double points.  (Is it really 6 years since I wrote about that nonsense?  I didn’t like it then, and I am glad they got rid of it.)  If fastest lap points had been awarded in 2014 according to the rules now in use, nothing would have changed with the final positions, 17 out of the 19 races would have seen points awarded, for 6 drivers from 4 teams. 

If points had been awarded to all drivers who set a fastest lap, regardless of final position, something would have changed. Kimi Räikkönen was one of the two drivers who set fastest laps, but would not have been awarded a point because he finished outside the top 10 (at the Monaco Grand Prix in his case). If he had been awarded a point, he would have leapt into 11th place in the drivers’ championship, ahead of Kevin Magnussen, but since the point wouldn’t have been awarded, this is another season where the fastest lap points would have changed nothing. Full details here.

Fewer drivers would have won fastest lap points in 2015 (link here), with only 5 drivers for 3 different teams setting fastest laps.  While this doesn’t change anything in the constructors’ championship, fastest lap points would have moved Daniel Ricciardo up to 7th place in the drivers’ championship, ahead of Daniil Kvyat.  With the addition of fastest lap points, Ricciardo and Kvyat would have the same number of points, and, although their best result is the same (one second place each), Ricciardo’s next best result is better than Kvyat’s next best result (a third place vs a fourth).

Two races in 2016 would not have seen points awarded, with Nico Hülkenberg missing out due to finishing 15th at the Chinese Grand Prix, and Fernando Alonso missing out due to finishing 14th at the Italian Grand Prix.  Fastest lap points would have been awarded to seven drivers from four teams (it would have been nine drivers from six teams if points were awarded no matter the finishing position).  There are no changes in the drivers’ or constructors’ championships, and the only thing the fastest lap point would have done would be to increase the gap between Rosberg and Hamilton at the end of the season.  Full details here.

Seven drivers would have received fastest lap points (it would have been eight but Sergio Perez finished in 13th at the Monaco Grand Prix), for four different constructors (would have been five if Perez had been given the point) in 2017.  There would have been no changes to the constructors’ or drivers’ championships (details here).

In the 2018 season, two races would not have seen points awarded, Valtteri Bottas finished in 14th at the Azerbaijan Grand Prix, while Kevin Magnussen finished in 18th at the Singapore Grand Prix.  Personally, I say if somehow, anyone manages to get a Haas to be the fastest car of a race, they ought to receive a point, but that’s not what the rules state.  Adding fastest laps does not change anything in the constructors’ Championship.  In the drivers’s championship, Bottas would have moved into 3rd from 5th, with Verstappen narrowly missing out on passing Räikkönen for what would now be 4th.  (Full details here)

This was the year where Force India had to reconstitute themselves mid-season.  Fastest lap points do not change either of their positions.  Obviously, if both “Force India”s points were added together, they race up the constructors’ championship but adding fastest lap points wouldn’t change that amalgamated table either.

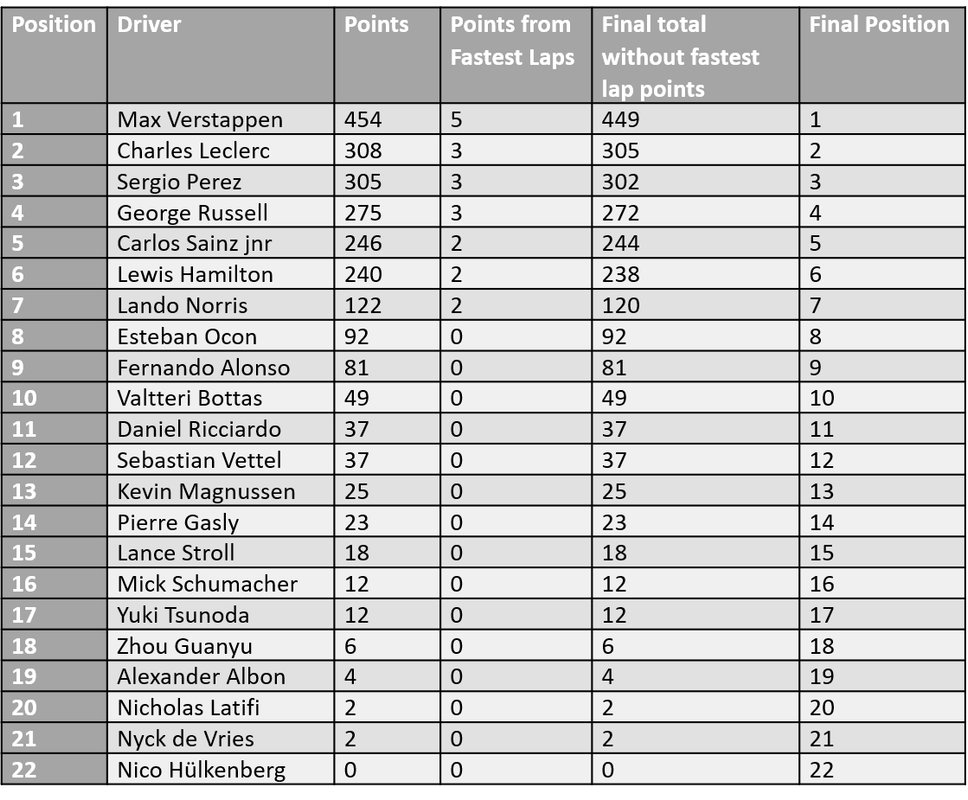
Now we come to the second half of this accidental natural experiment, 2019 and 2020, years in which fastest lap points were awarded.  For these two seasons the question is, will positions change with fastest lap points removed.

2019 – Six drivers from three teams won fastest lap points, both members of the three big teams.  Two races didn’t see fastest lap points, because Kevin Magnussen finished in 17th at the Singapore Grand Prix and Bottas DNF at the Brazilian Grand Prix.  Again, I would like to state my policy that if anyone manages to get a Haas to be the fastest car of a race, they ought to receive a point (although giving Magnussen that point wouldn’t have changed anything in the drivers’ championship).  (Details here)

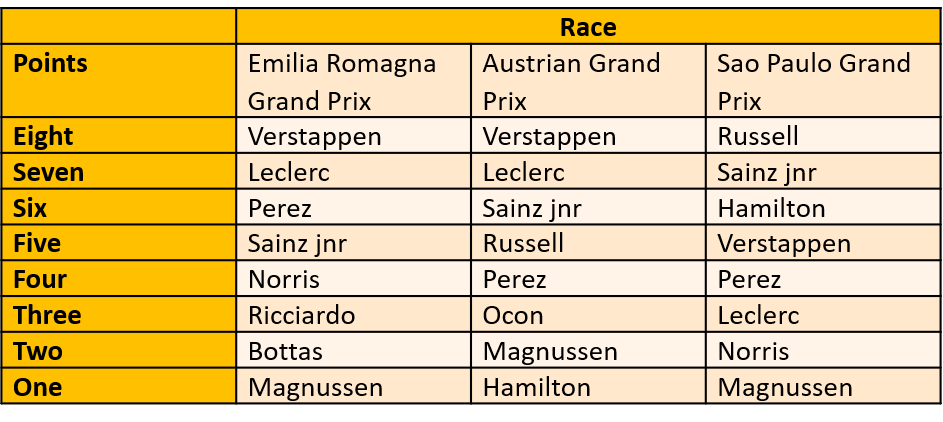
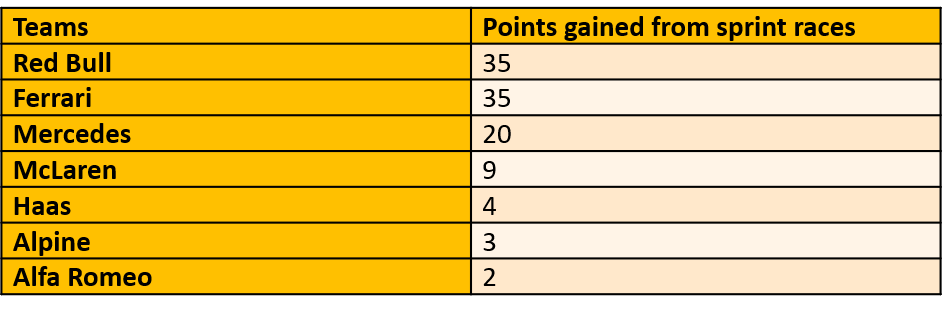
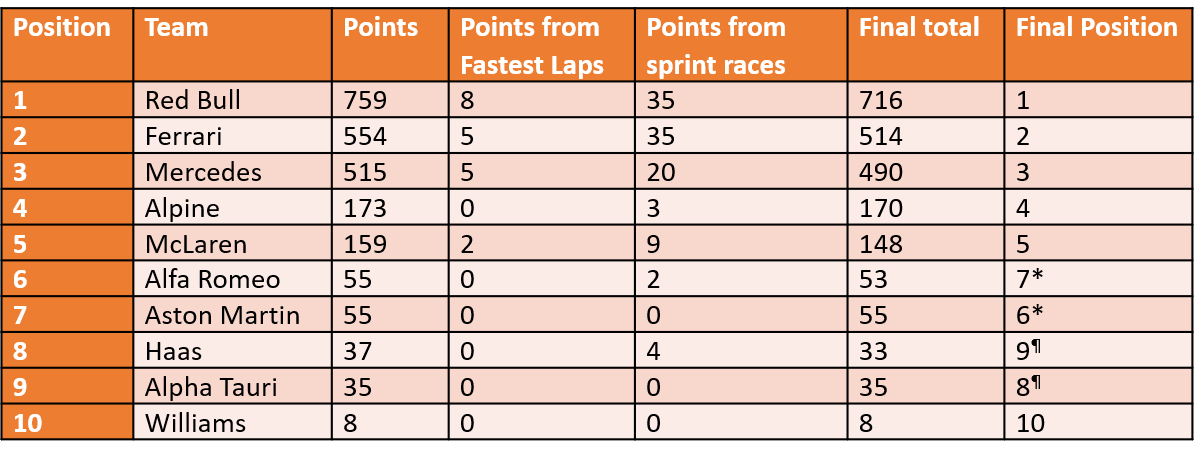
2020 was a weird season in a weird year.  Fastest driver points were awarded in all 17 Grand Prix.  They were awarded to 7 drivers across 4 teams (details here).  Removing fastest lap points makes no difference to the Constructor’s title (don’t look at the constructors table, it is a thing of horror for all Ferrari fans).  In the Drivers’s championship, removal of the fastest lap points would move Albon ahead of Carlos Sainz jnr, but I am not sure that would have saved his seat, Red Bull being what they are.

Conclusion:

So, what have we established? At no point did adding or removing fastest lap points change the standings in the Constructors’ Championship.

0/129 placings.

0%.

Zero.

Zulu. Echo. Romeo. Oscar.

[add in other languages, as applicable]

This established, let's look at the Drivers’ Championship: 11 drivers would have changed the finishing position with the addition or removal of fastest lap points (11/284 = 3.9%).

However, none of these changes would affect who won the title, and since I’m not party to individual contracts; I don’t know if anyone would have made some extra money or if anyone missed out on some cash.

Mostly, this has been a change that affected nothing, but why is this? Partly it’s the small size of the “fastest lap bonus”: a single point compared to the 25 points for a win.

I think they made it deliberately small so it wouldn’t affect the big things like the Drivers’ championship, but it’s so small that it doesn’t affect anything in the Constructors Standings (where money is more obviously at stake).

While I disapprove of change for change's sake; I don’t think those in charge will get rid of the fastest lap point in the short term because it gives the appearance of excitement, gives the commentators something to talk about in the dead space after the pitstops.

I’d rather they tweak the rules to give spectators more exciting racing; but I don’t think I’m getting that any time soon either.
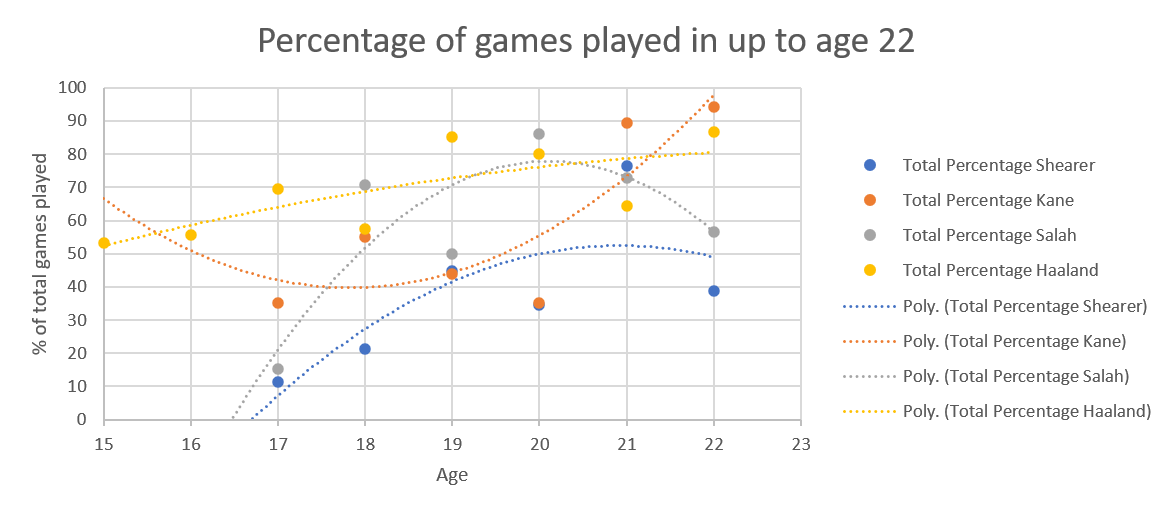
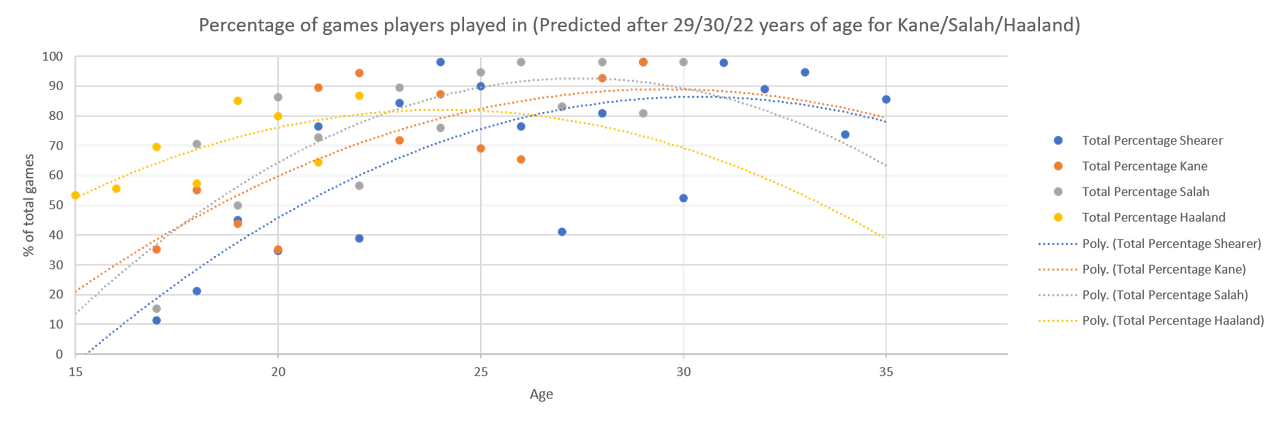
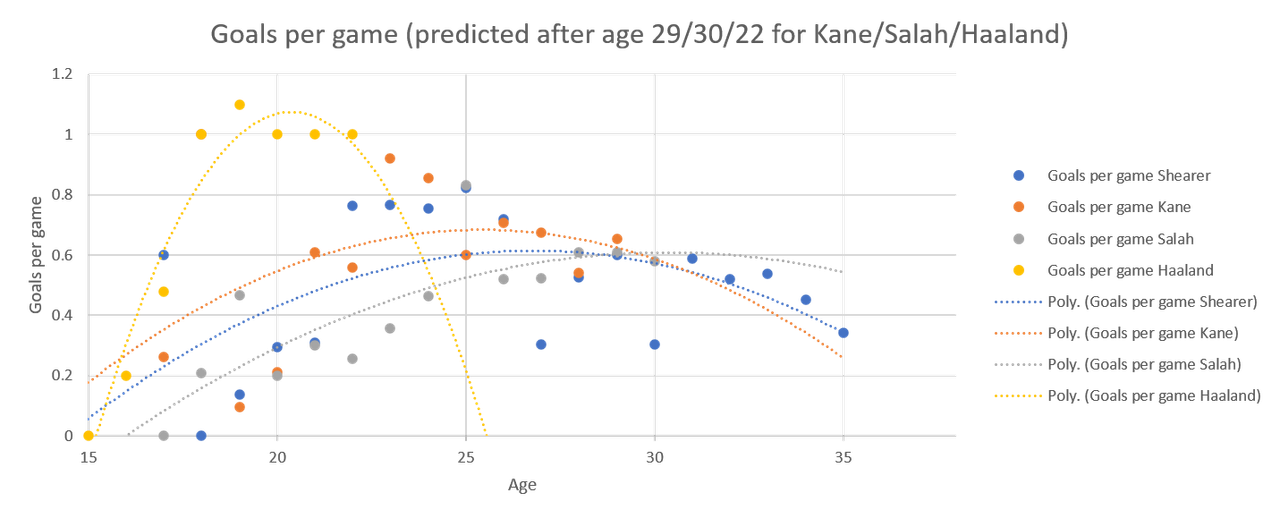
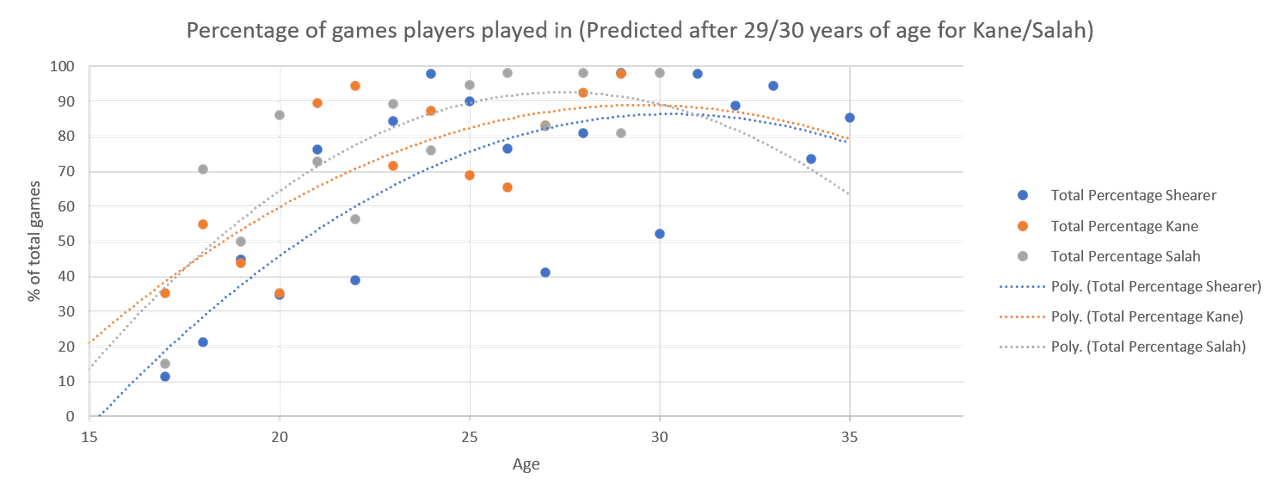
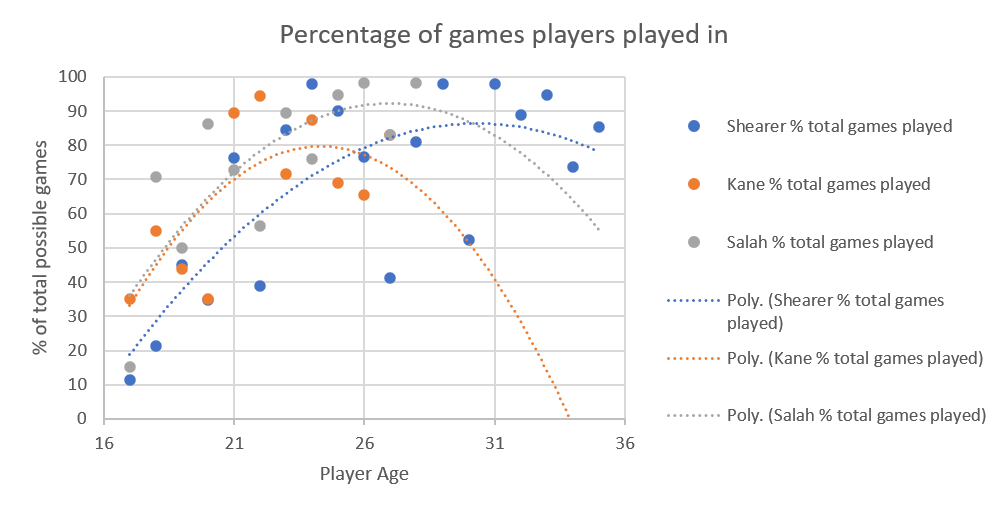
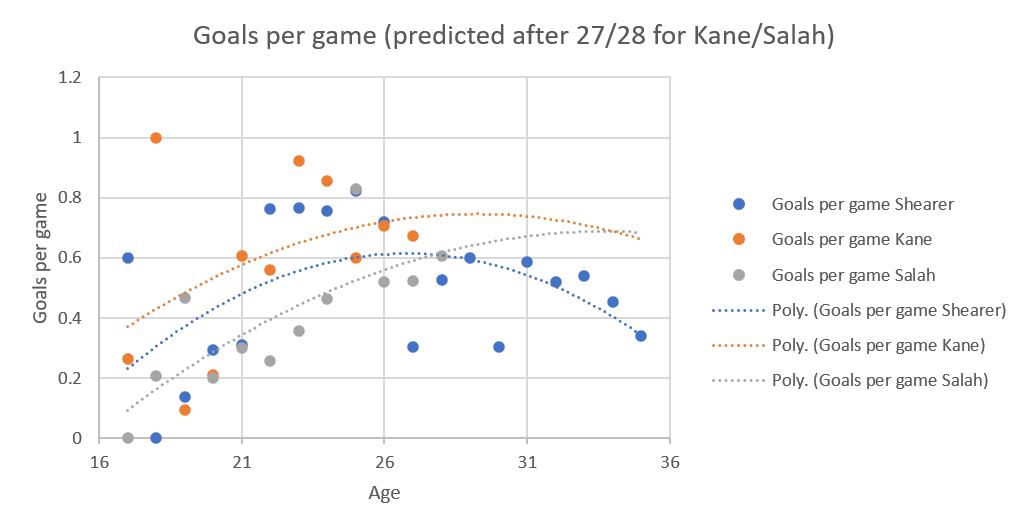
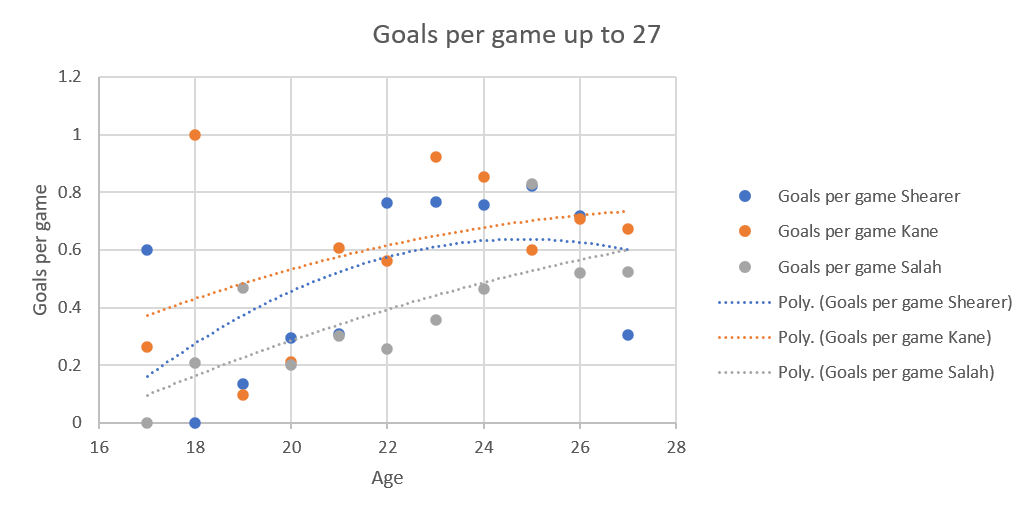
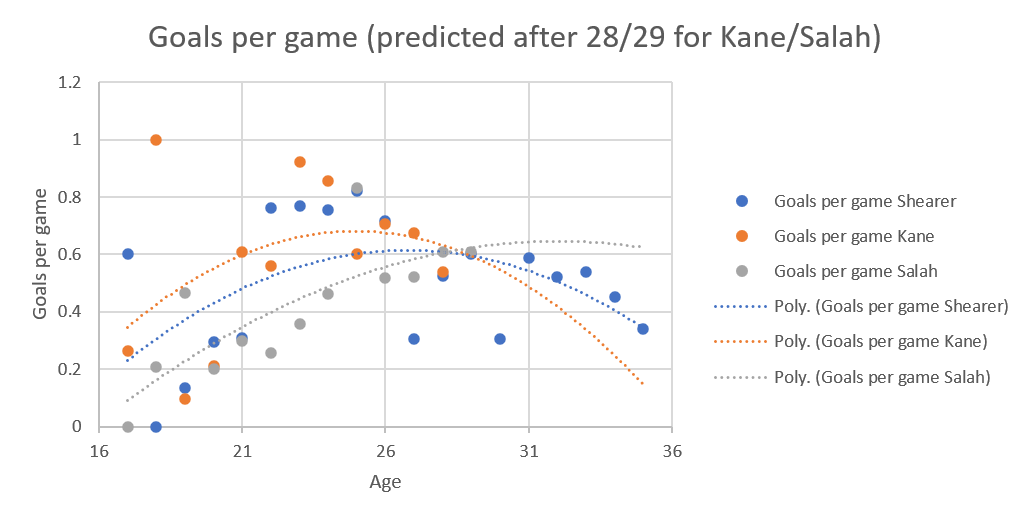
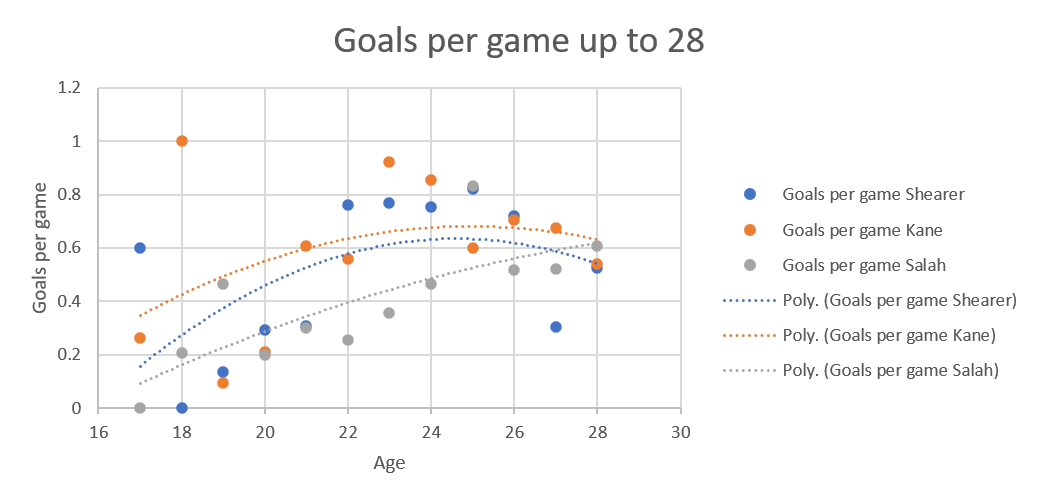
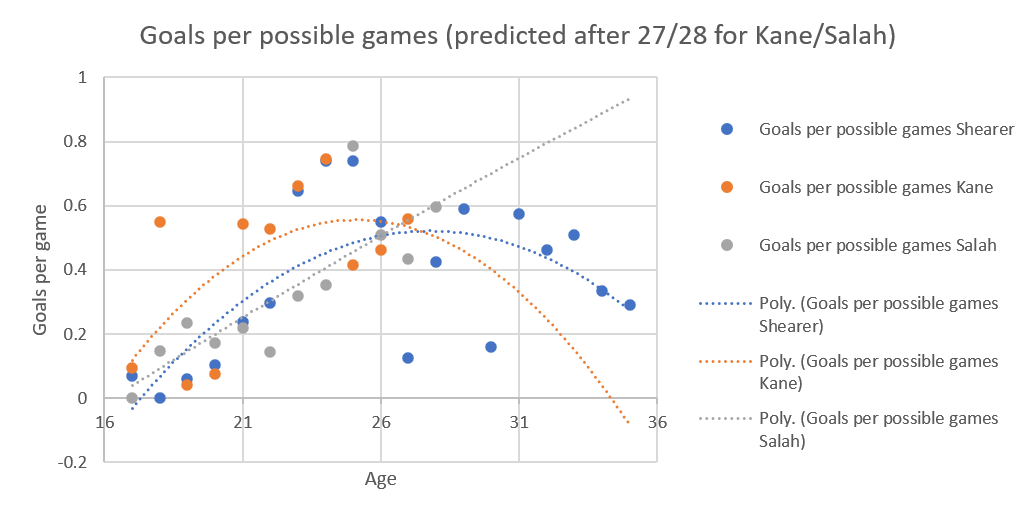
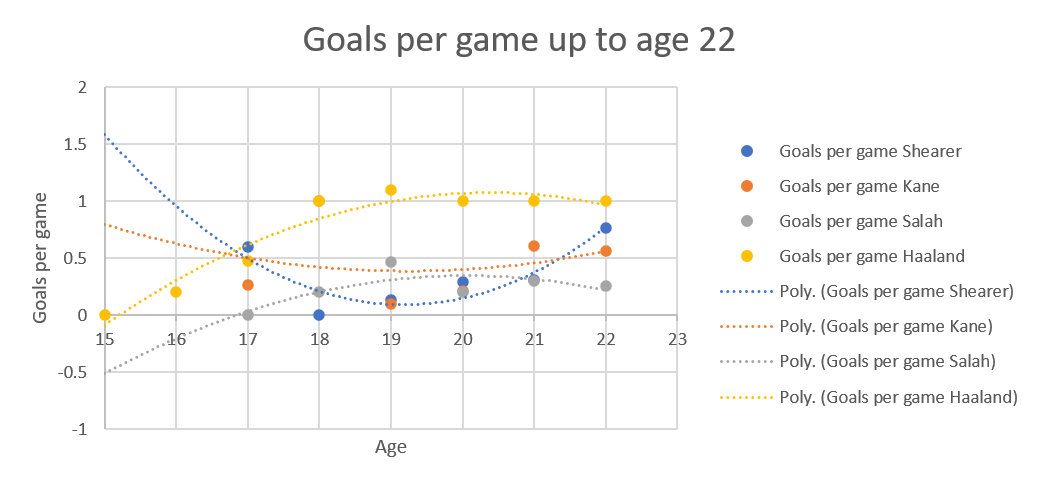
Saturday, 21 November 2015

In which I am willing to admit I was wrong about a factoid

The original factoid was "NFL salary capped teams would, adjusted for inflation, RELATIVE terms, be in the bottom 4 of the premier league".  Now the friend who said it did admit he couldn't remember where he'd heard it but the whole proposition sounded dubious anyway.

Obviously I try to be a little more reasonable than 'that doesn't sound right' so I've been ferreting away to prove the factoid is incorrect.

First, it does not compare like with like.  The NFL and the Premier League operate in very different ways.  The NFL has a salary cap and no promotion and relegation.  The Premier League has no salary cap, promotion and relegation, and has to compete for players with other equivalent leagues, primarily in Europe.  When a player is transferred between NFL teams, it tends to be for other players and draft picks, not for money.  When a player is transferred between football teams, it tends to be for cold, hard cash.

As a general rule, if someone's making an analogy that involves an apple and an orange being the same thing, and they don't caveat it like crazy, then they're being disingenuous at best.  So I presumed the factoid was wrong.

I was able to scare up some data, but it's the most complete set is not that recent (2011), so the following might no longer be an accurate reflection, particularly in the case of the Premier League where the new TV deal has meant teams going a bit crazy on the spending front.

The 2011 NFL Salary Cap was $120 million (£78 million).  This is for a 53 player team so we'll call that $2.26 million (£1.47 million) per player on average.

According to this website, the average take home pay for a Premier League player was $2.71 million (£1.76 m), so yes that is more, and I think this is where the factoid comes from.

However, that's an average, and for the factoid to be correct, even the NFL team paying the most for its players would have to be paying less than the average Premier League team.

According to ESPN, in 2011, the team with the highest salary cap was the Dallas Cowboys with $136.6 million (88.65 million) or $2.58 m (£1.67 million).

So I was wrong, and the average wage is indeed higher for Premier League teams.  I can't prove all of the factoid because I don't have an average wage breakdown by team for 2011 so there's no way of telling what the bottom four Premier League teams were paying, but from these numbers, it wouldn't surprise me.

* All currency conversion is done using the $1 : £0.649 ratio given as the average exchange rate for 2011 by the IRS.

Saturday, 21 June 2014

World Cup 2014 Group Stages Interconnectivity Diagram

These are as correct as wikipedia can manage.  All players have been shown as playing for the team for which they last made an appearance, so, for instance, Joel Campbell is shown as an Olympiacos player, even though he is only on loan for them from Arsenal.

The clubs with the most players are, oddly enough, Bayern Munich and Manchester United with 14 players each.  I say oddly because, well Bayern did well this season, but United really didn't.  The United players are from a wide spread of countries (4 from England, 2 from Spain and Belgium and 1 each for Mexico, Holland, Japan, Ecuador, France and Portugal), while Bayern had 7 from Germany, and 1 each from Brazil, Croatia, Holland, Spain, Switzerland, US and Belgium.

Each team has at least one team member playing in that country.  All countries except England and Russia have at least 1 player playing for a foreign club.  This leads to a very tight diagram, particularly in the middle.

The graph is a lot more cluttered that the Euro 2012 equivalent (http://fulltimesportsfan.blogspot.co.uk/2012/06/finalised-diagram.html), possibly because there's a lot more teams, and possibly because teams in Spain and Italy (for example) have a lot more foreign players from South America and Africa than they do from other parts of Europe.

The communities view is too confused to interpret, because as well as the countries themselves, the clubs with lot of players represented appear as communities in and of themselves.

Friday, 29 June 2012

Euro 2012 Final

So we're down to 2 teams, and I think it's hats off to the Spanish newspapers who predicted this after the match in the group stages.

Barcelona now contribute the most players, 7, all of whom play for Spain.  Juventus and Real Madrid come next with 6 each.  The only team guaranteed to have a player on the winning side is Manchester City.

Monday, 25 June 2012

Semi Final Time

Thankfully there was only one game that went to penalties.  I know they're probably the least worst method, but that doesn't mean I have to like them.

Semi-final diagram -

It makes sense that Portugal and Spain are locked together, while Germany and Italy hang off the centre, given the number of Portuguese players that play in Spain, and how most of Germany and Italy's players play in the league of their home nation.  Real Madrid still contribute the most players (10).

If you view the diagram as communities, they are Italy, Spain, Germany, Portugal, Real Madrid and Athletico Madrid.  Why the last one I do not know.