The effect was stronger for the England rugby league team than the union team because, I think, Shaun Wane didn't have his chosen playmaker suspended for 3/7 games, and because he had a much clearer idea of who his first team were than Steve Borthwick did.
Taking these two ideas together, I thought, why not follow a rugby league team through their season and see what the data shows?
My beloved Saints were an obvious choice.
Then I realised that, while nrl.com has all the information I could possible need, the Super League's website doesn't even have match reports.
Cue sad me scrabbling for a replacement team, and hitting on St. George Illawarra, who have both a similar name and a similar jersey. They were a decent replacement.
I was checking in on St. Helens's first game of the season on twitter (https://twitter.com/Saints1890) and realised that the twitter feed normally has most of the information I need. And then I remembered that my beloved Saints use that feed to do the "as it happened" section of their match reports (example from the first match of the year here - https://www.saintsrlfc.com/matches/2024/first-team/saints-v-london-broncos-2024-02-16/) so I don't even need to do it live or almost live.
I love Saints so much.
Game 1:
Saints' first game was against the London Broncos, who were promoted to the Super League at the end of the 2023 season.
You can read match reports here - https://www.saintsrlfc.com/matches/2024/first-team/saints-v-london-broncos-2024-02-16/ or https://www.bbc.co.uk/sport/rugby-league/68304742 depending if you want "focussed on Saints" or "more evenly interested in both teams".
I am with the section of fans pleased with the result and performance given it was the first match of the season, but concerned about the number of missed conversions. When Saints play stronger teams, dropping points like that could hurt Saints.
As London only scored four points, I'm not showing the "players on the pitch when Saints conceded points" diagrams. (Although, from a fan's perspective, well played on defence Saints :) )
The "players on the pitch when Saints scored" is already quite interesting after only one game, because you can already see the cluster of players who play lots of minutes and the prop combinations that play together:
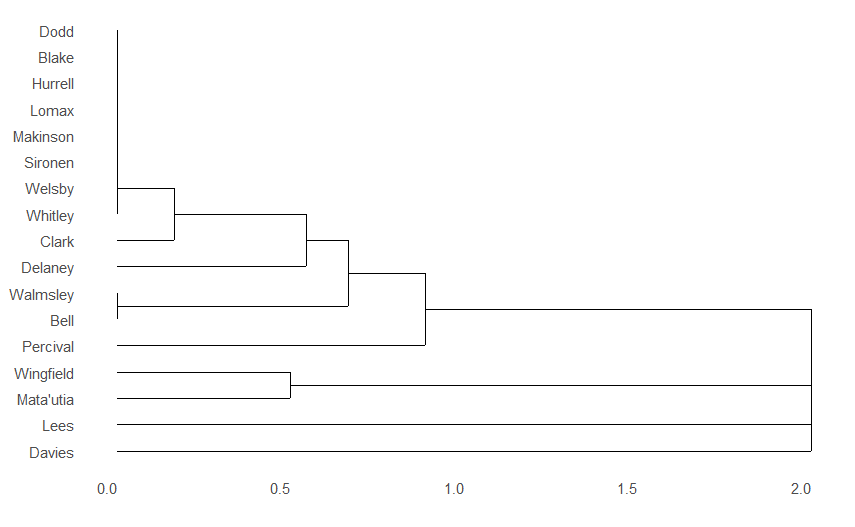
The paler squares in the next diagram indicate players who weren't on the pitch together when Saints scored, suggesting they don't play together.
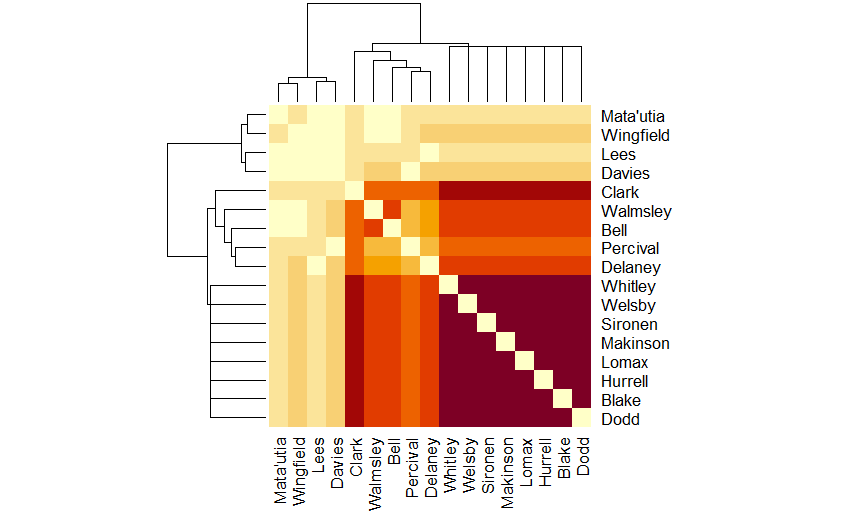
From this it looks like Walmsley and Bell didn't play at the same time as Wingfield and Mata'utia, suggesting Wingfield and Mata'utia are the other prop line.
Percival has a lighter line than those around him because he was taken off early. I am entirely on team "wrap him in cotton wool once the match is won".
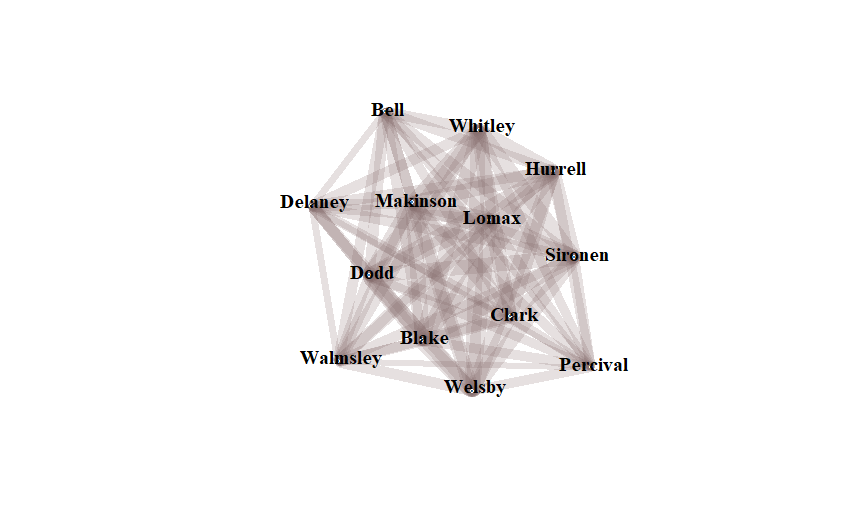
The network diagram already shows 13 players who play together when Saints score. They wouldn't be a bad first 13:
The "when the players were on the pitch" diagram highlights one interesting thing:
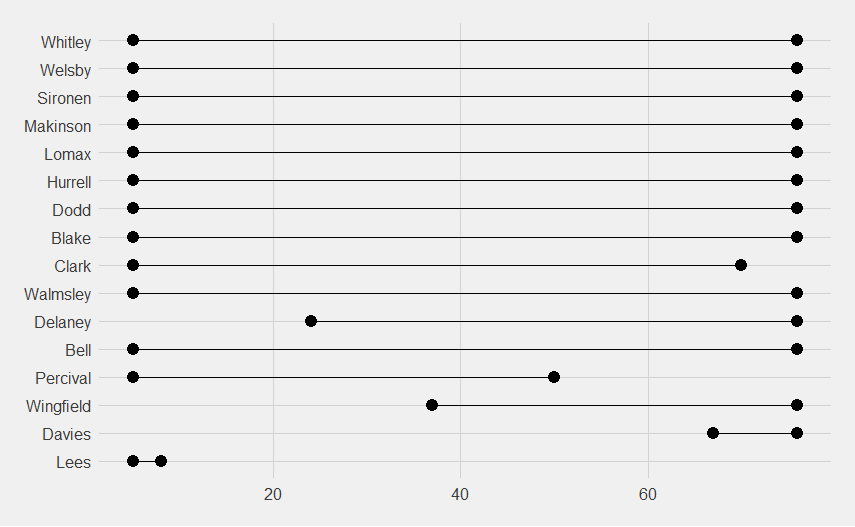
Matty Lees got taken off early on and did not come back on. I haven't seen anything about him being injured so that's odd.
Looking forward to doing this for the rest of the season. Each post is likely to be "figures for that game" and "figures for the season up to the end of that game."
No comments:
Post a Comment