The game highlights one of the problems England face. They can beat the French, and beat them handily (Match report here), but against the stronger teams, they just don't seem to gel.
Like in 2023, yes, they beat a touring Tonga team (who were without several of their players), but it wasn't anything like convincing, and yes, that was under a different coach but I don't blame Wane for it.
There needs to be more regular international rugby league to allow England to get any better (also Lebanon, France, Ireland, Scotland etc).
McDermott appears to have come around on the topic of Jez Litten, but not quite sure why you'd suddenly swap Ashton for Eckersley after you'd trusted Eckersley against Tonga.
Data visualisation:
For the data visualisation, I've only done the cumulative charts. This is partly because half the game 2 charts would have been blank because France didn't score, and because the thrust of the project is the developments game to game.
When do England score?
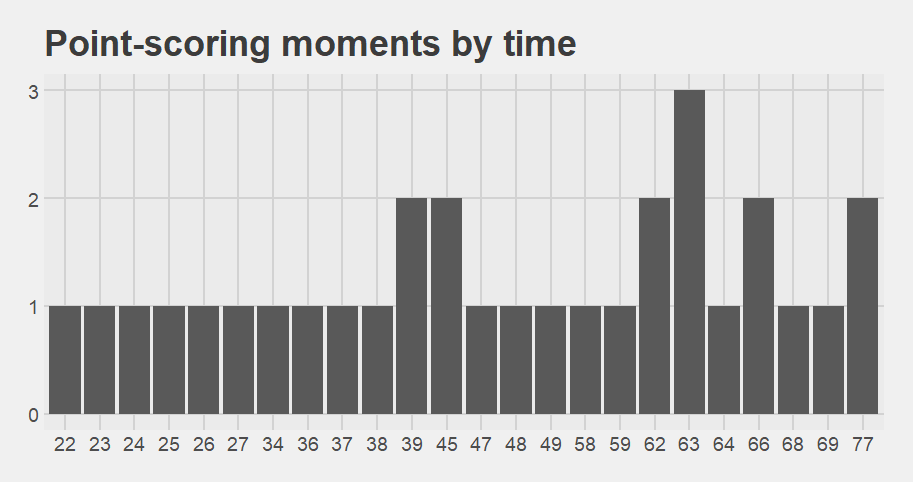
Even against France, it took England 22 minutes to score. Obviously, they won the game handily, and you have to wear all oppositions down but it does suggest a certain lack of oomph.
Who scores for England?
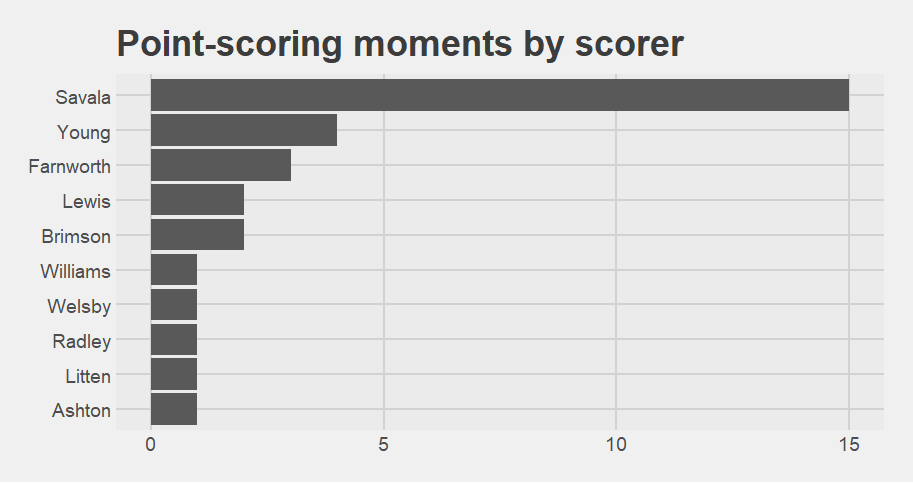
Savala being the player who has the most point-scoring moments makes sense, because he's the kicker. Dom Young being in second place shows that giving him the ball is a good idea. Let Dom Young do the thing he's best at.
The France game really skews the "which players are on the pitch when England score?" line chart over time, but you can see which players England use as impact subs.
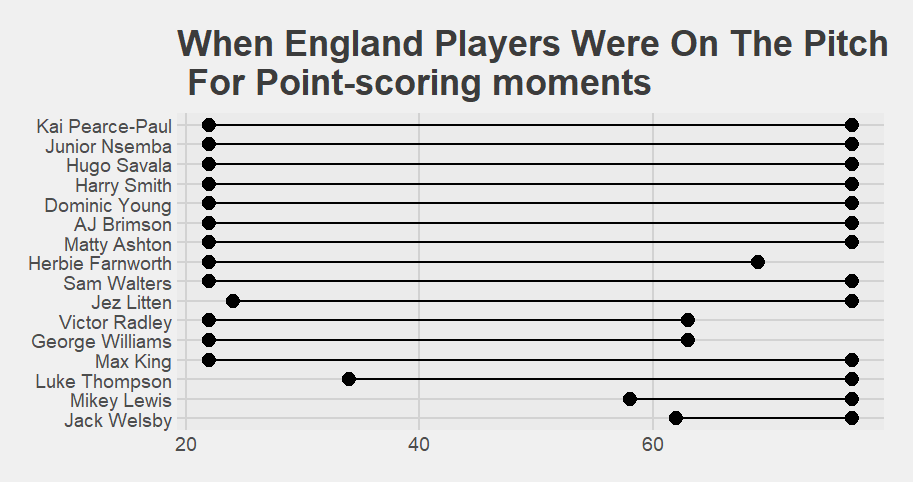
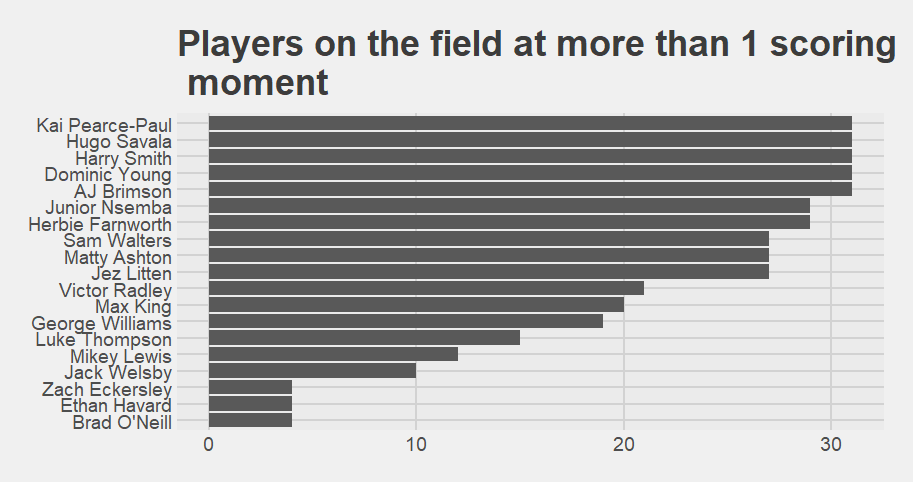
Pearce-Paul, Savala, Smith, Young and Brimson are obviously McDermott's chosen core, with Ashton having taken over from Eckersley on the wing. Not sure why he didn't play Havard against France, but England do have sufficient forwards that it's not that weird.
The who plays together when England score matrix graph also shows pattern.
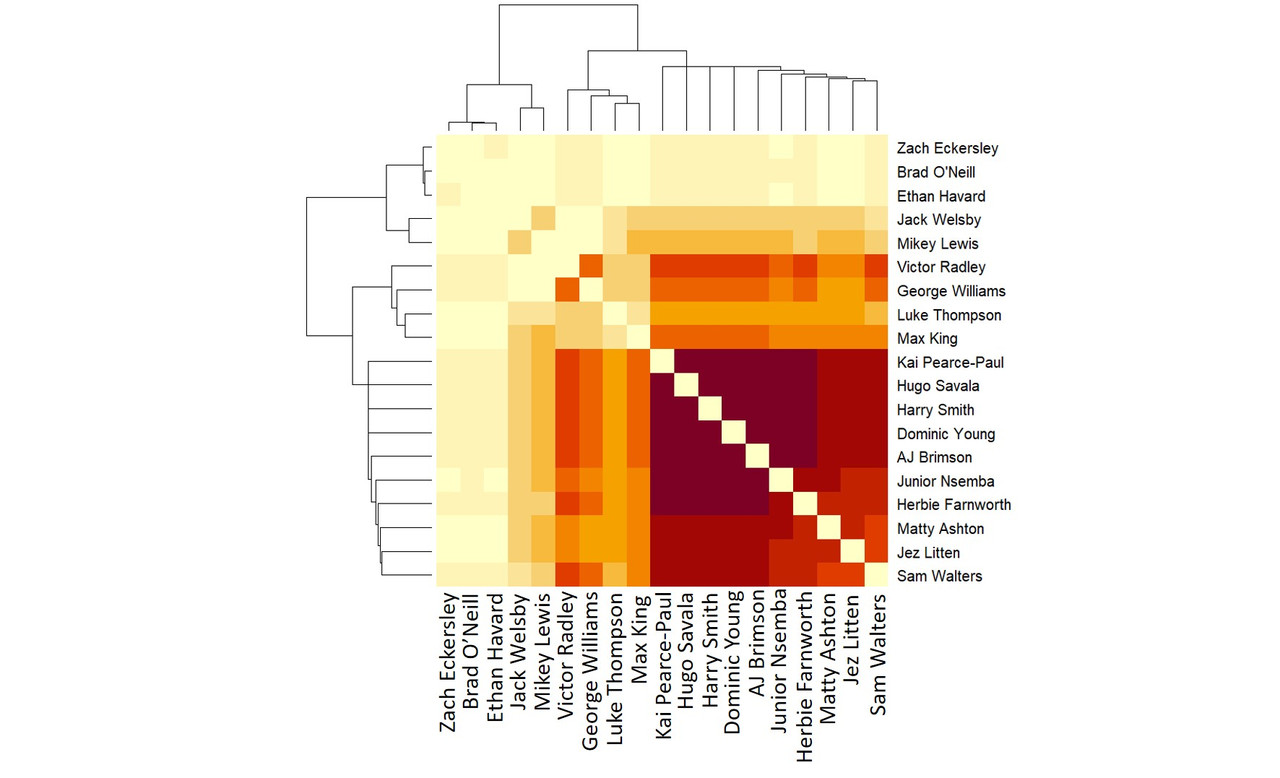 Because there were a number of changes in the squad between the two games, and because there were far more point-scoring moments in the game against France, the matrix has developed an interesting shape.
 Eckersley, O'Neill and Havard are consigned to the pale, not-often-on-the-pitch-together-when-England-score section.
There's a shade of darker yellows to mid orange, these are the players that played more of a role in one game or the other (skewed, as I said, by more point-scoring moments in the France game) - they are Welsby, Lewis, Radley, Williams, Thompson, King.
Radley, although he's in the middle of this group is the darkest orange line, possibly because he played quite a bit in both games, while Welsby and Lewis didn't play in the Tonga game.
Then we have the next darkest section, a tomato ketchup red, with Ashton, Litten and Walters. Ashton only played in the France game, Litten played in both but only 20 minutes of the Tonga game, but Walters played in both.
The darkest section, a deep red wine sort of colour, is those players who played large parts in both matches. They are Pearce-Paul, Savala, Smith, Young and Brimson, who seem to be McDermott's core group, plus whichever other winger he picks and a hooker.
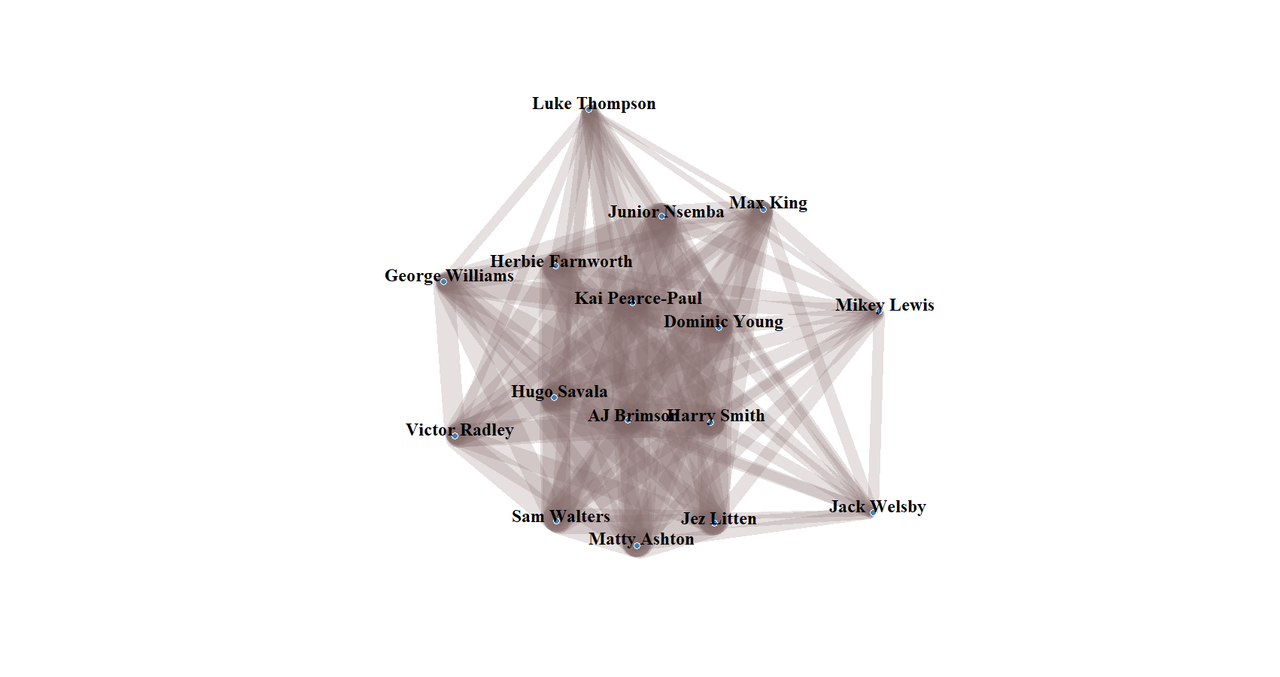
That's also reflected in the network graph, which there are now enough data points for:
England's hopes rest on the Tonga vs Samoa game which was always one of my picks for most interesting match of the group stage.

No comments:
Post a Comment