The Monaco Grand Prix itself:
 Even without the dashed lines showing where 2 standardised residuals are (the point where the results probably become significant), you can see that with an χ² of 1.12, the number of times the cars have been tested is really close to expected.
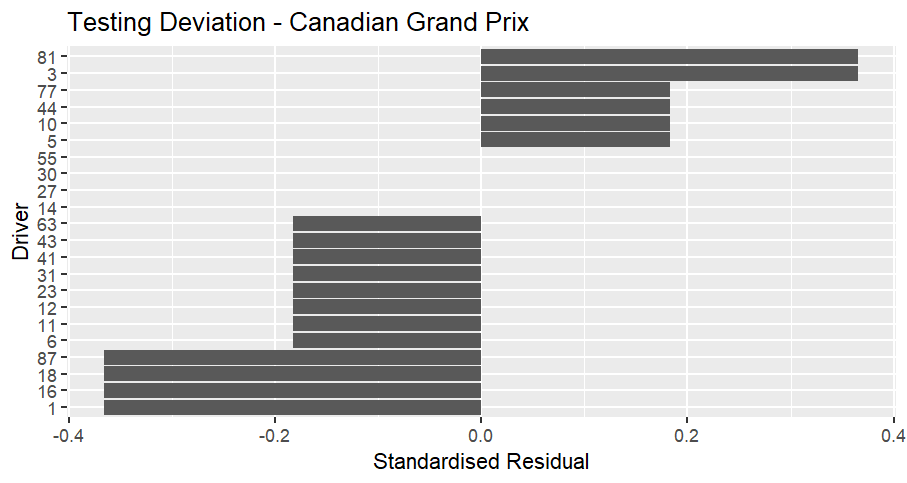
Even without the dashed lines showing where 2 standardised residuals are (the point where the results probably become significant), you can see that with an χ² of 1.12, the number of times the cars have been tested is really close to expected. This is highlighted by 4 out 22 cars (or around 18%) having been tested exactly as much as expected. Those cars are cars 14 (Alonso), 27 (Hulkenberg), 30 (Lawson) and 55 (Sainz jnr).
Even the largest deviations are tiny. Cars 3 (Verstappen) and 81 (Piastri) are the most over-scrutinized compared to expected with a value of 0.37. Cars 1 (Norris), 16 (Leclerc), 18 (Stroll) and 87 (Bearman) are the most under-scrutinized compared to expected with a value of -0.37.
The season to date:
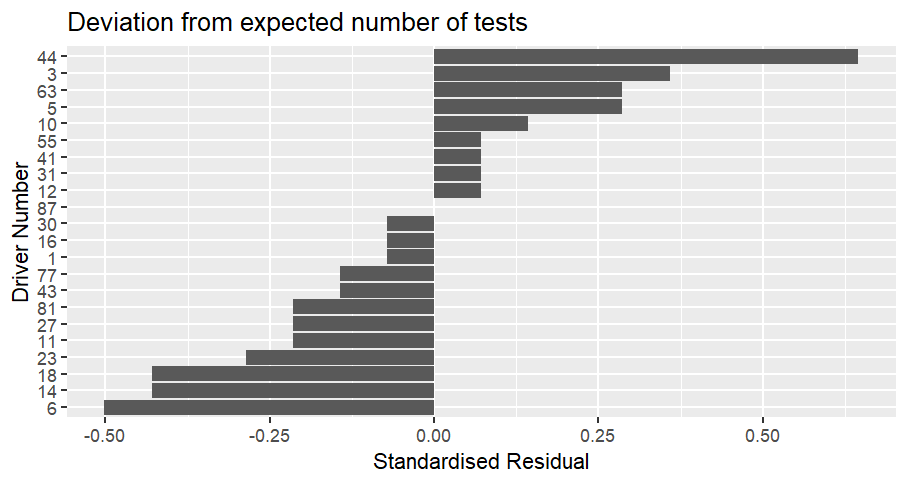
Car 44 (Hamilton) is the most over-scrutinized compared to expected, with a value of 0.64. He is followed by car 3 (Verstappen), who has a value of 0.36, then cars 5 (Bortoleto) and 63 (Russell) with a value of 0.29.
Car 6 (Hadjar) is the most under-scrutinized compared to expected with a value of -0.5, followed by cars 14 (Alonso) and 18 (Stroll) on -0.43.
The rest make sense because they are either doing well (Hamilton, Verstappen and Russell) or have disaster cars (Alonso and Stroll) but Hadjar makes no sense because he's done well, and I'm not sure why Bortoleto has been tested so much because he's only had one top 10 finish.
Somehow, Bearman has been tested the exact number of expected times with 195 tests.
However, with an χ² of 1.62 it's clear that none of these differences are significant.
It's clearer to see if you look at the version of the figure with dashed lines placed at 2 and -2 standardised residuals (or the point where the differences start to probably be significant). They really have reduced over the course of the season.
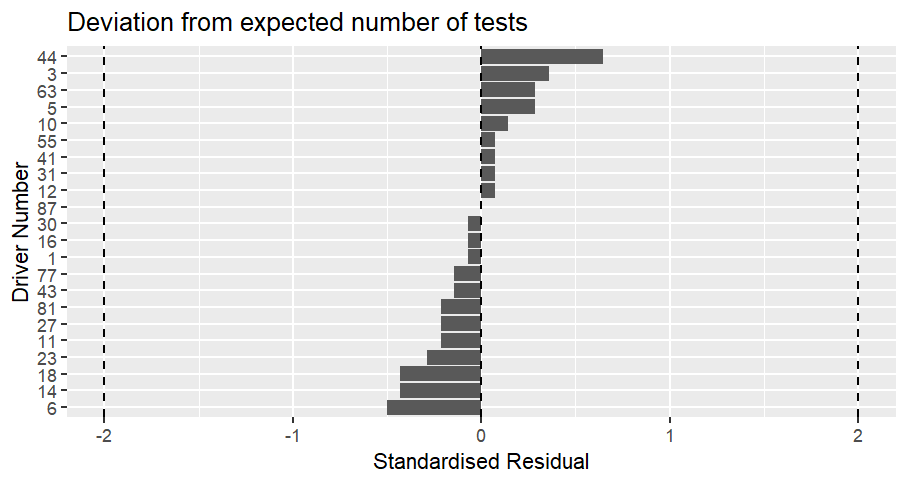 That scale shows differences from expected are not significant.
That scale shows differences from expected are not significant.
No comments:
Post a Comment