What do you mean the race result is more important?!
Let's look at the scrutineering at the Canadian Grand Prix itself:
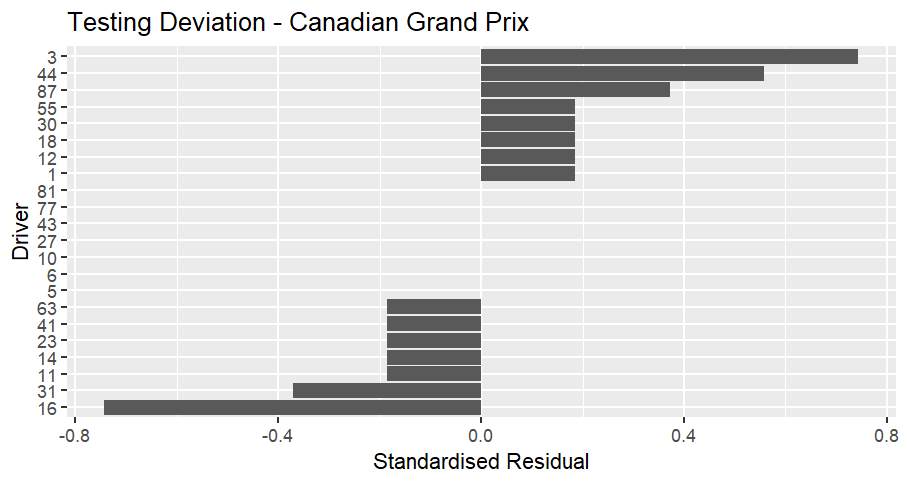
The two cars most over-tested compared to expected were Verstappen (car 3, with a value of 0.74) and Hamilton (car 44, with a value of 0.56), which makes some sort of sense since they were two of the top 3.
Leclerc (car 16) was the most under-tested, with a value of -0.74 then comes Ocon (car 31 with a value of -0.37) which is unexpected since they both finished the race when other cars didn't.
Five cars were tested exactly as much as expected, the cars of Gasly, Hulkenberg, Colapinto, Bottas and Piastri.
None of the differences from expected are statistically significant (for the people who want the details, the results give χ² = 2.0109, df = 21, p-value = 1).
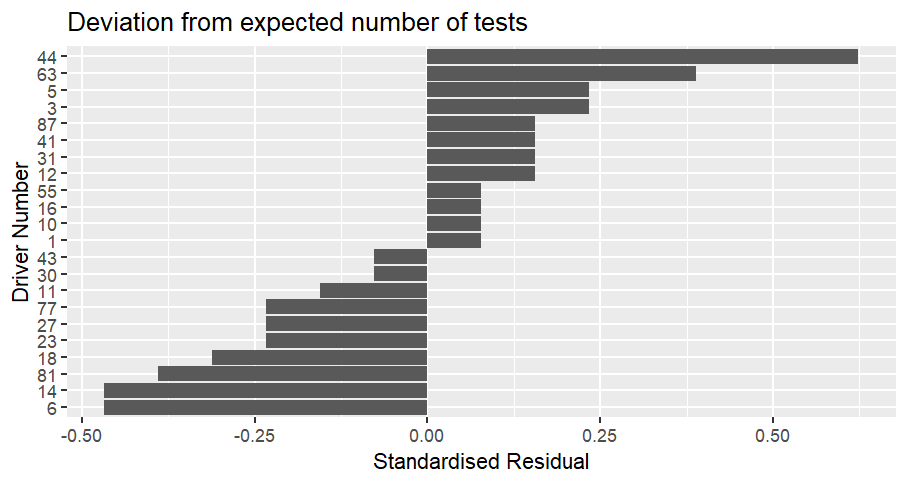
Looking at the season to date:
 None of the differences from expected are statistically significant (for the people who want the details, the results give χ² = 1.6534, df = 21, p-value = 1).
None of the differences from expected are statistically significant (for the people who want the details, the results give χ² = 1.6534, df = 21, p-value = 1). The most over-tested compared to expected are Hamilton and Russell, which makes some sense given their performances. I'd expect Antonelli to be higher than he is, but that's probably the effect of small numbers (the average car, tested exactly as often as expected, would only have been tested 165 times).
The most under-tested are Hadjar and Alonso, followed by Piastri. Piastri and Alonso make some sort of sense with 2 DNFs which were DNSs for Piastri, and Alonso having 3 DNFs in 5 races. Hadjar is unexpected, because, although he's had 2 DNFs, so have Stroll, Hulkenberg and Albon who have been tested more closely to expected than Hadjar.
None of the cars have been tested exactly as many times as expected.
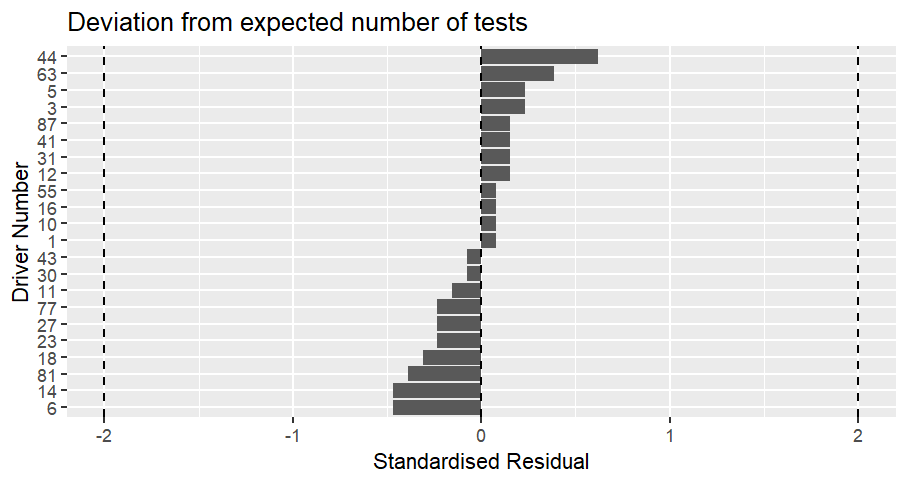
The most interesting result isn't who is highest or lowest. It's how much the residuals have shrunk as the season has progressed. You can't really see it on the individual post-race image. You can see it a bit if you look at the season to date residuals vs. where the numbers move towards significance at a standardised residual of +/- 2.
 One way to show it would be an animation of the season-to-date charts at the end of the year.
One way to show it would be an animation of the season-to-date charts at the end of the year.
No comments:
Post a Comment