The next match analysed for this project was Saints away to Catalan Dragons on the 6th of April.
The match ended with what the Saints website described as a narrow away loss - https://www.saintsrlfc.com/2024/04/06/saints-suffer-narrow-loss-away-at-catalans/
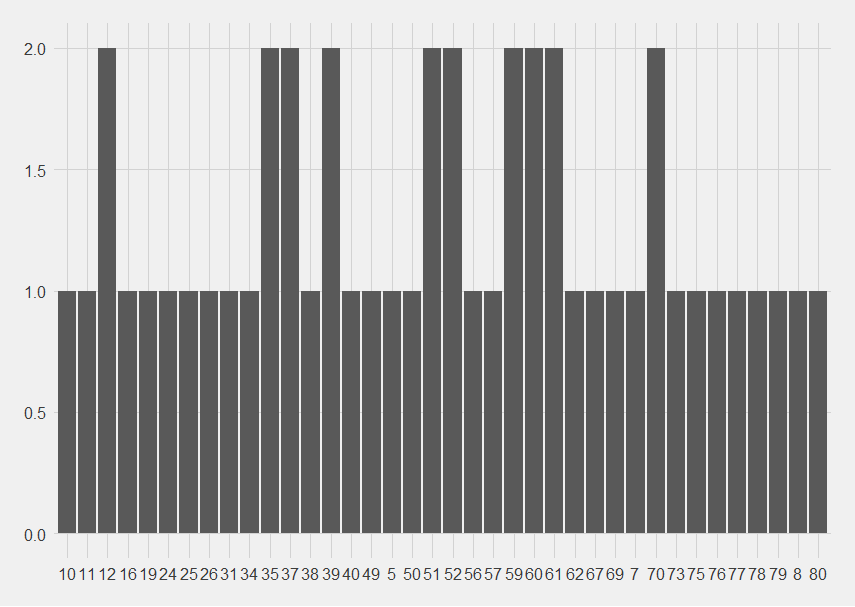
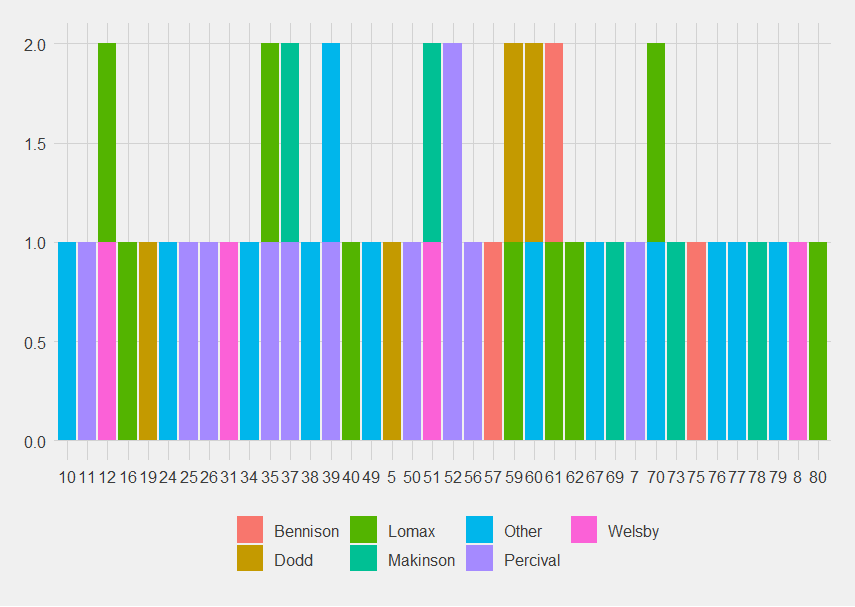
What it did do was bring up 50 point-scoring moments for Saints (so 6.25 scoring moments per match).
There is no pattern as to when Saints score (or at least not yet).
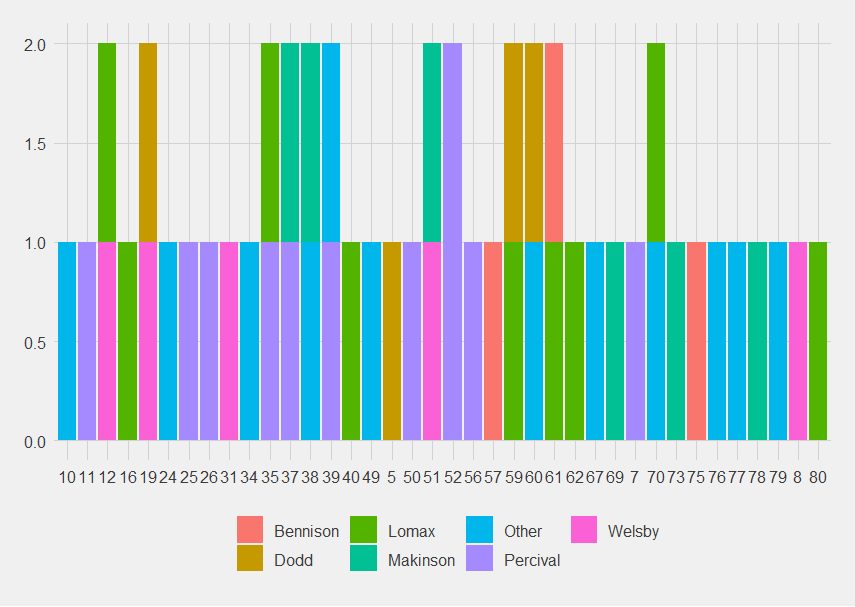
While there is no pattern, the lack of conversions starting to show (you'd expect a differently coloured bit next to each other or on top of each other, there aren't many of those). This is a problem and will be a problem come the play-offs, presuming we make it.
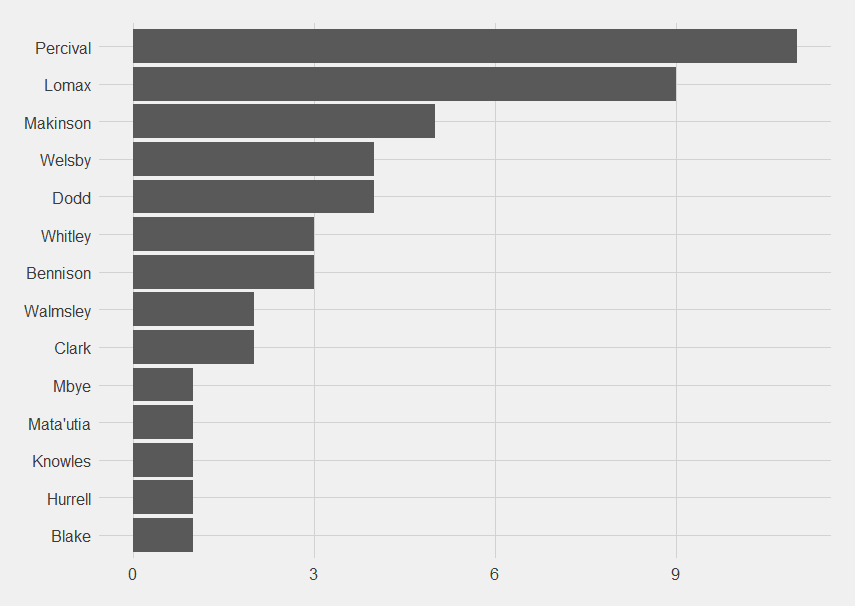
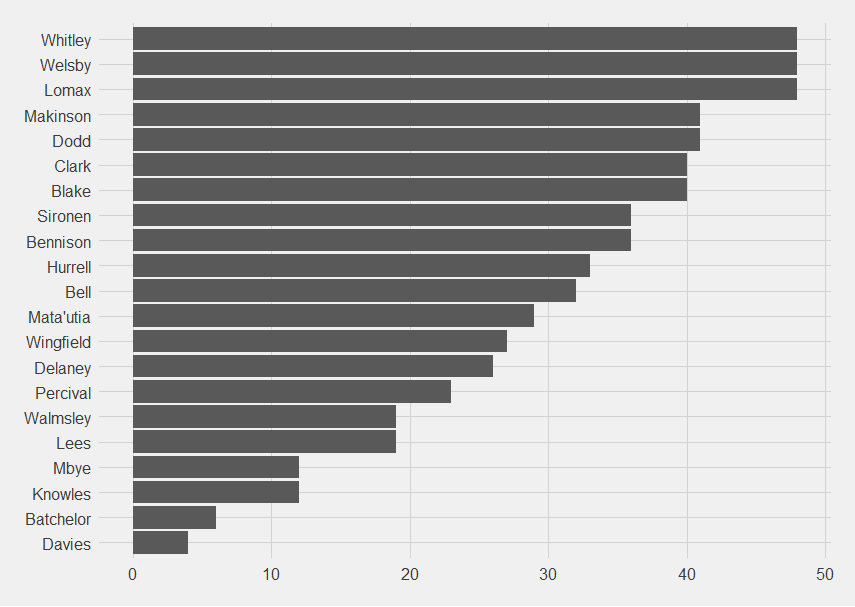
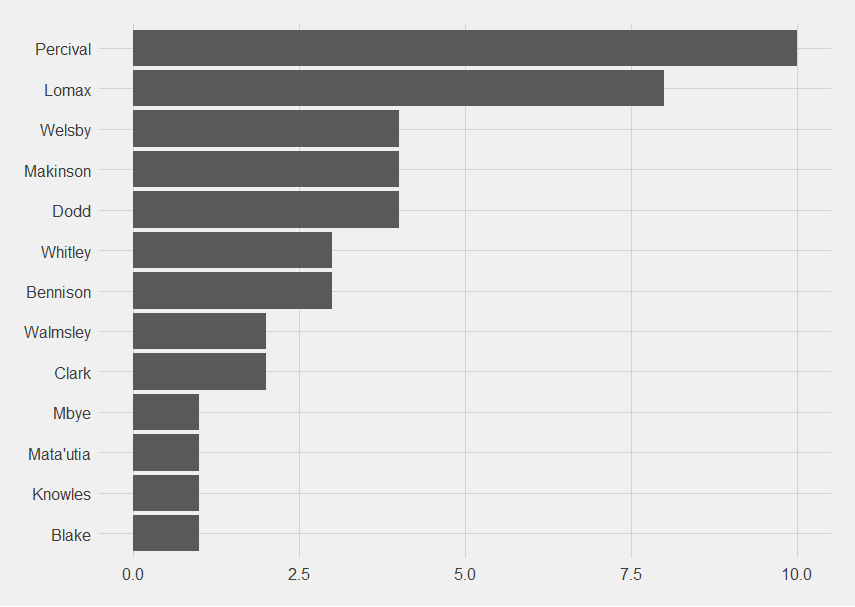
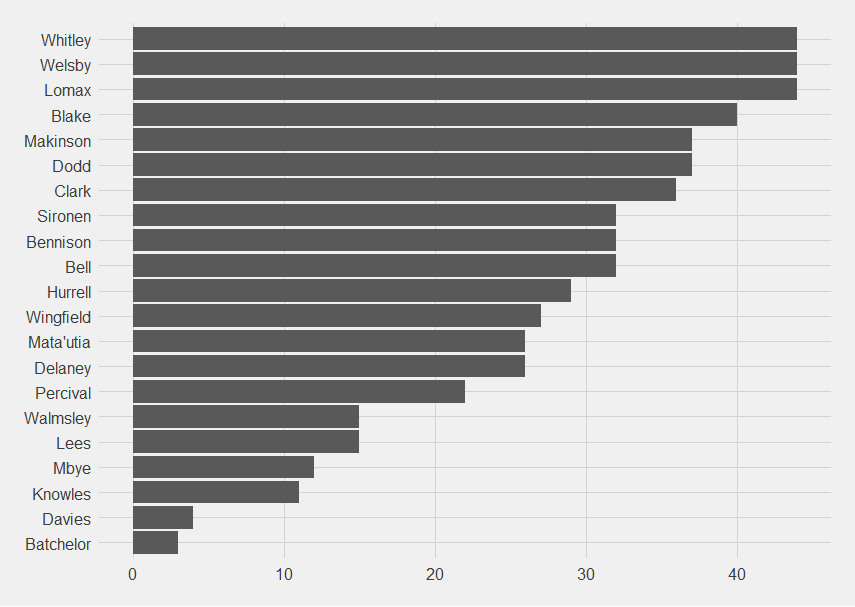
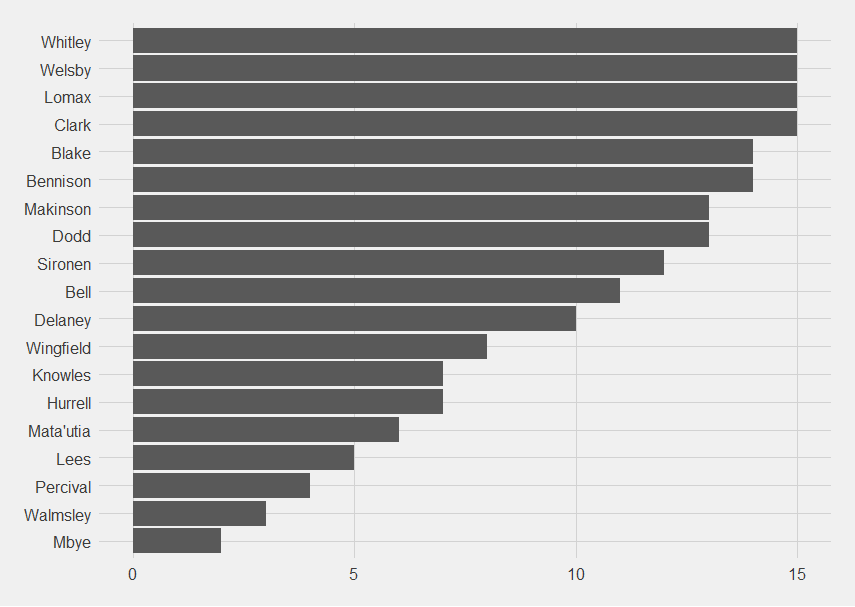
Which Saints players are present when they score?
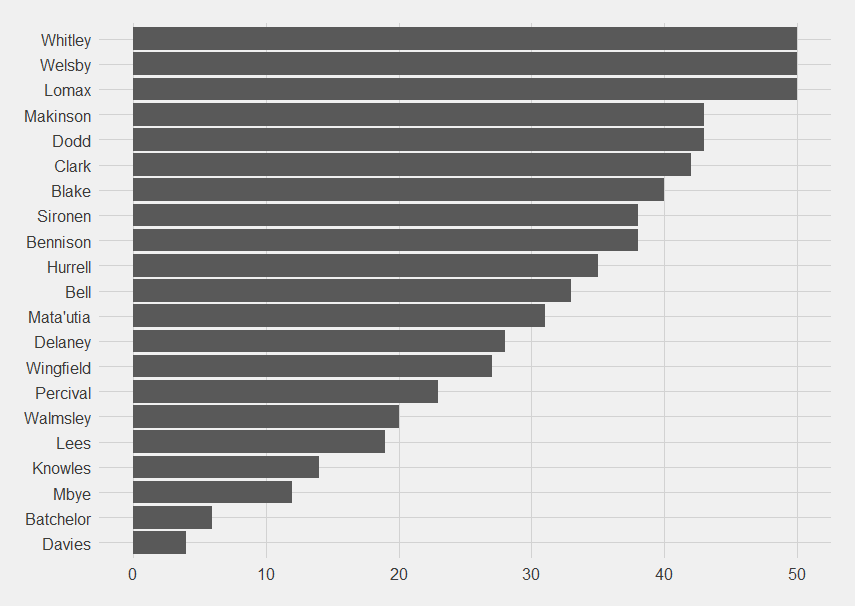
Whitely, Welsby and Lomax were present for all 50 point-scoring moments. The next most present are Makinson and Dodd.
Present least often are Mbye (12), Batchelor (6) and Davies (4). Davies is because he was out injured (and then sent out to Swinton to get match fit [https://www.sthelensstar.co.uk/sport/23520688.paul-wellens-gives-konrad-hurrell-update-praise-ben-davies/]). Mbye's is because he only plays when Daryl Clarke can't or needs spell on the bench.
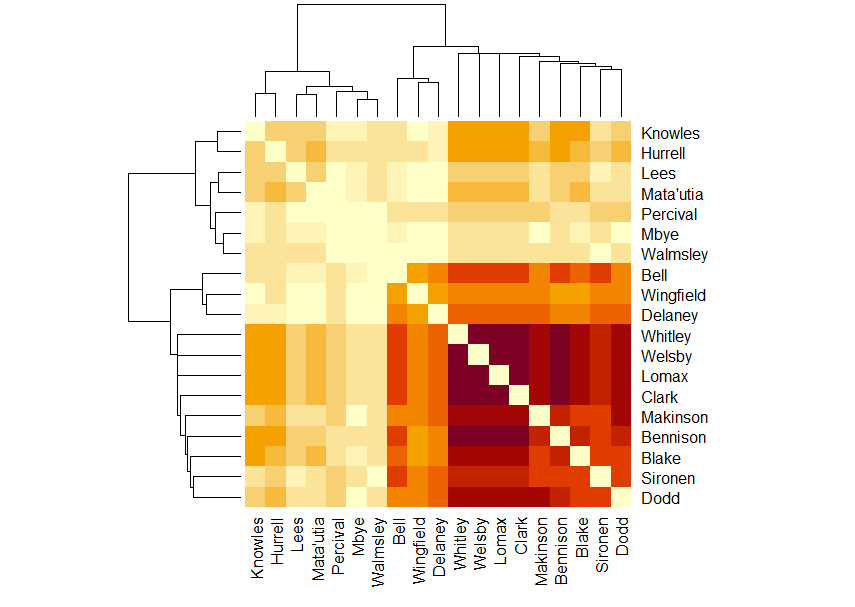
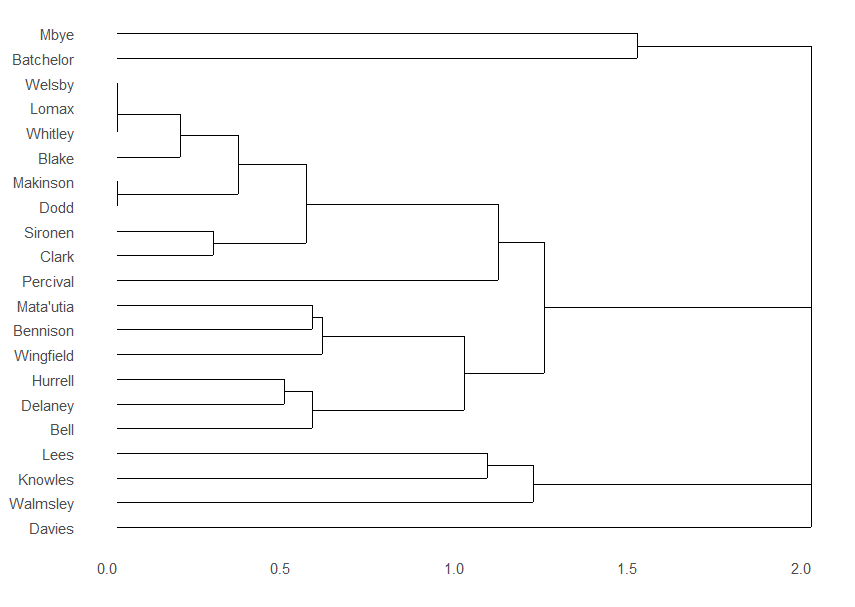
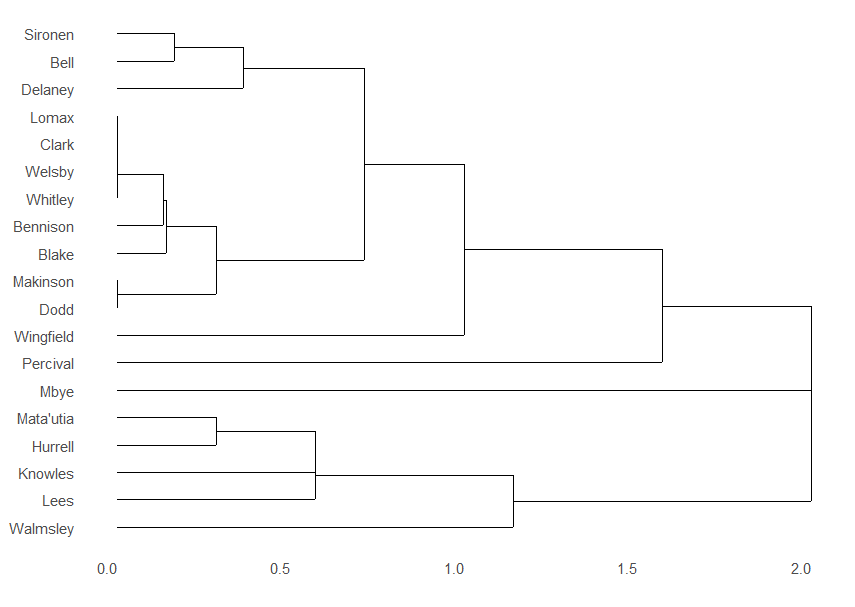
I'm not sharing the dendrogram because it's officially too complicated to interpret.
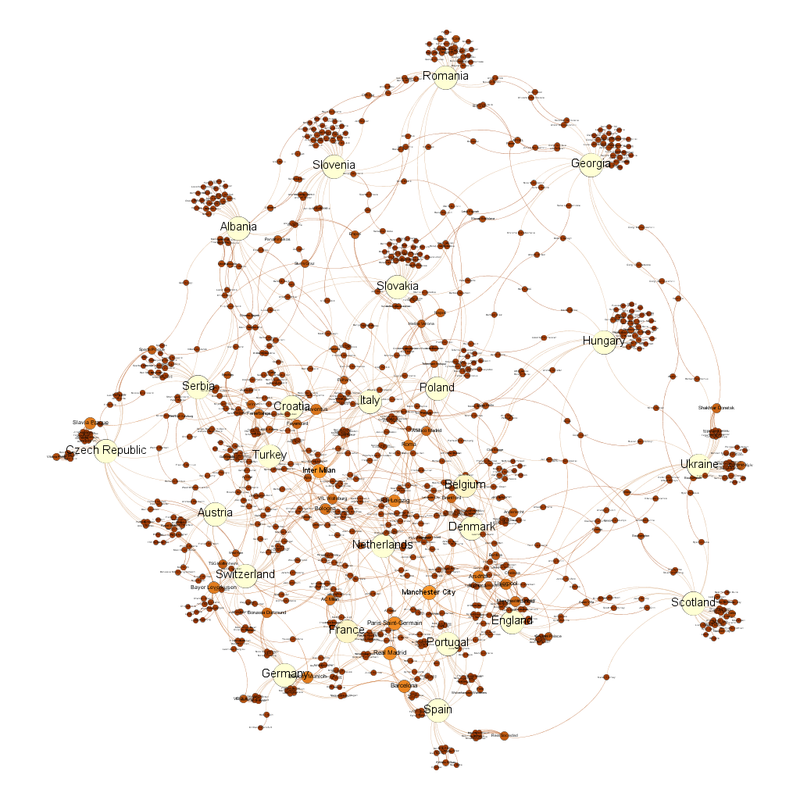
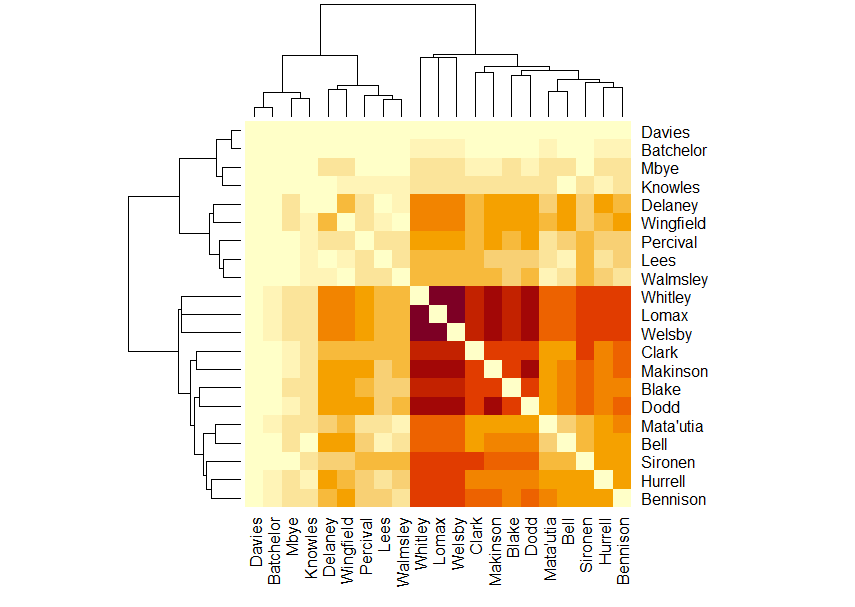
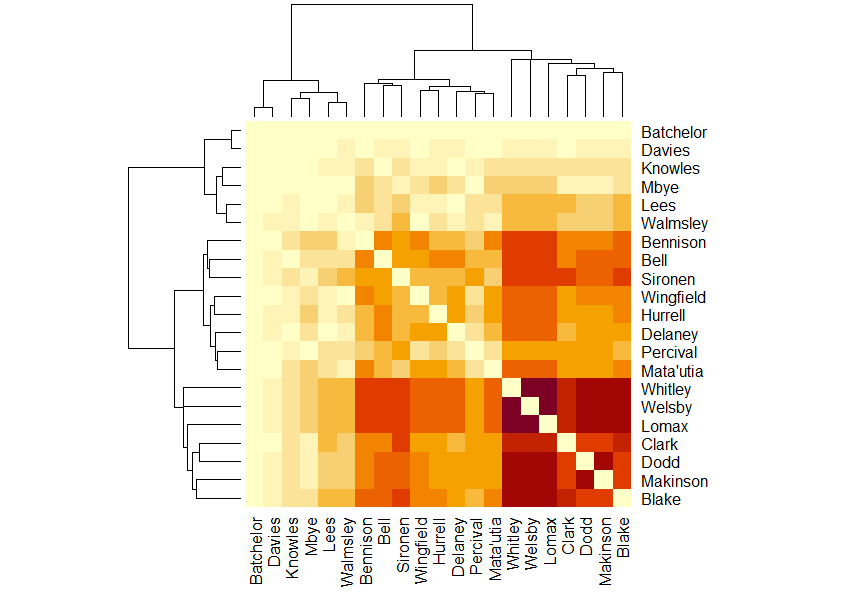
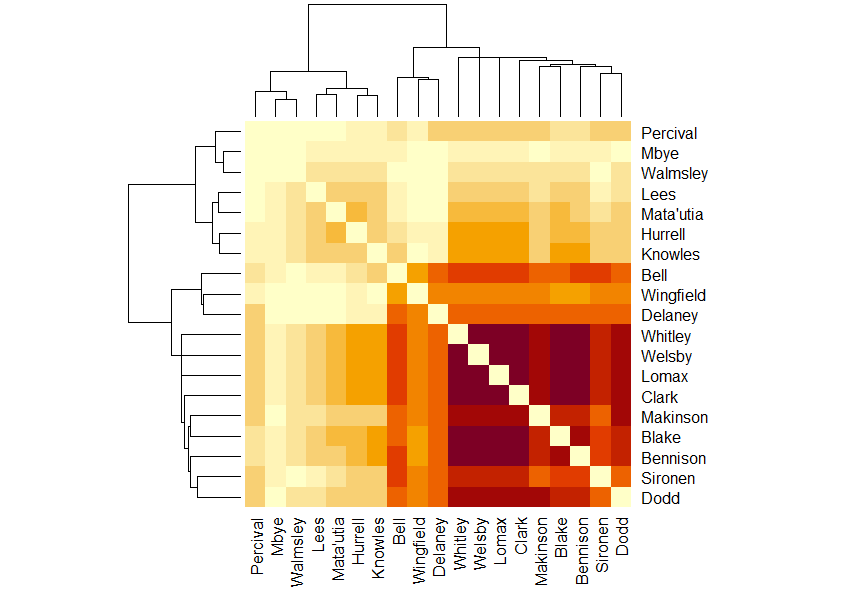
The matrix diagram looks like this.
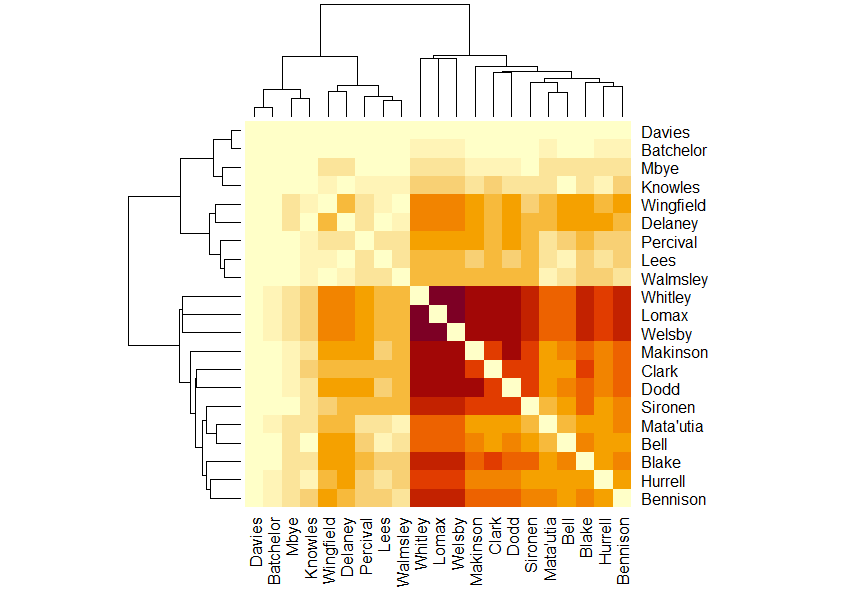
Paler squares are for players who do not play together when Saints score. These are starting to form some interesting patterns:
Bell, Lees, Knowles
Hurrell, Lees, Knowles
Mata'utia, Walmsley
Sironen, Wingfield
Dodd, Lees
Makinson, Lees, Knowles
Some of these I can explain as forwards who don't play together often. Makinson and Lees and Knowles, and Dodd and Lees, I can't explain.
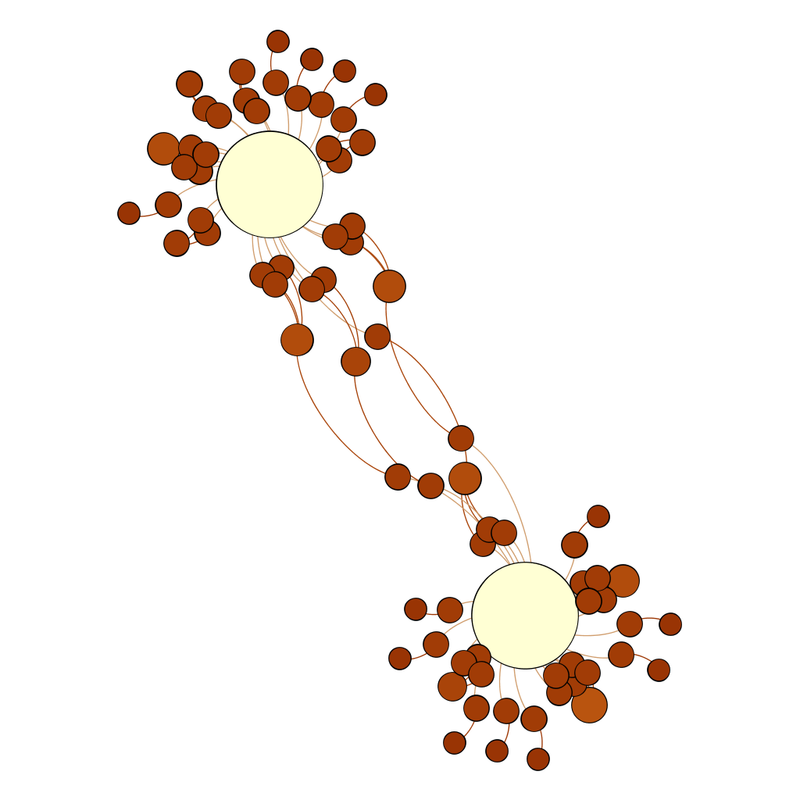
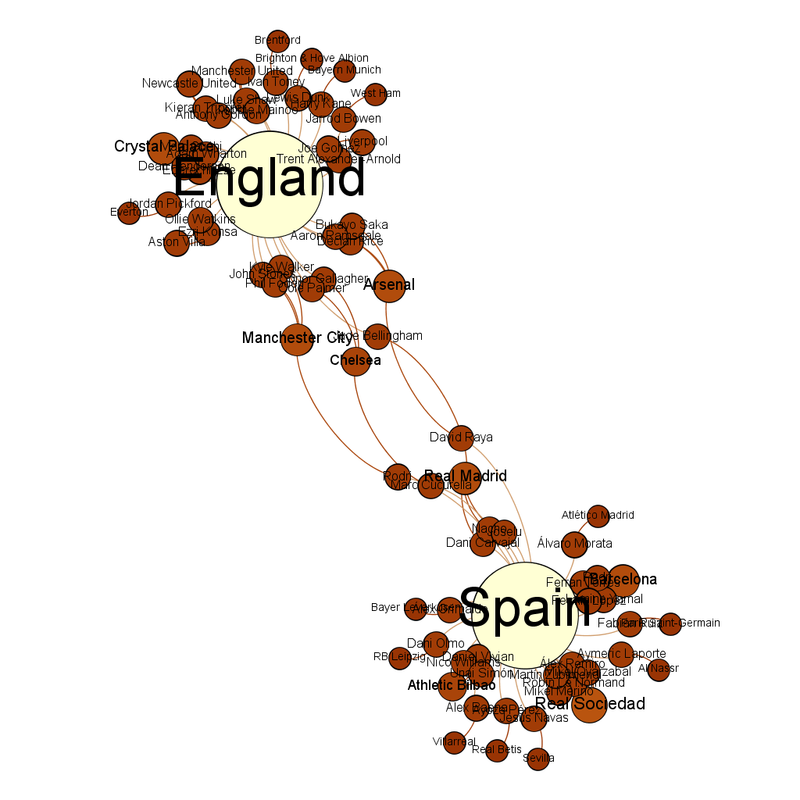
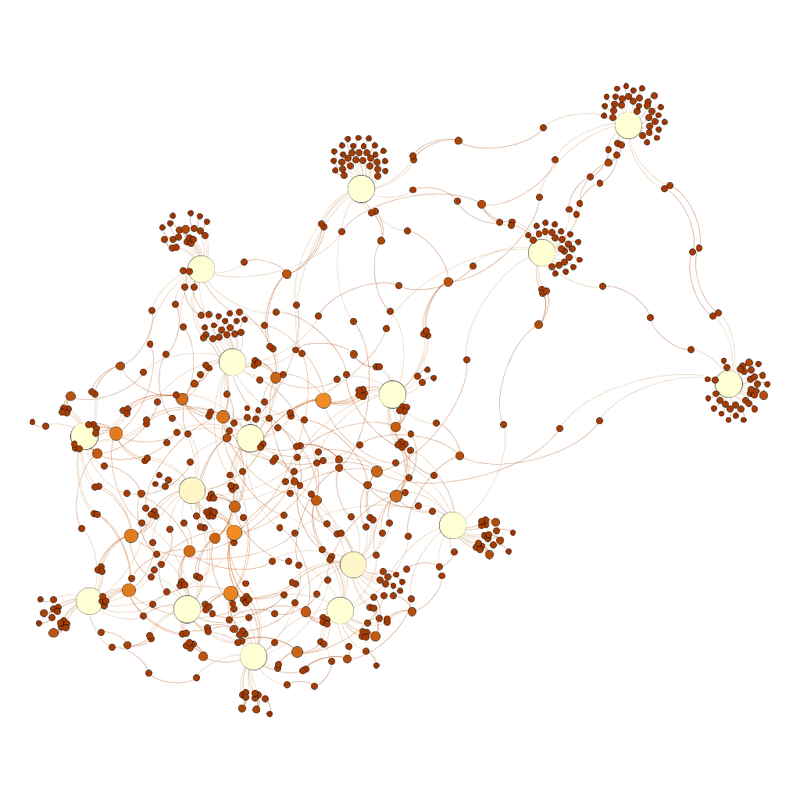
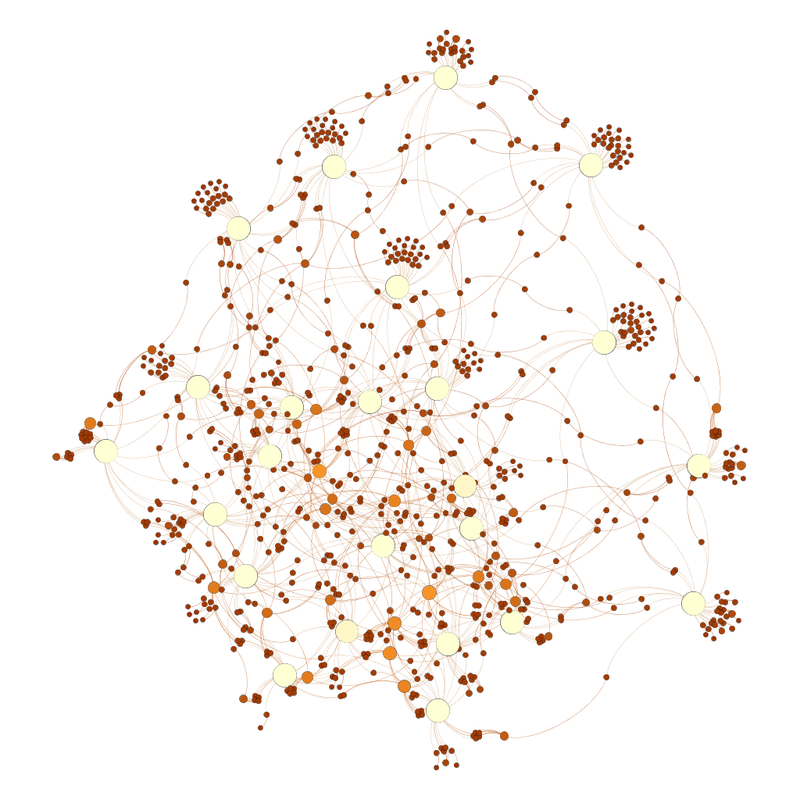
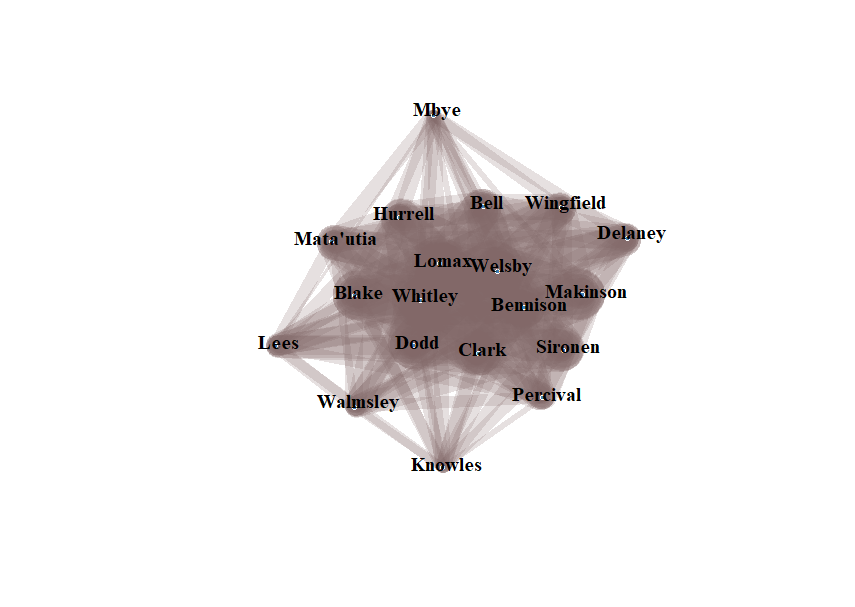
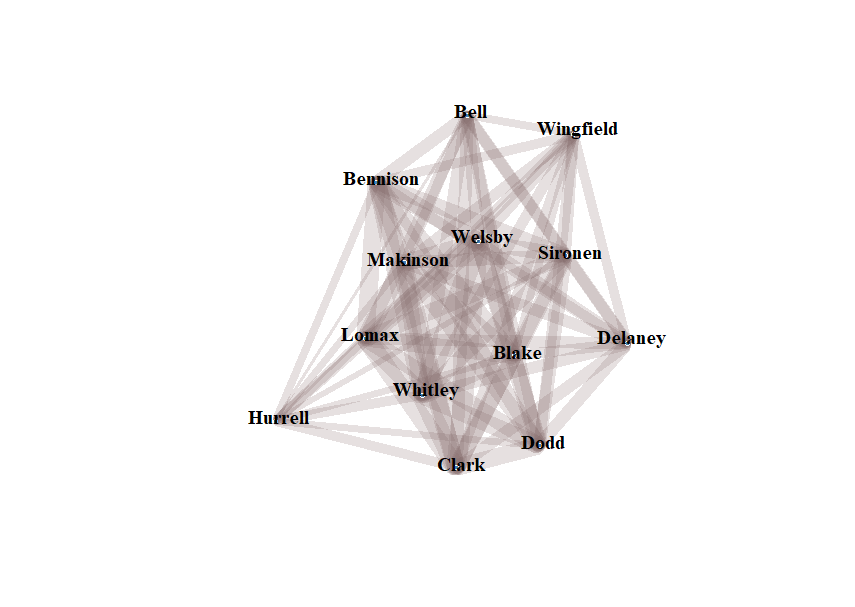
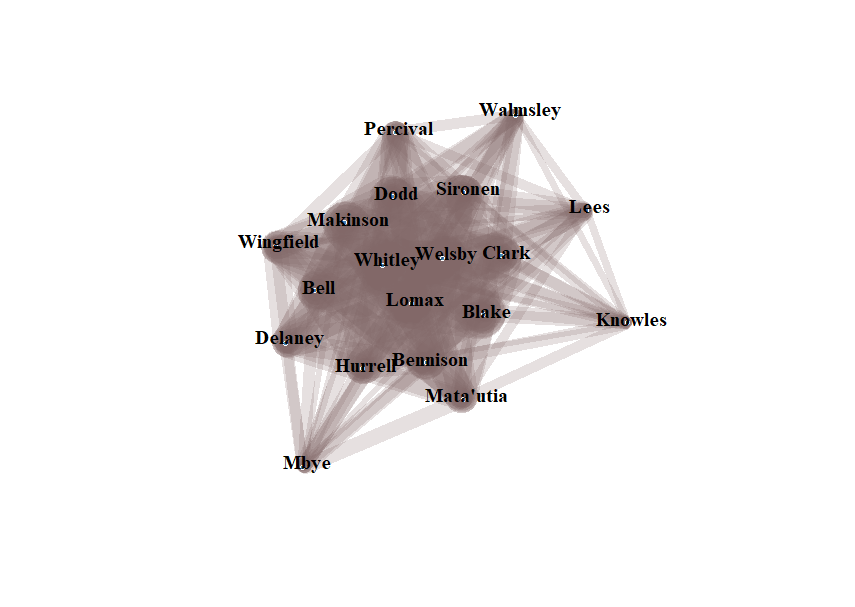
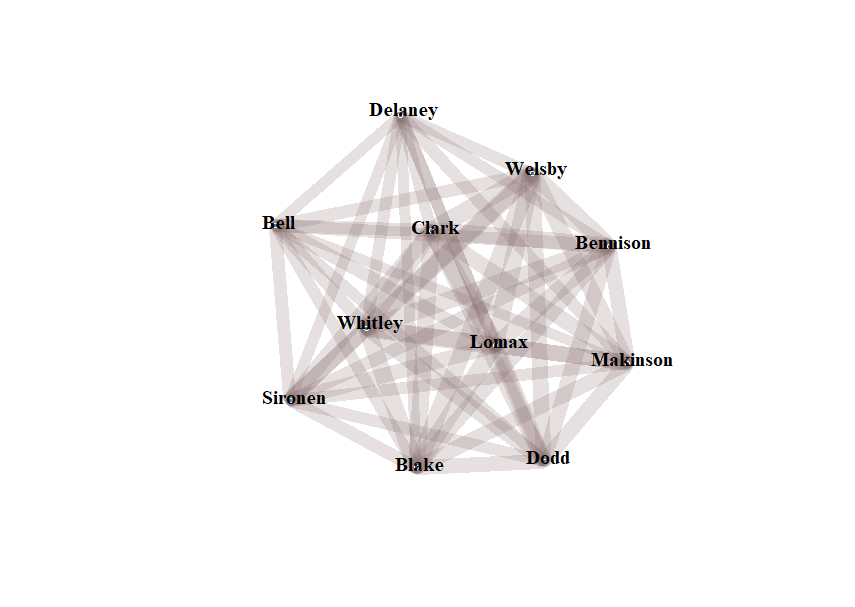
There are 19 players in the network graph, like there was last time (https://fulltimesportsfan.wordpress.com/2024/06/03/saints-ahoy-visualisations-from-game-7-and-the-season-to-date/). It's tilted about 90 degrees anti-clockwise and now looks like a slightly nobbily tilted square.
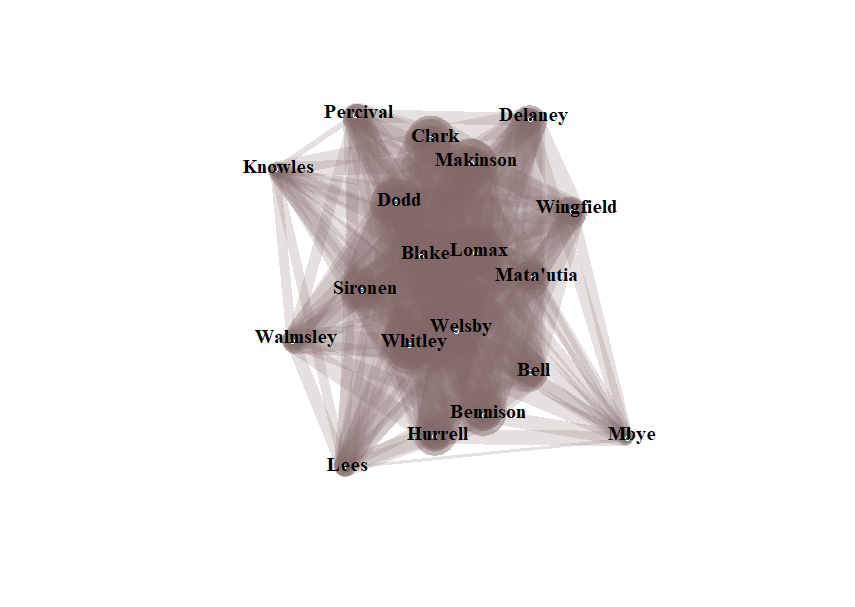
The central chunk are Sironen, Blake, Lomax, Matautia, Welsby and Whitely.
The chunk on top are Dodd, Clark and Makinson.
The chunk on the bottom are Hurrell, Bennison and Bell
Outside (from top left) = Knowles, Percival (I presume because of injury and suspension), Delaney, Wingfield, Mbye, Lees and Walmsley
In the 8 games, Saints have conceded 21 point-scoring moments.
Most interestingly, they have conceded at minute 76 to two different teams.
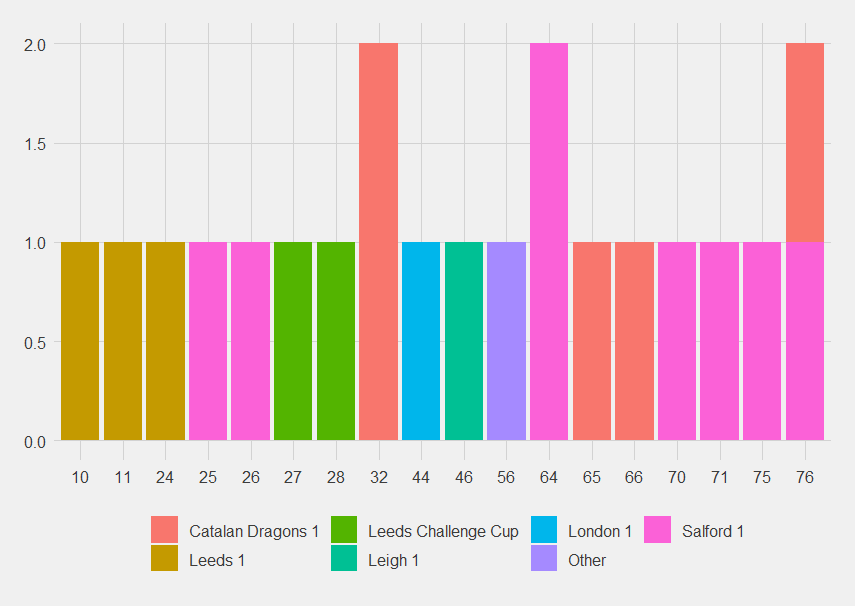 The three players most present when Saints score are also most present when they concede, then Bennison, then Makinson and Dodd. Bennison much higher on the "when Saints concede" chart than on the "when Saints score chart".
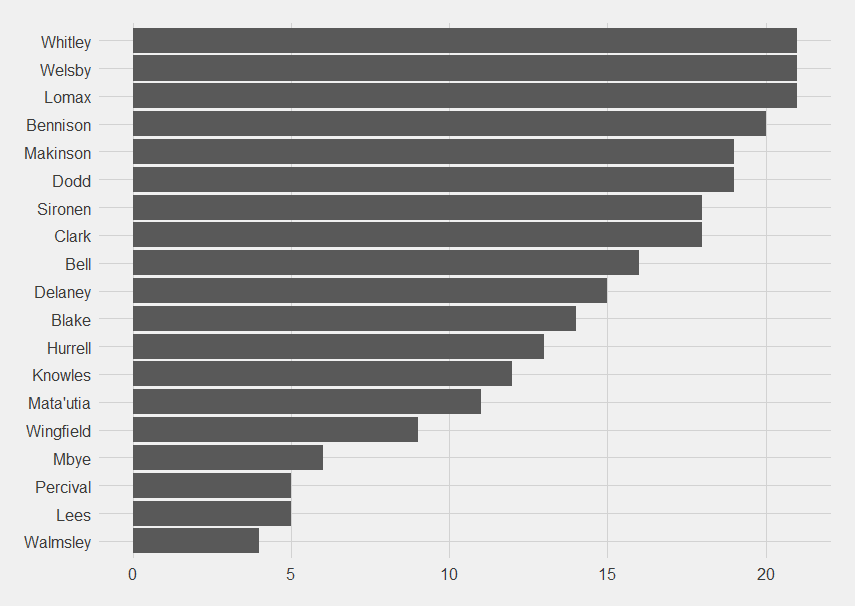
The players present for the least concession moments are Walmsley, Lees and Percival, which is probably due to the number of minutes those three players have played.
The three players most present when Saints score are also most present when they concede, then Bennison, then Makinson and Dodd. Bennison much higher on the "when Saints concede" chart than on the "when Saints score chart".
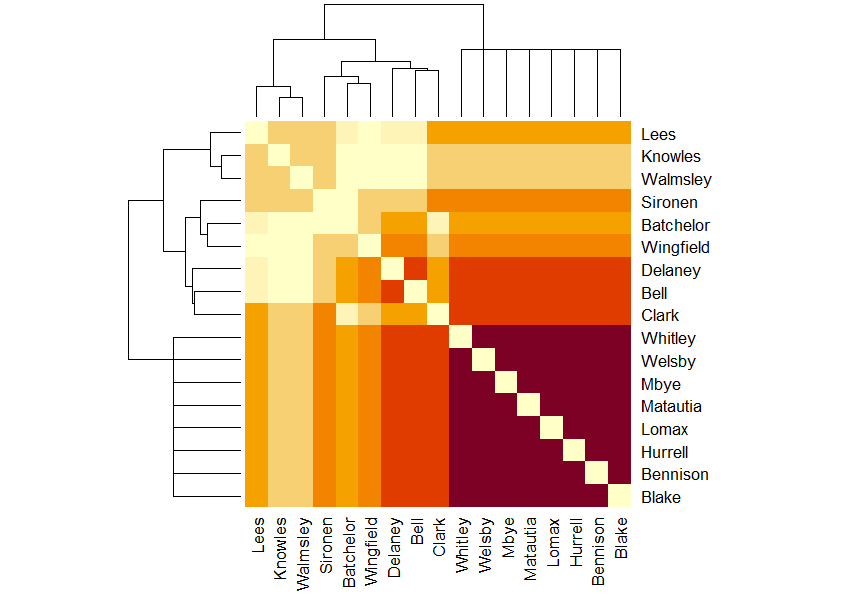
If we look at the concession matrix, it looks like this:
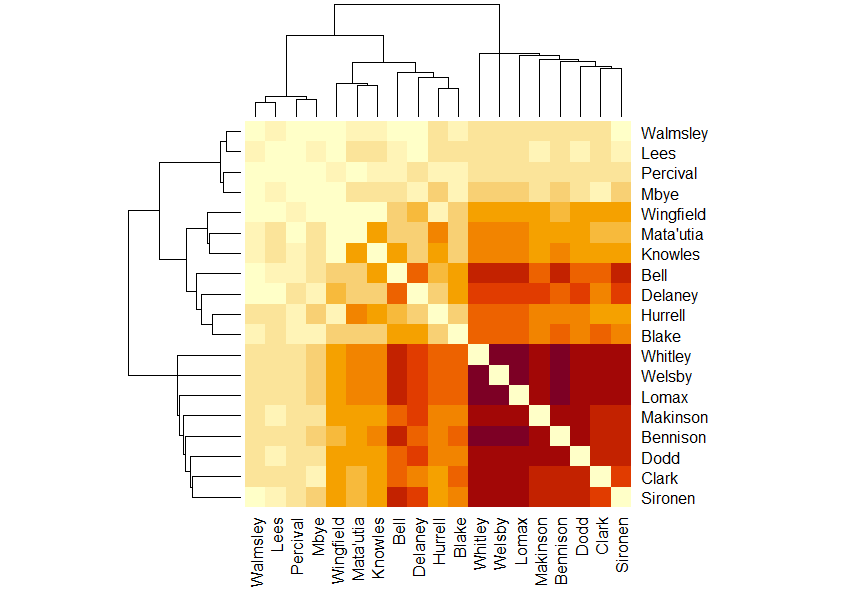
The players whose crossing points are paler than expected, which suggests they don't play together when Saints concede are:
Clark and Mbye (which makes sense because they are both hookers)
Dodd and Lees
Makinson and Lees
Blake, Percival and Mbye
Hurrell and Wingfield
Delaney and Mbye
Knowles and Wingfield
Mata'utia and Wingfield
The Wingfield paler bits are probably because he was playing with them before he got injured (https://www.sthelensstar.co.uk/sport/24313416.saints-heart-broken-jake-wingfields-shoulder-injury/)
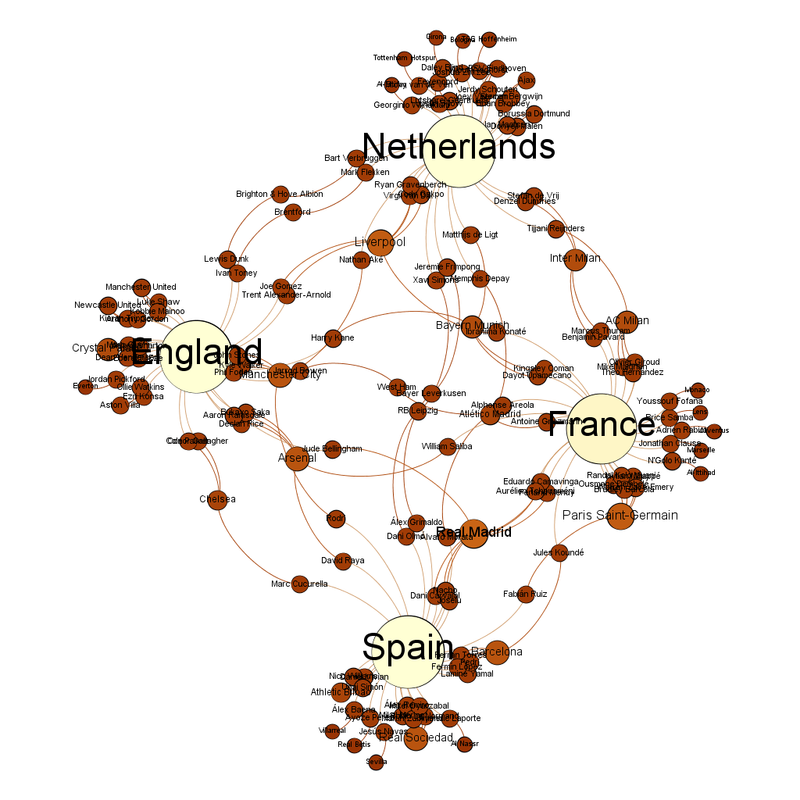
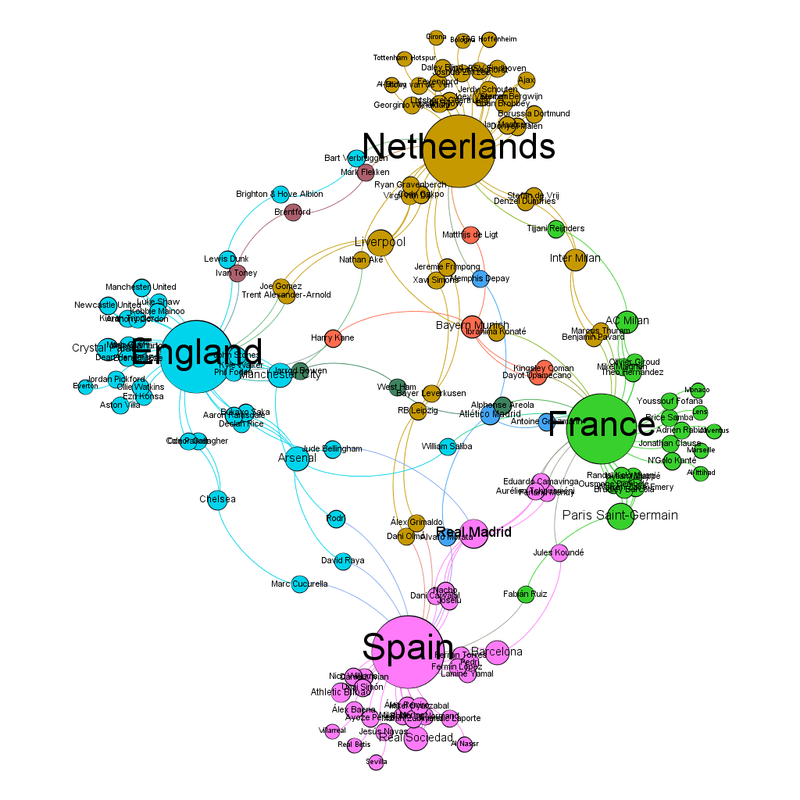
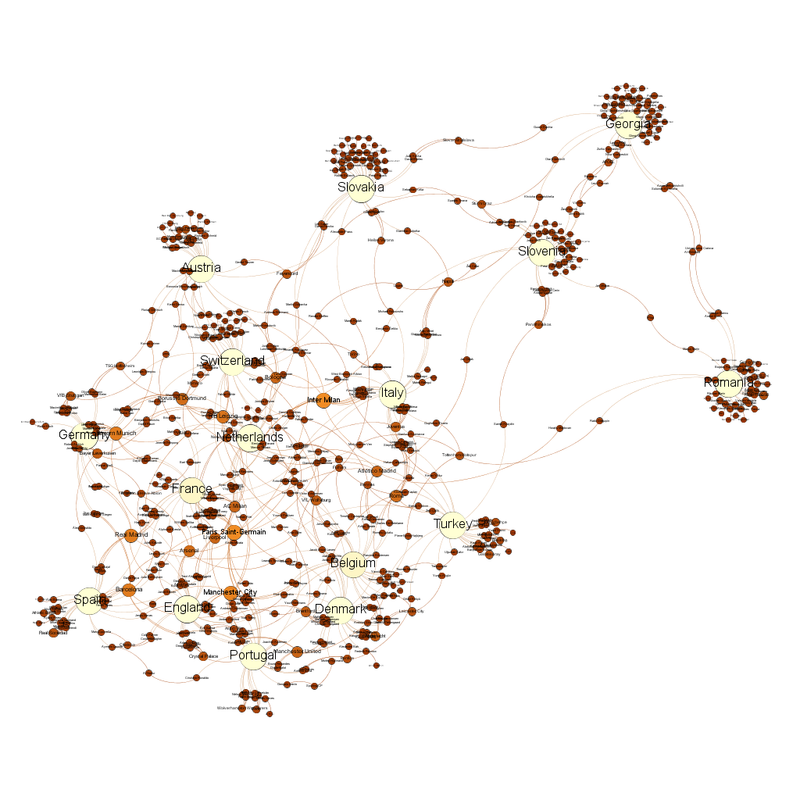
The network graph for when Saints concede
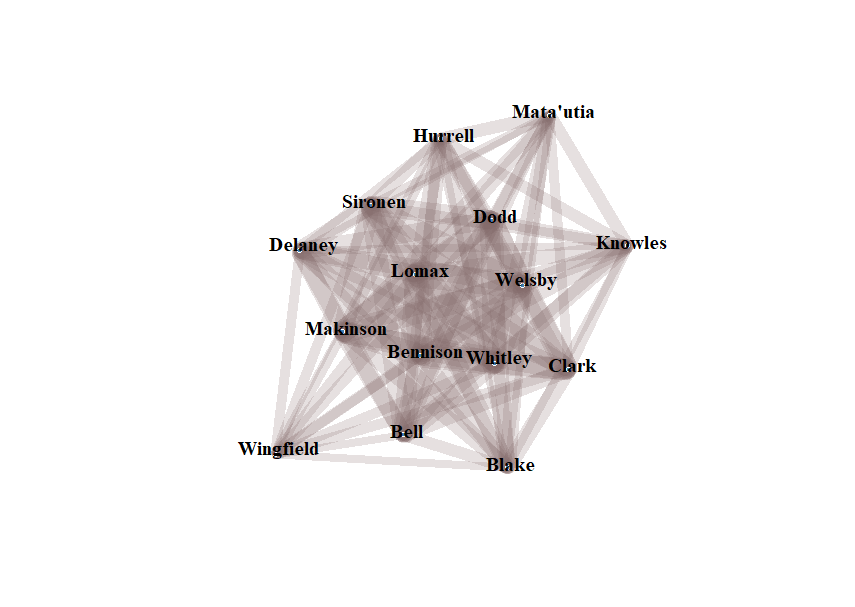
There are 15 players in the network graph.
The central chunk, clockwise from top (in a sort of diamond) are Hurrell, Dodd, Welsby, Clark, Bell, Makinson, Sironen, around a central trio of Lomax, Whitley, and Bennison.
Outside are Matautia, Knowles, Blake, Wingfield, Delaney
Again, I think the injury is why Wingfield is out there.