I would like to say it wasn't that, and the delay is partly because real life got real in a variety of ways, but England have done it to me again.
I was in the crowd at Wembley when New Zealand beat England in the last 30 seconds of the semifinal in 2013.
I have now been in the crowd as they lost a semifinal in golden point extra time.
Because a Samoan who had never scored a drop goal before scored one.
I start to feel I might be a jinx.
The only saving grace is that England did it to better people than me too.

So much of what England did right in the group stages and the quarterfinal, they just didn't do in the semifinal. Part of that was their own mistakes (particularly trying to force passes that just weren't on) but partly it was Samoa dominating the pitch.
Field control is as much a thing in rugby league as ring and octagon control is in fighting, and Samoa controlled the pitch magnificently. Compare where on the pitch England had to kick on the 5th versus where Samoa were doing it.
It was clear in the stands.
Also clear in the stands was the gap in the right side of England's defence between Dominic Young and Kallum Watkins - and if I could see it, Matt Parish could too, and that's where Samoa kept attacking.
My pre-match guess, based on the data, for the starting 13 was "Williams, Welsby, Young, Makinson, Burgess, Hill, Bateman, Farnworth, Radley, Whitehead, Watkins, Tomkins and McIlorum.
13 out of 13 guessed correctly, which is a nice confirmation that the methodology is showing something real.
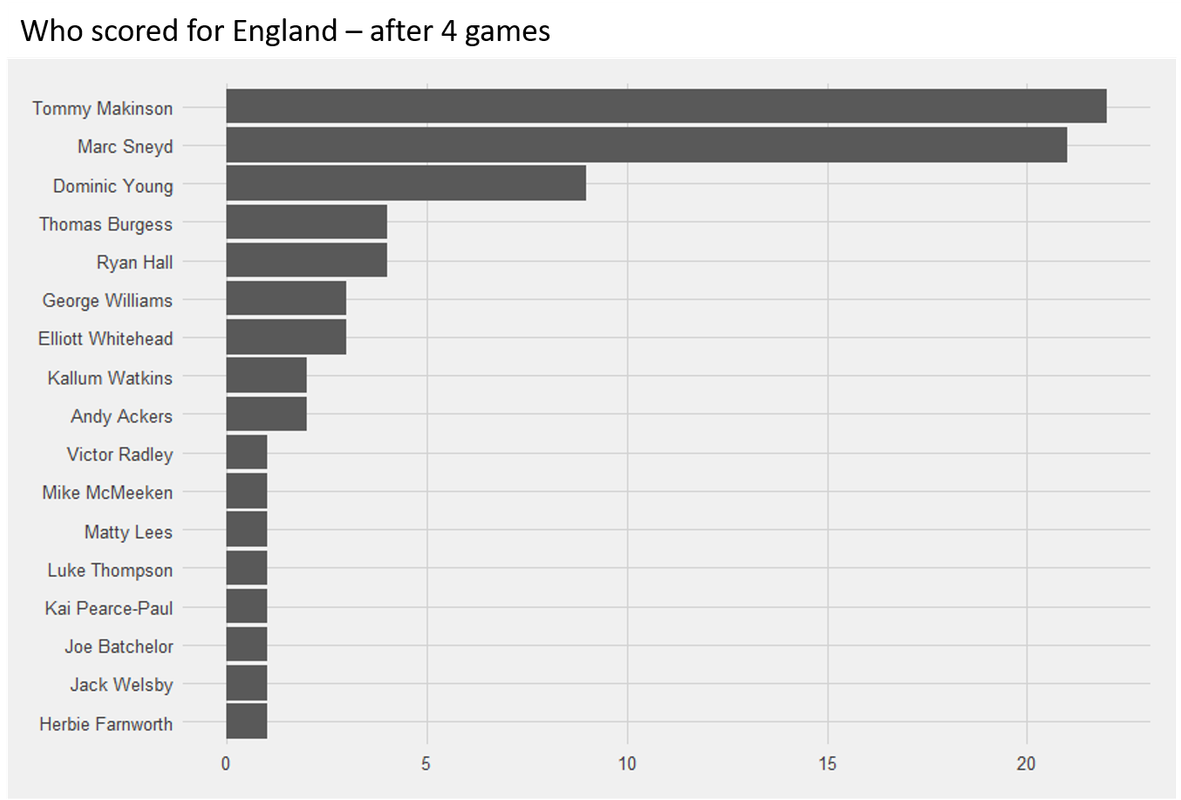
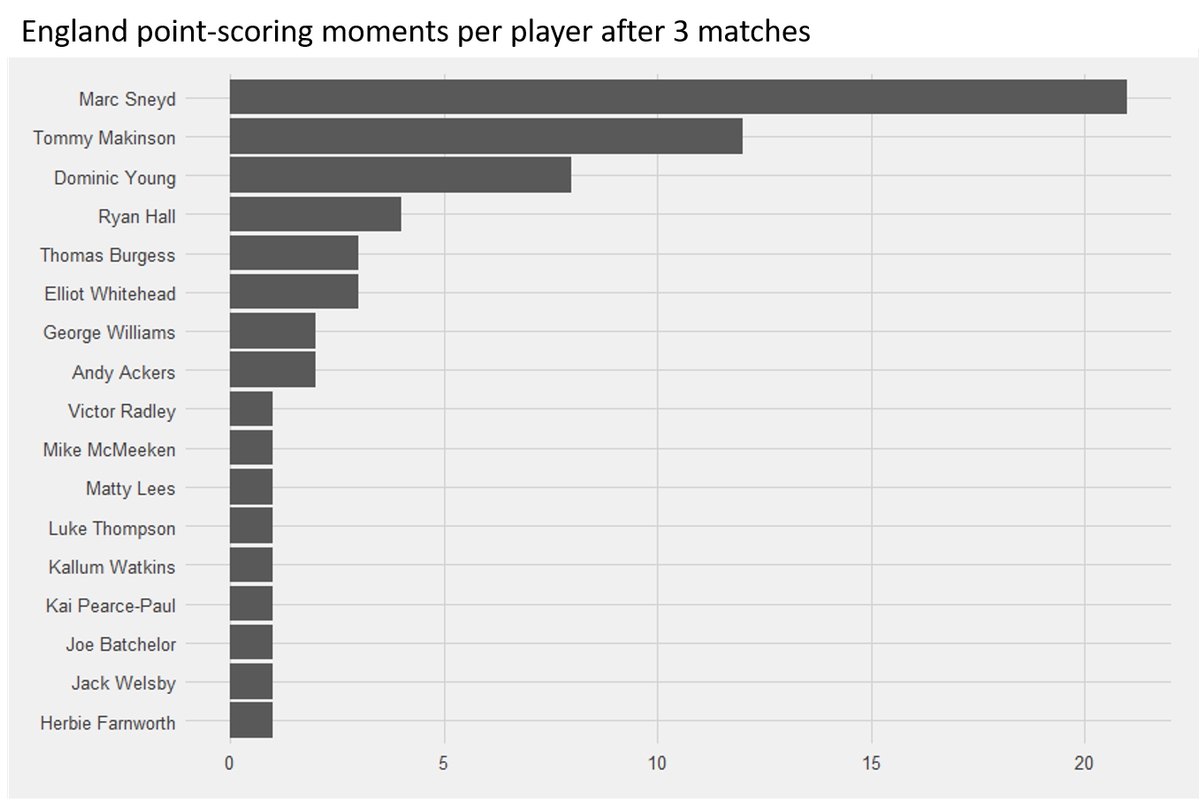
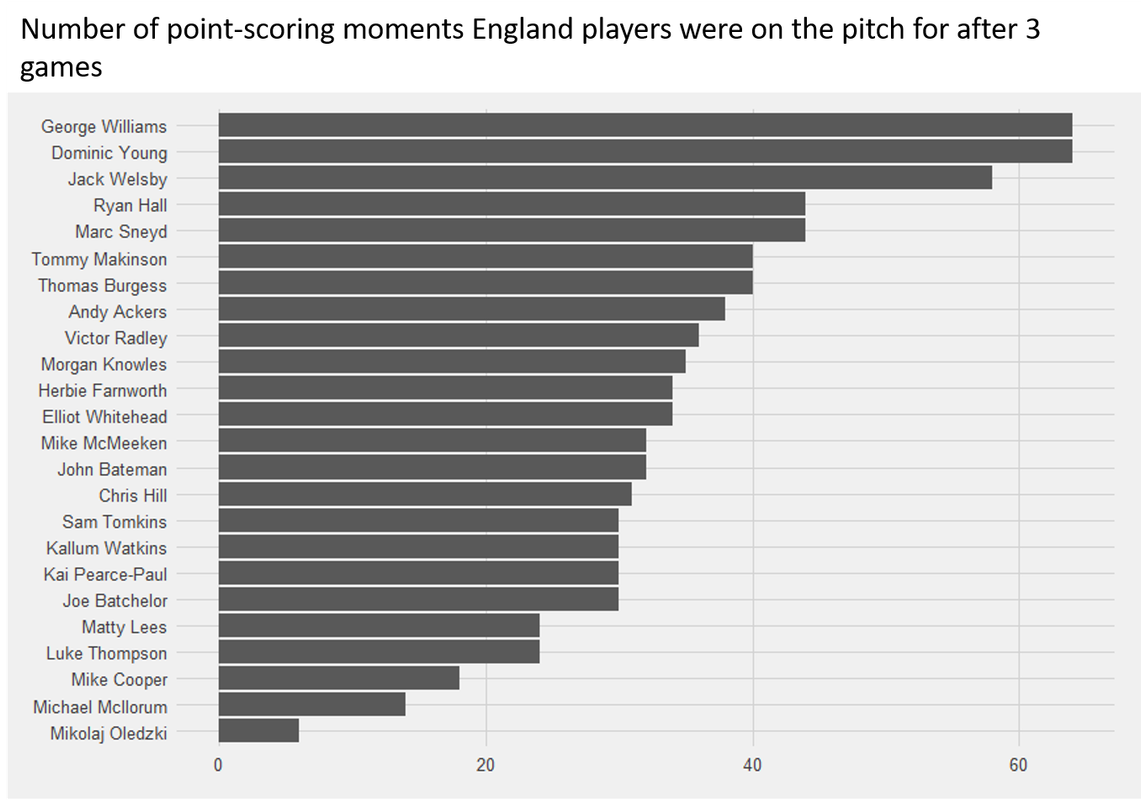
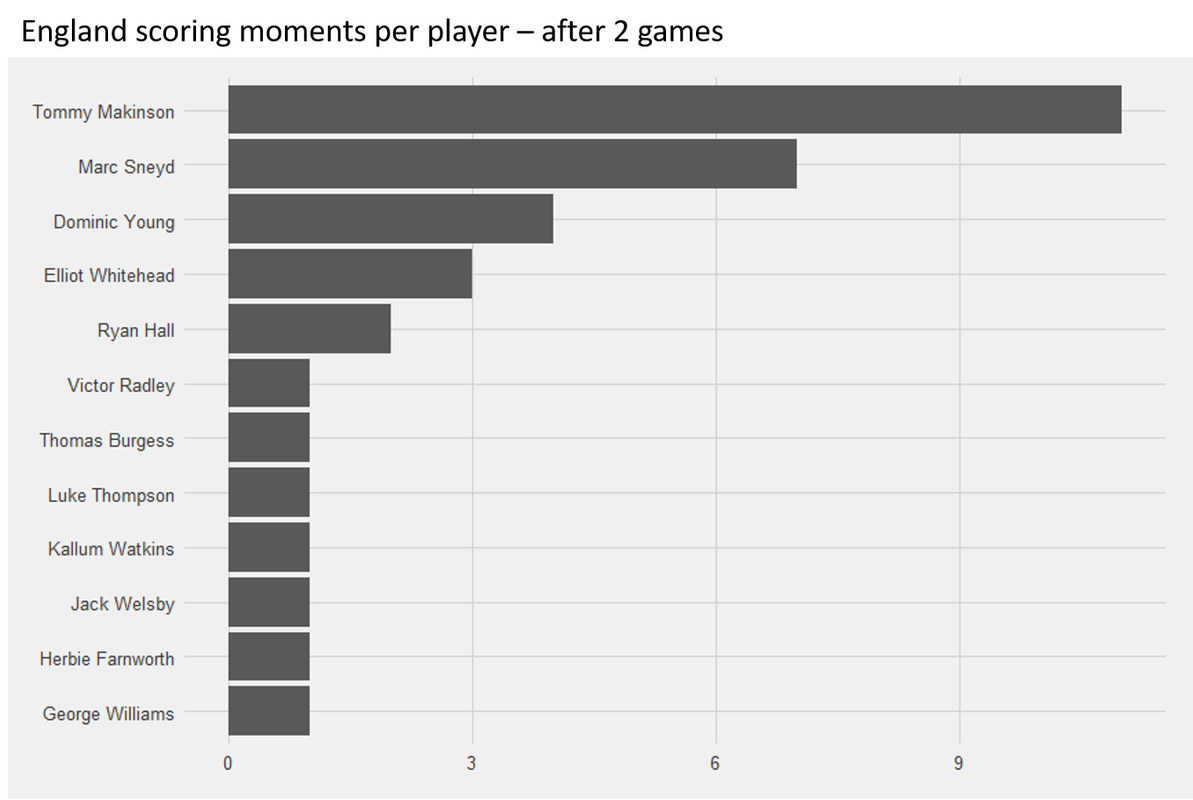
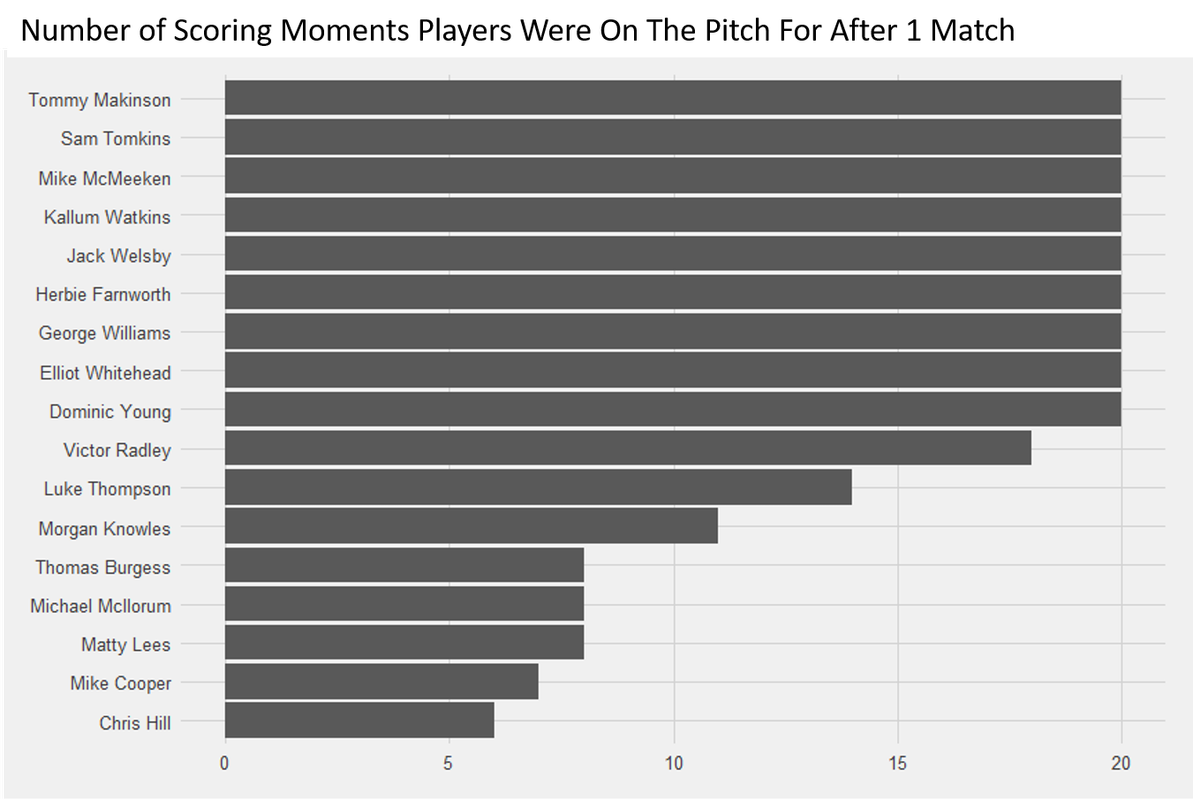
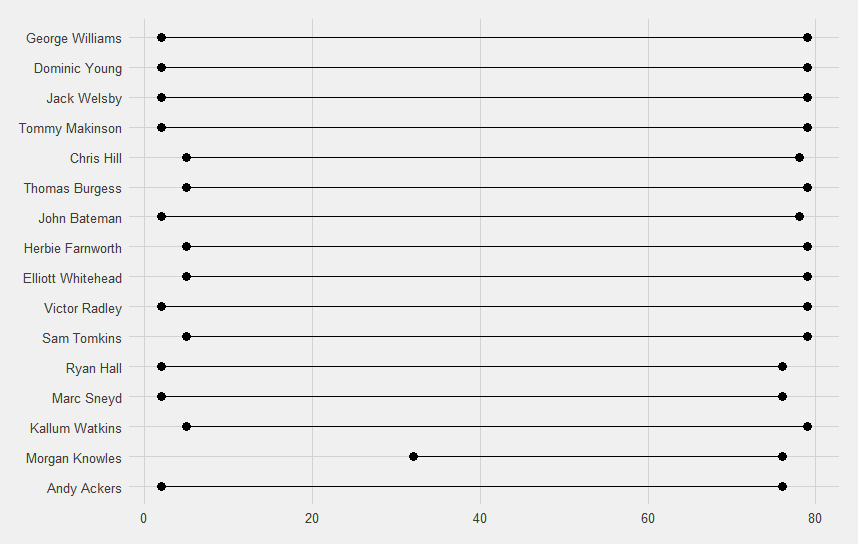
England were involved in 87 point-scoring moments.
Number of point-scoring moments per player: 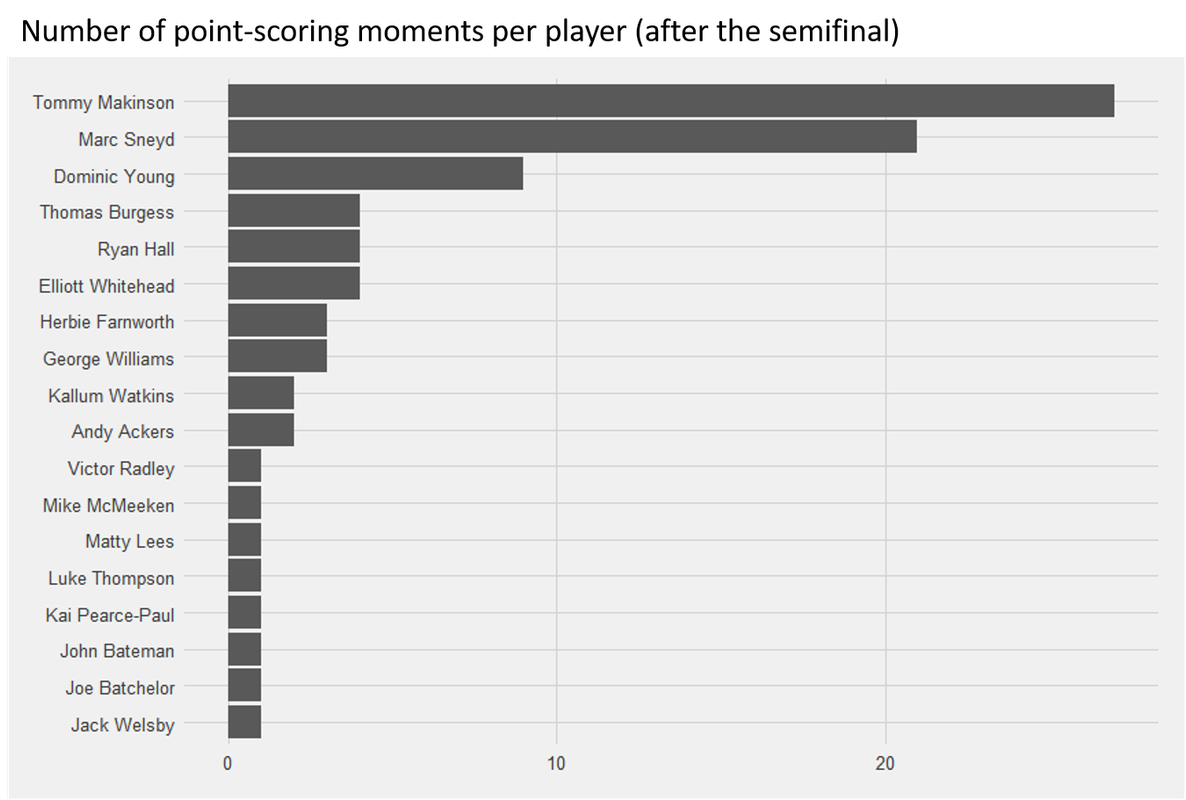
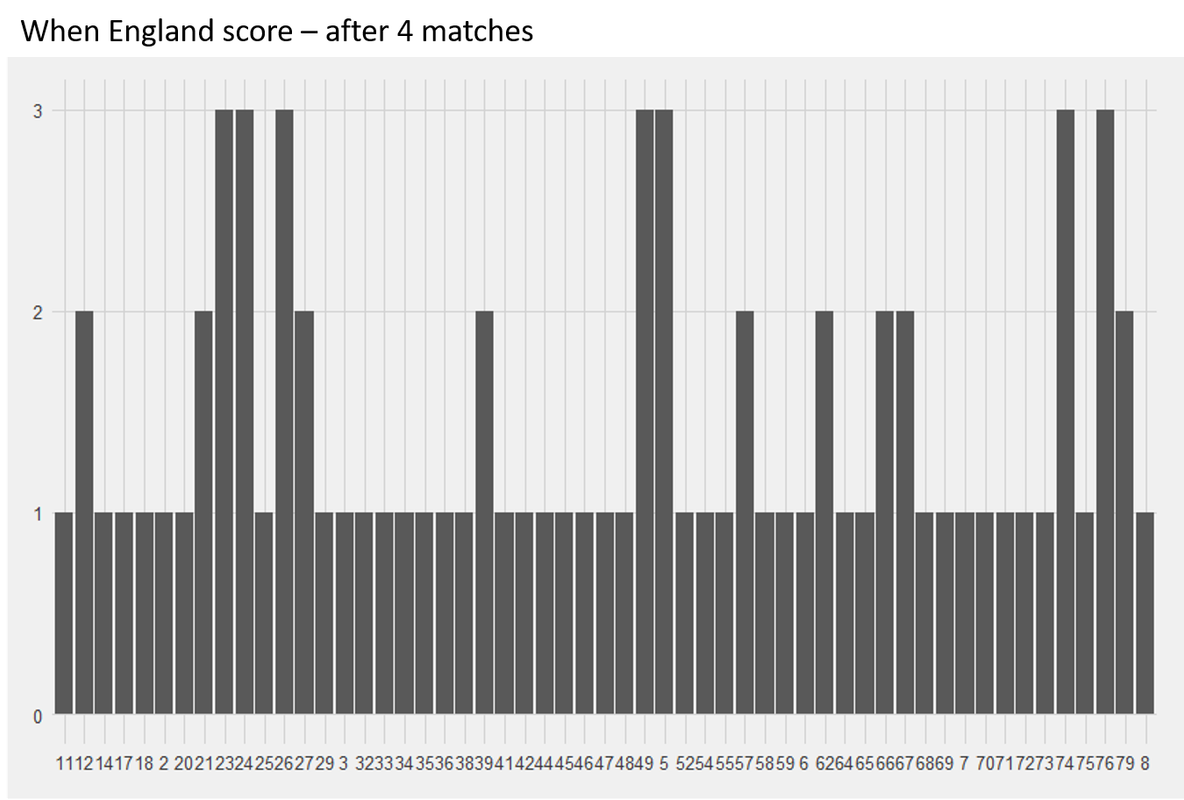
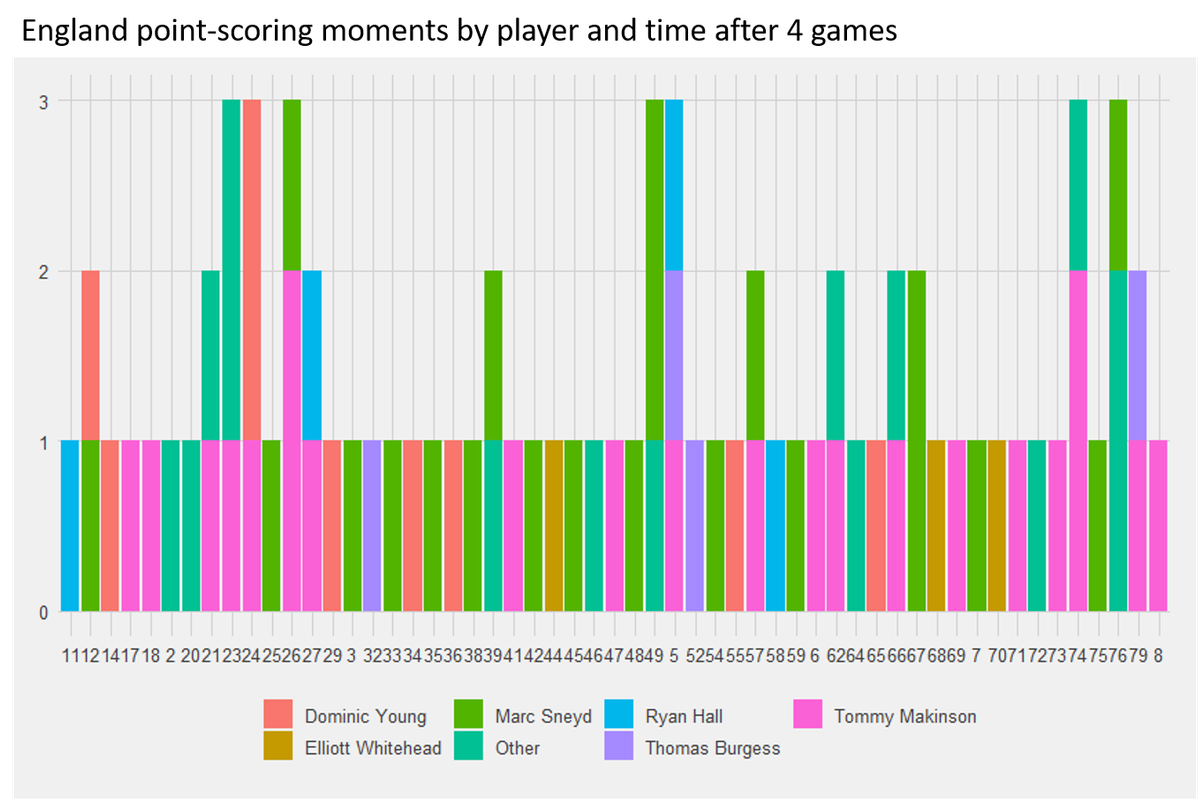
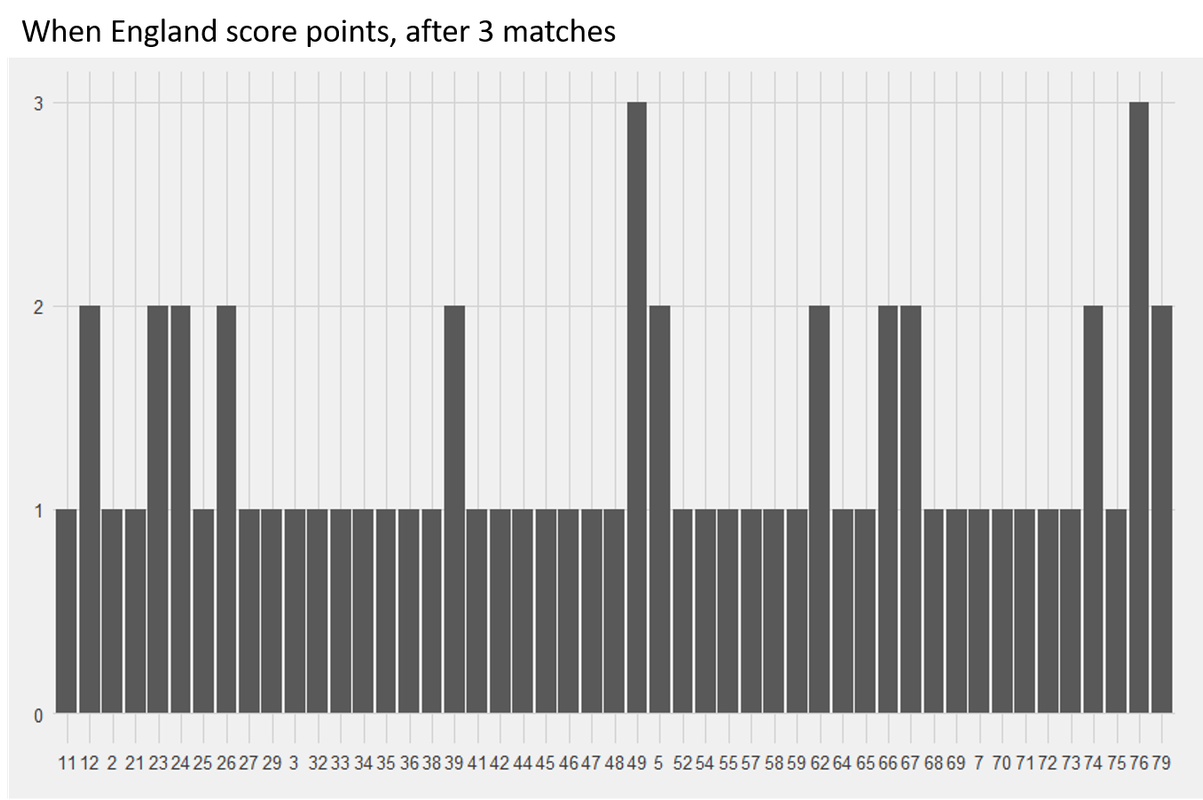
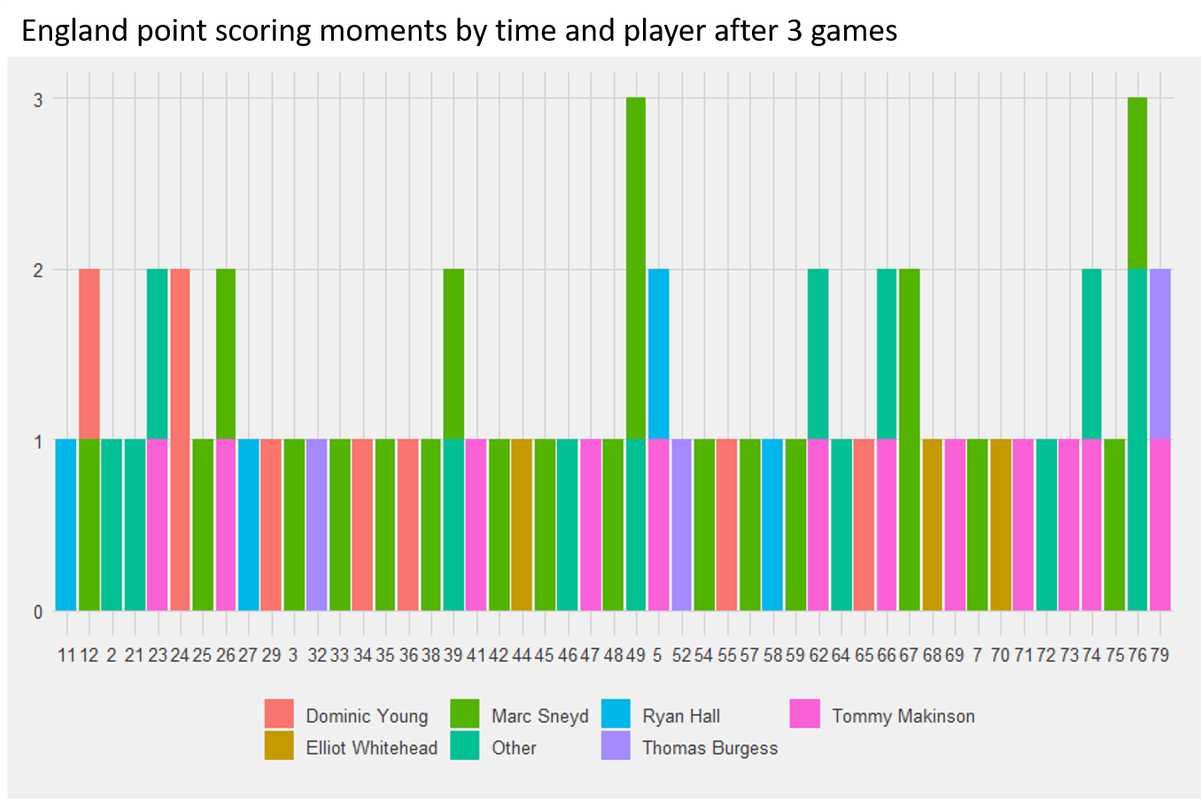
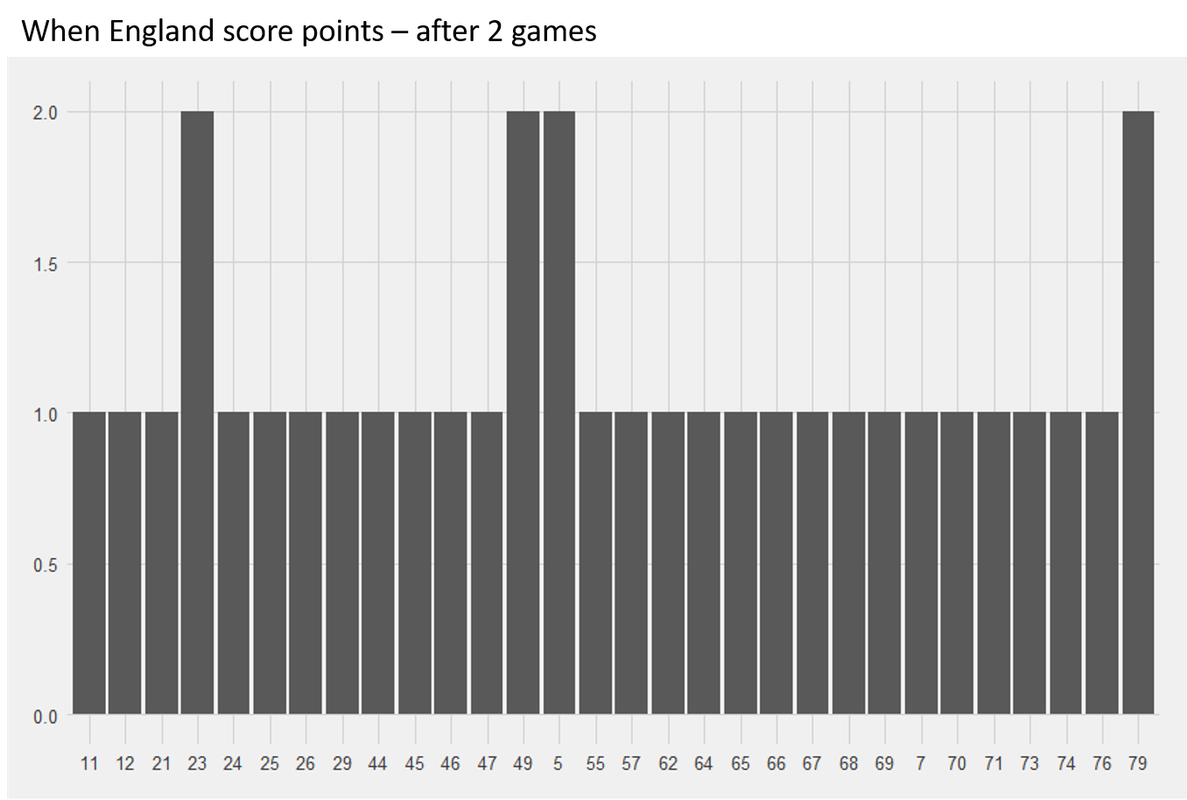
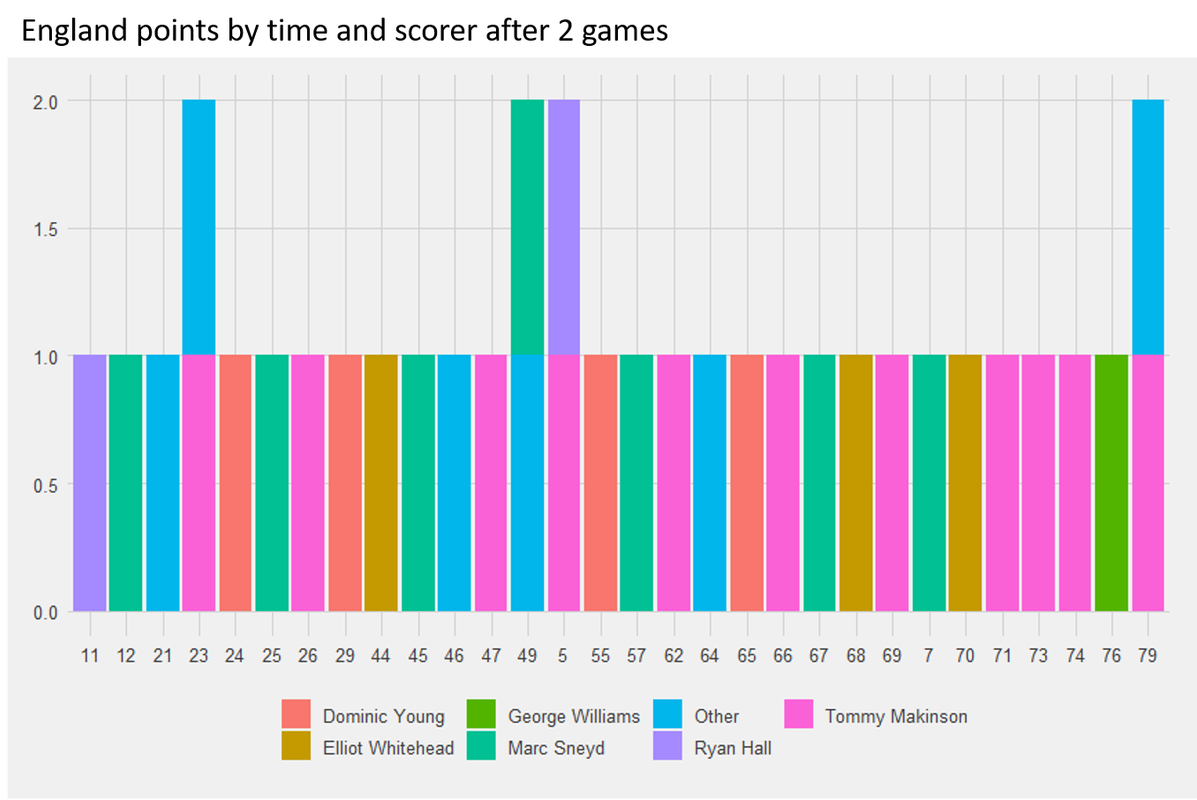
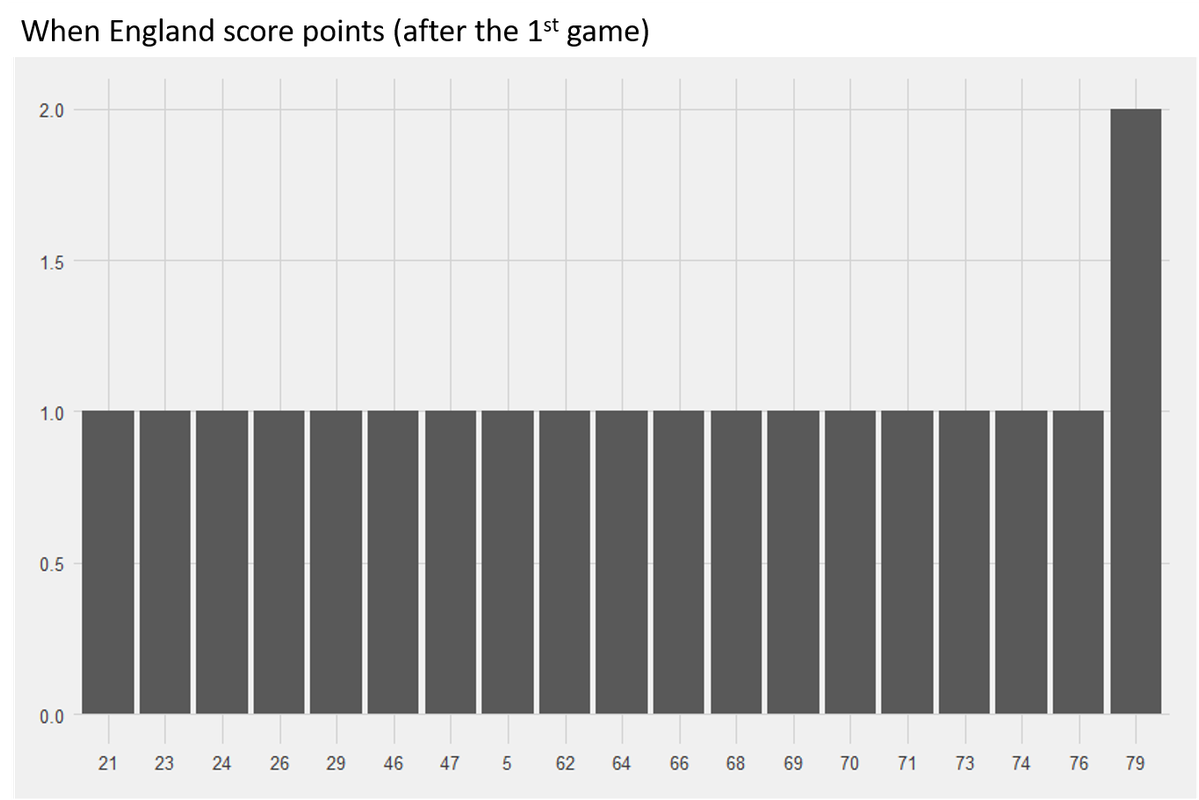
When do England score? 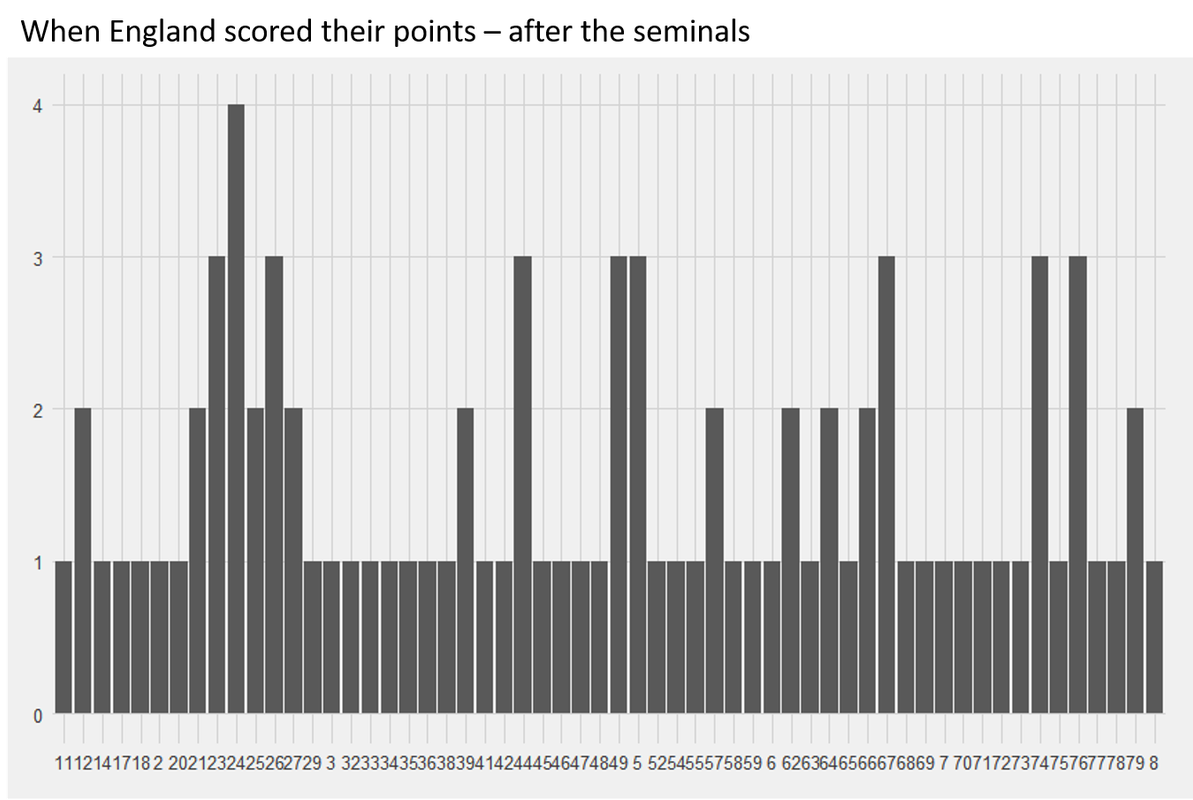
England point-scoring moments by time and player: 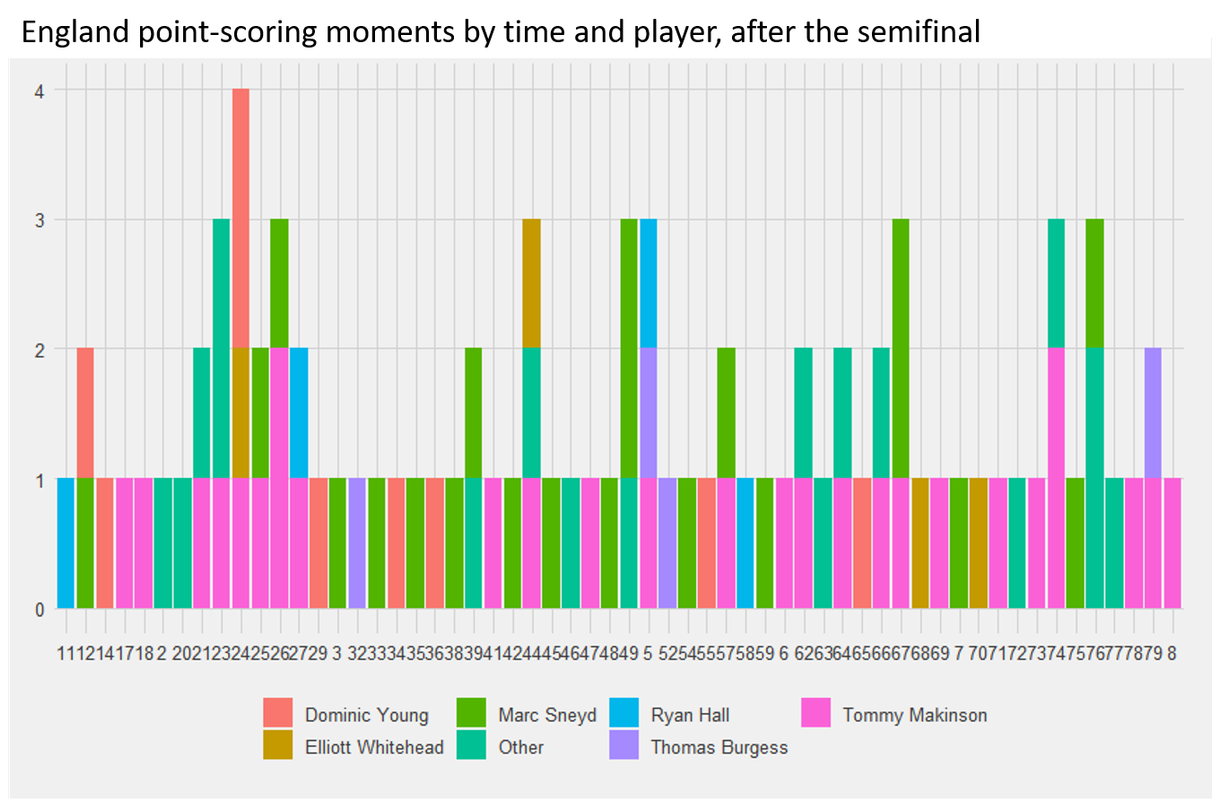
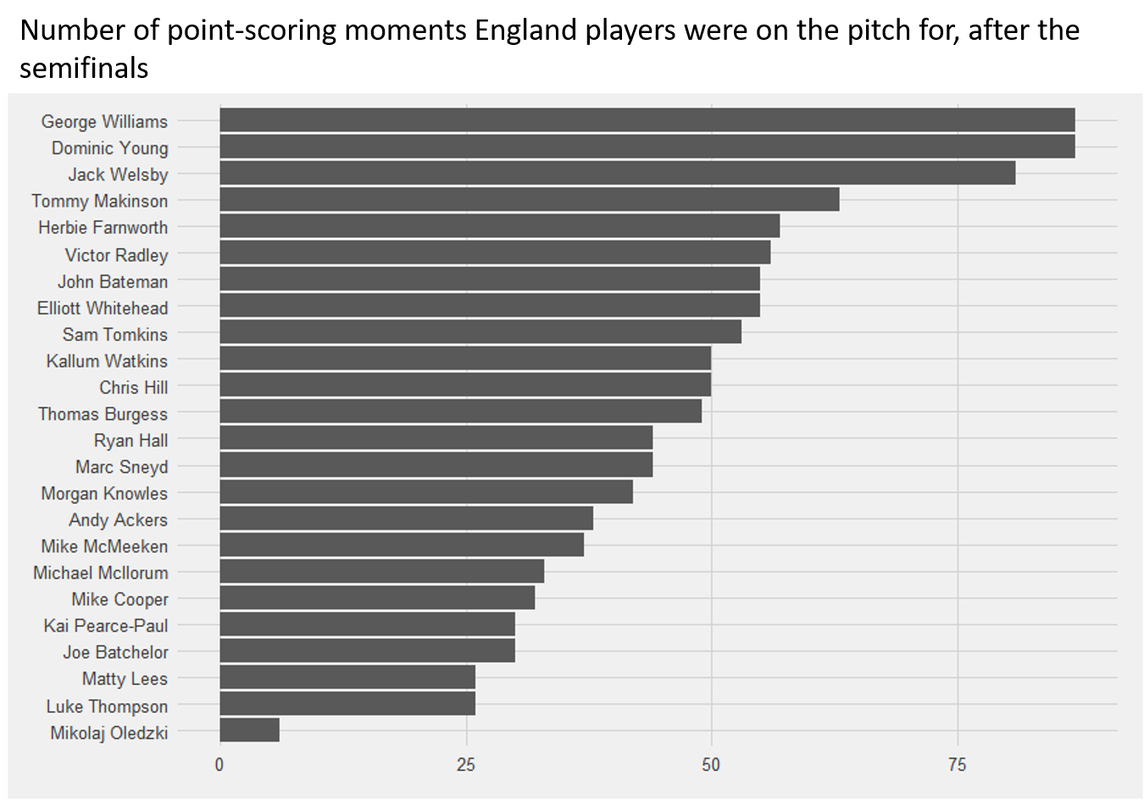
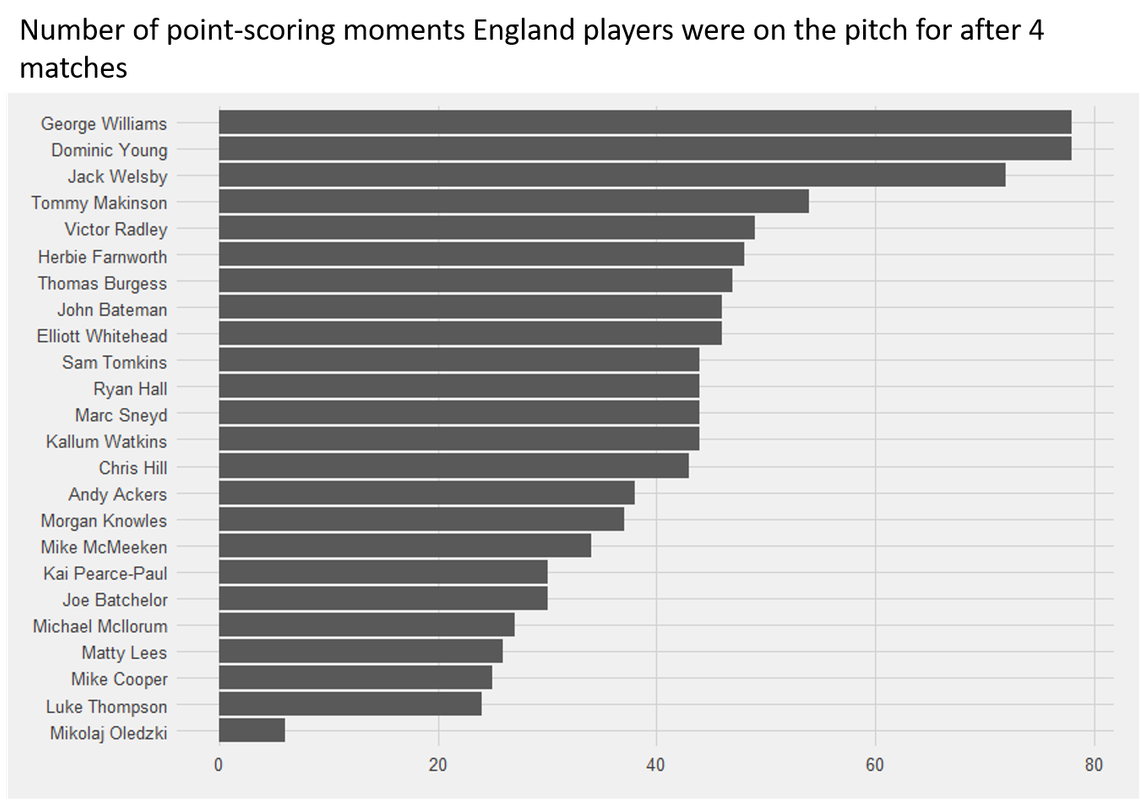
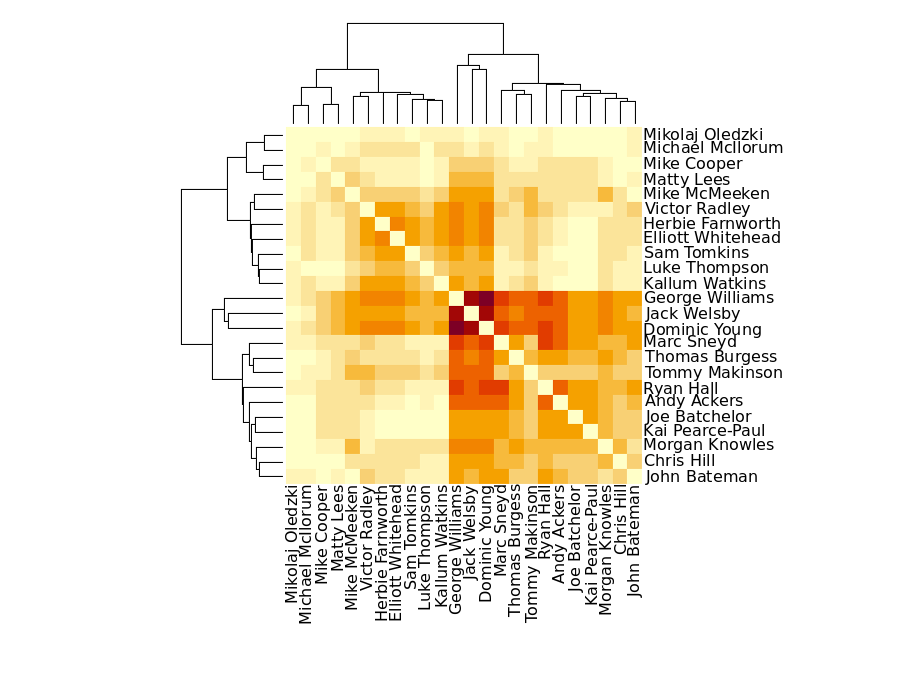
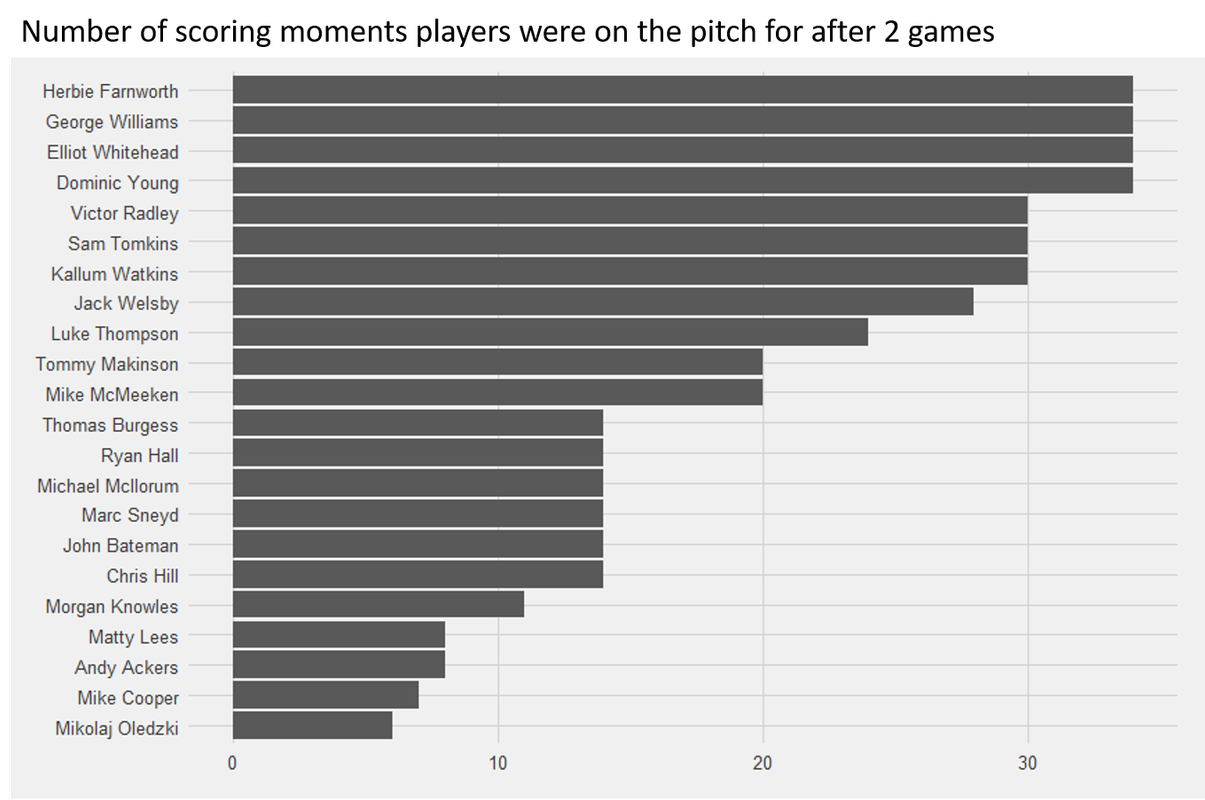
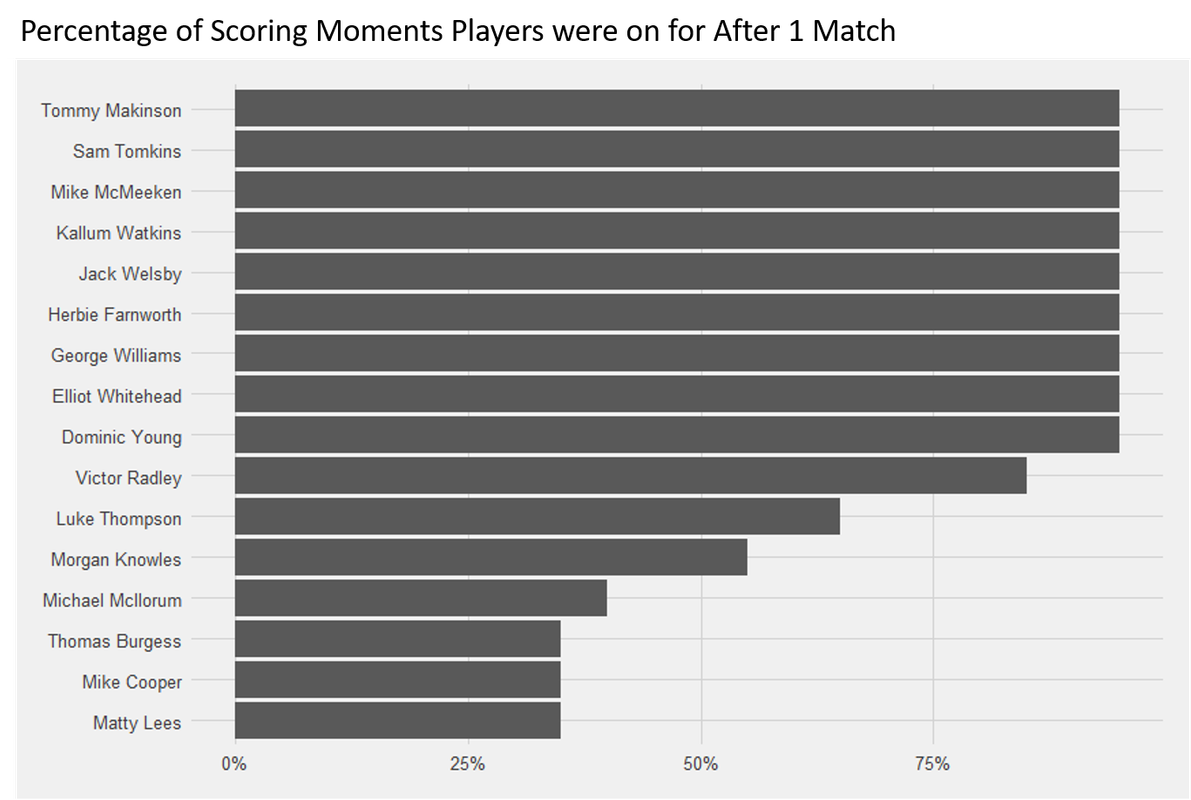
The "when are players on the pitch" view didn't quite work out, because Wane sometimes started players and sometimes used them as subs. The one player where anything did show up was Morgan Knowles, whose use as an impact player is really visible.
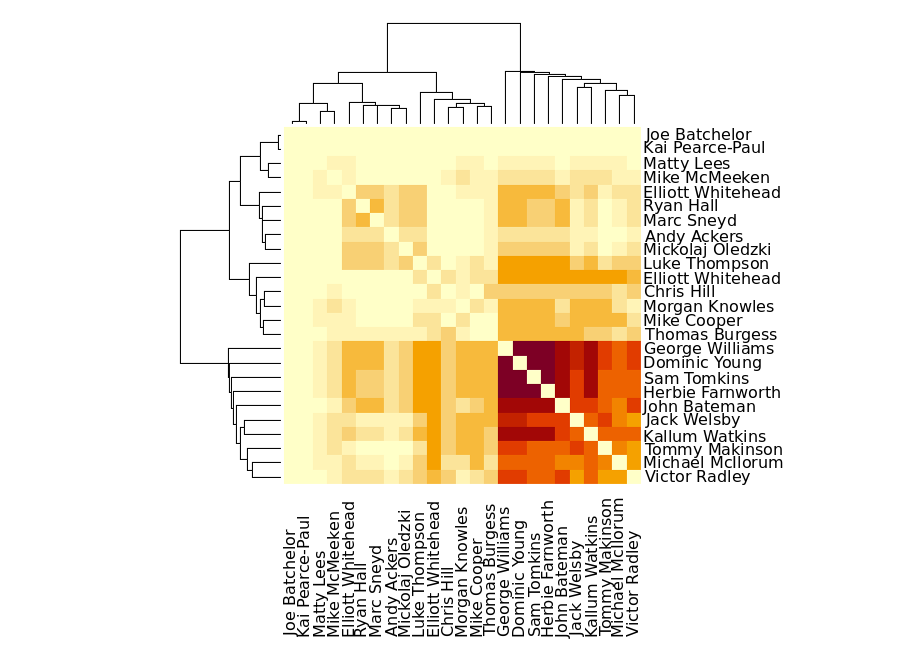
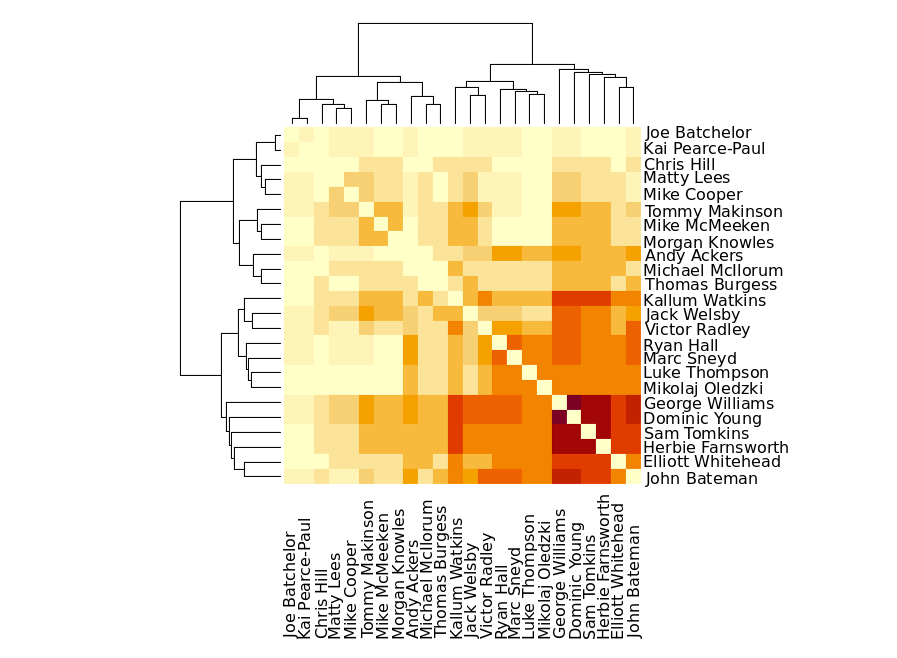
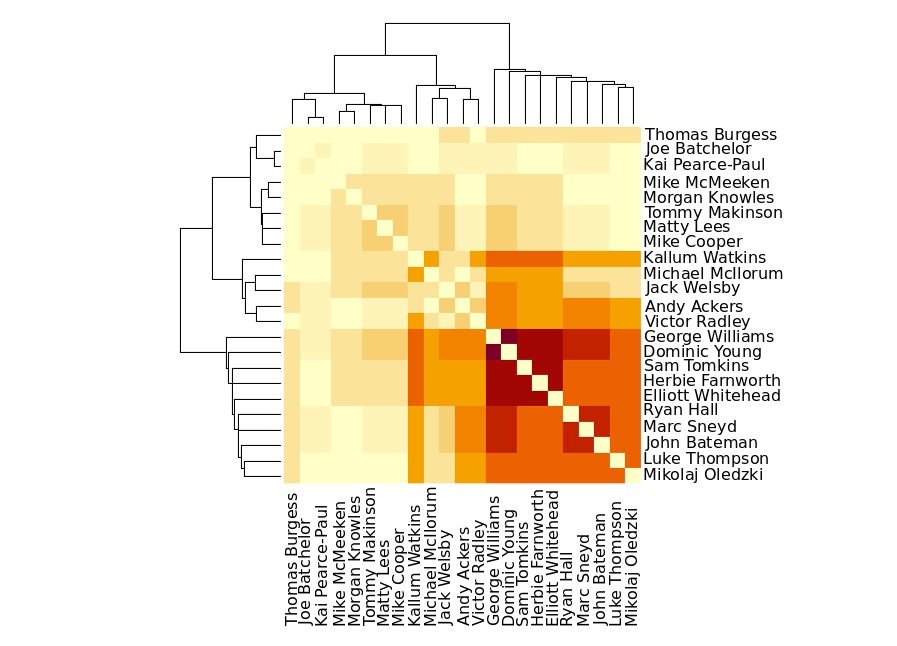
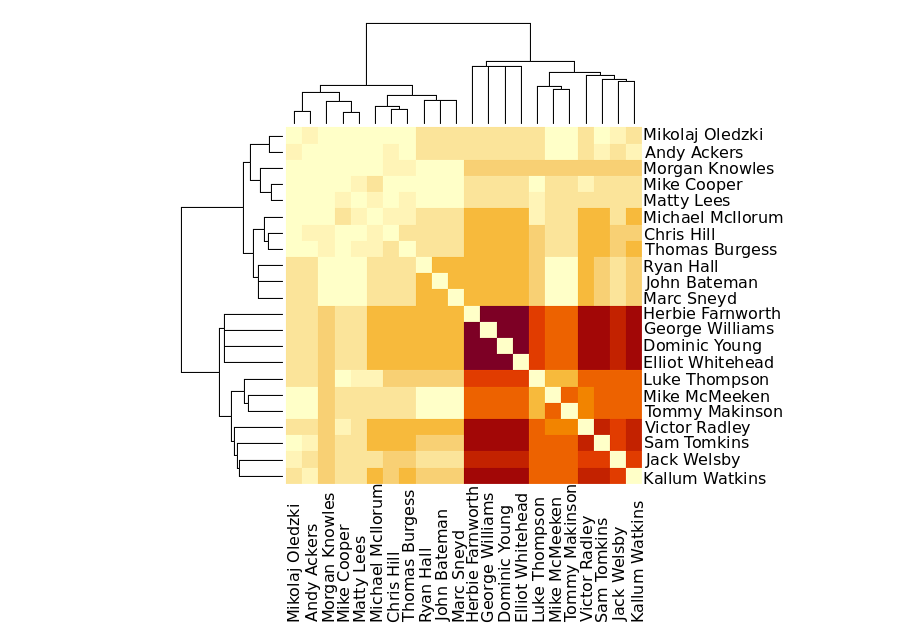
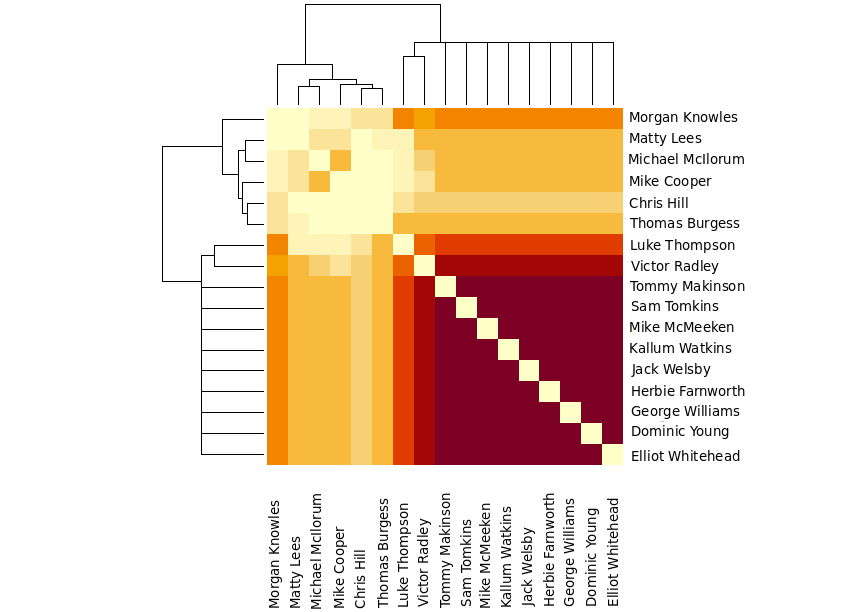
The matrix now looks like this:
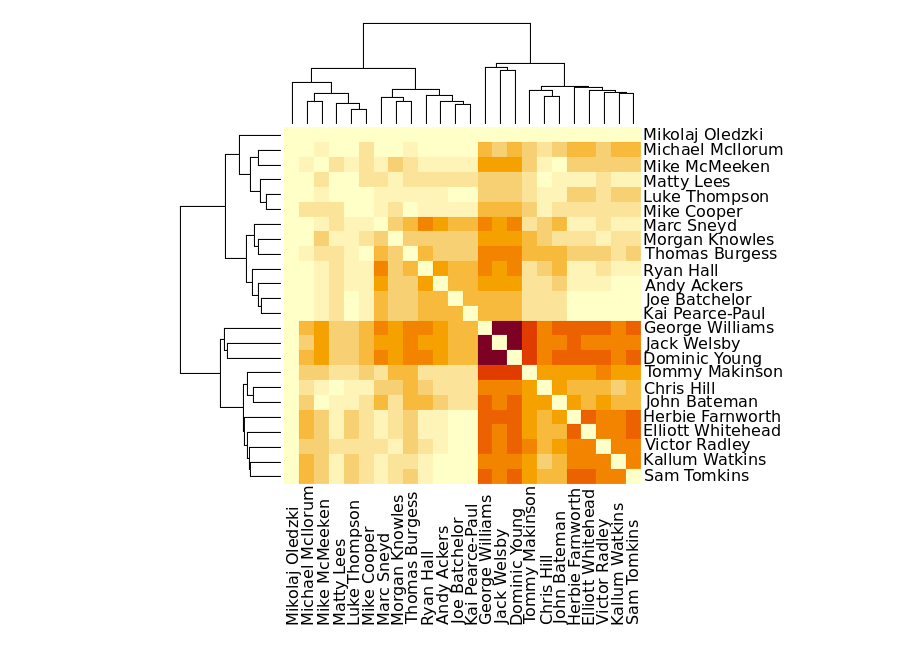
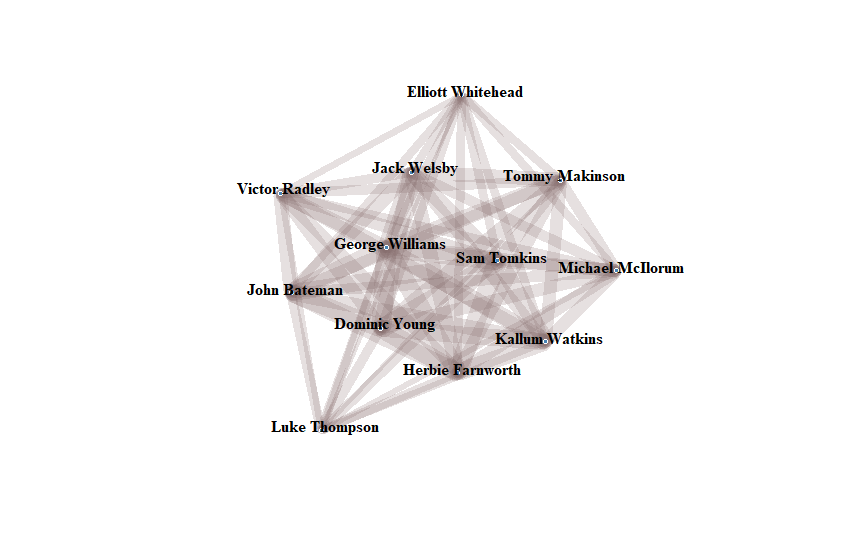
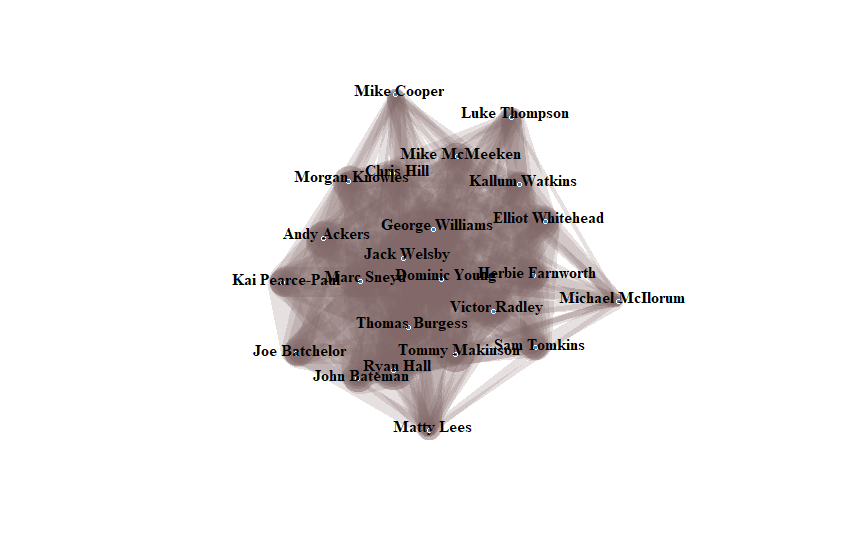
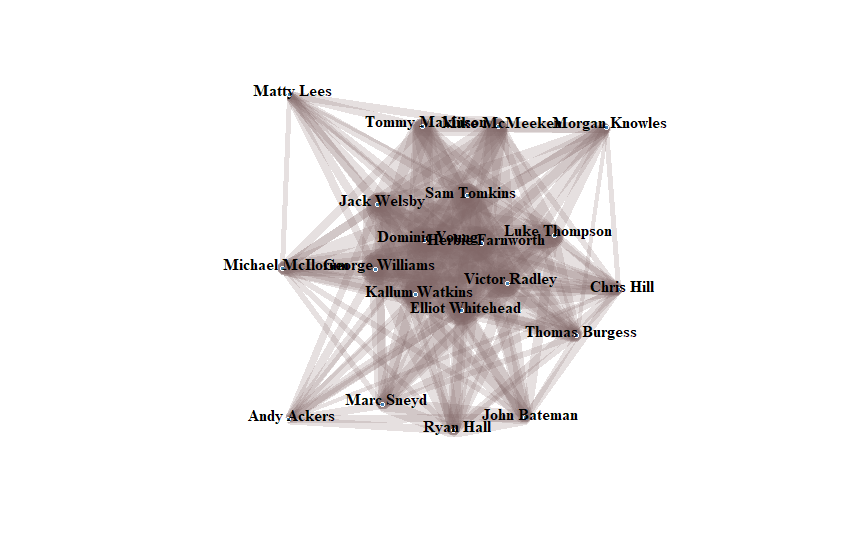
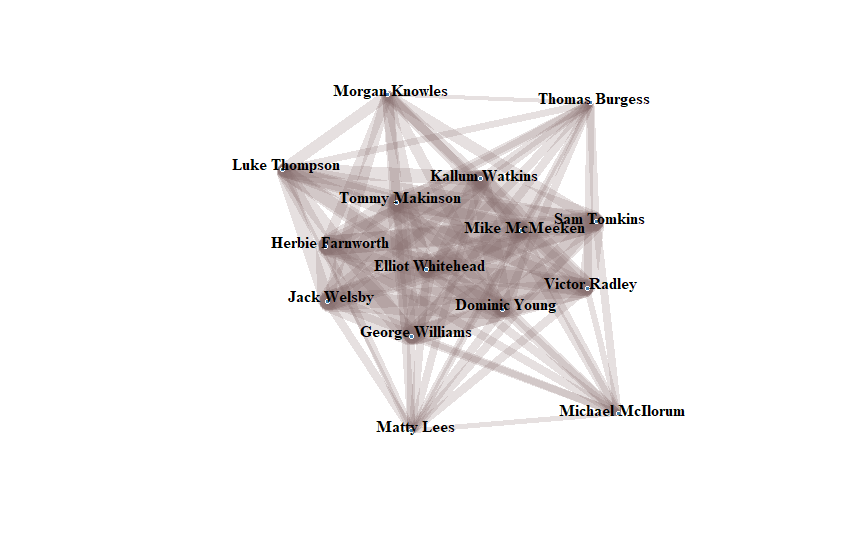
The network diagram looks like this:

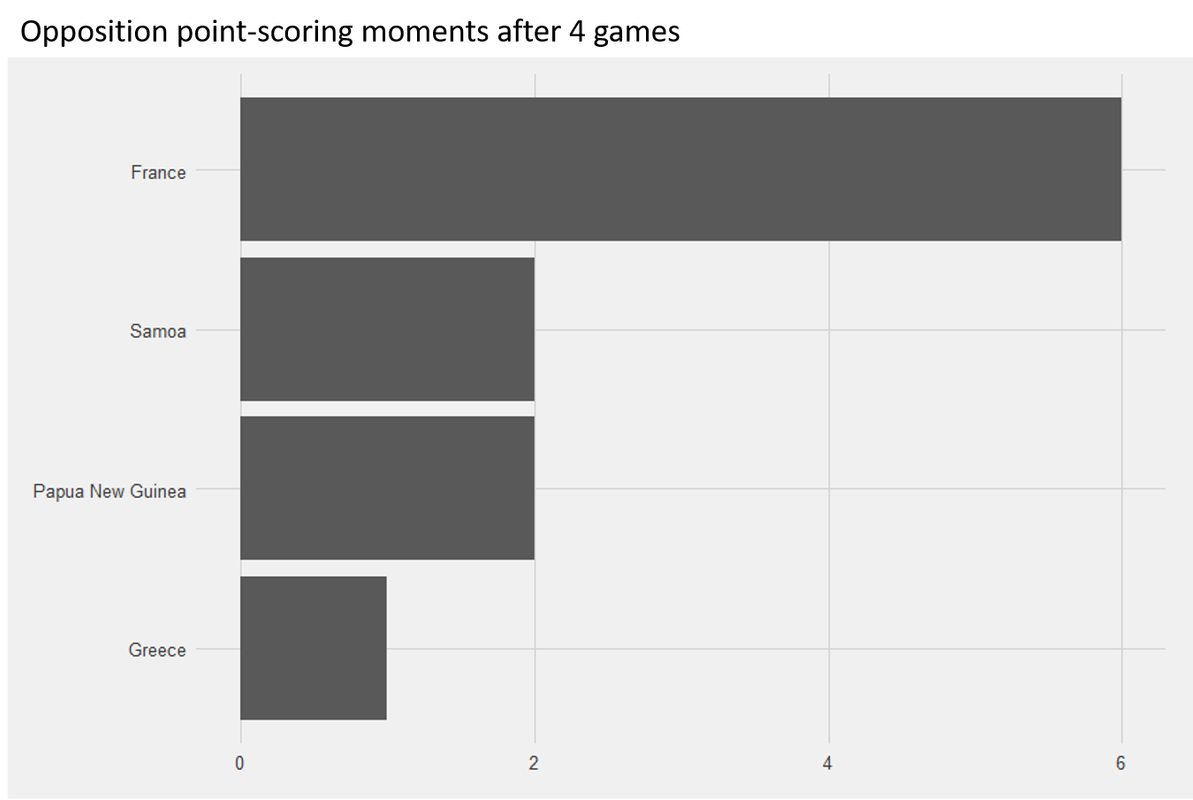
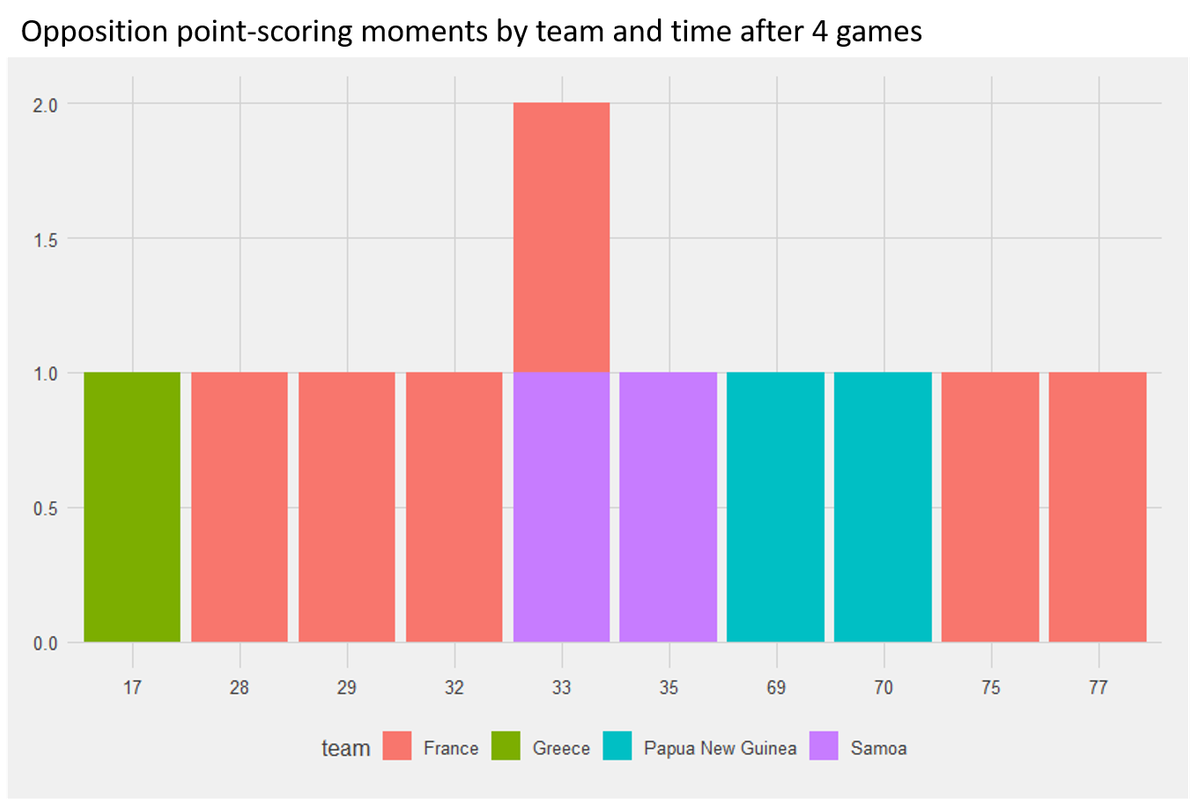
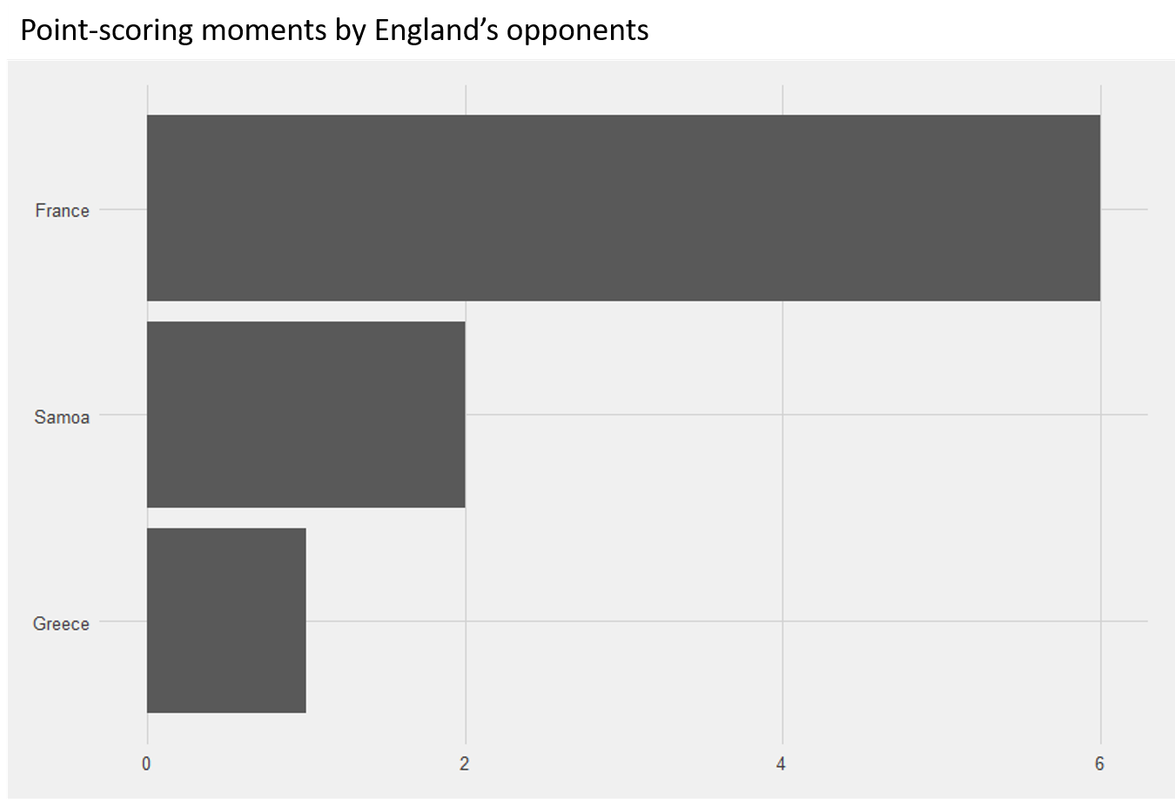
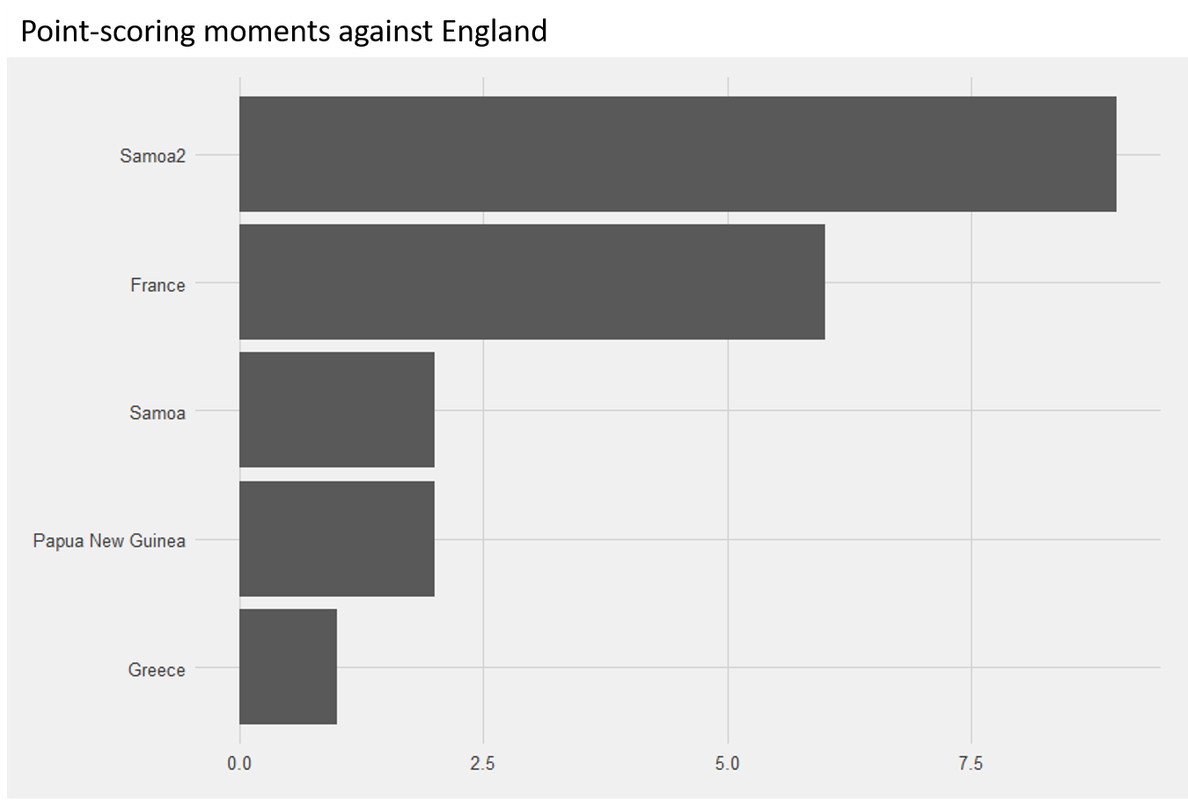
Points-scoring moments conceded by England:
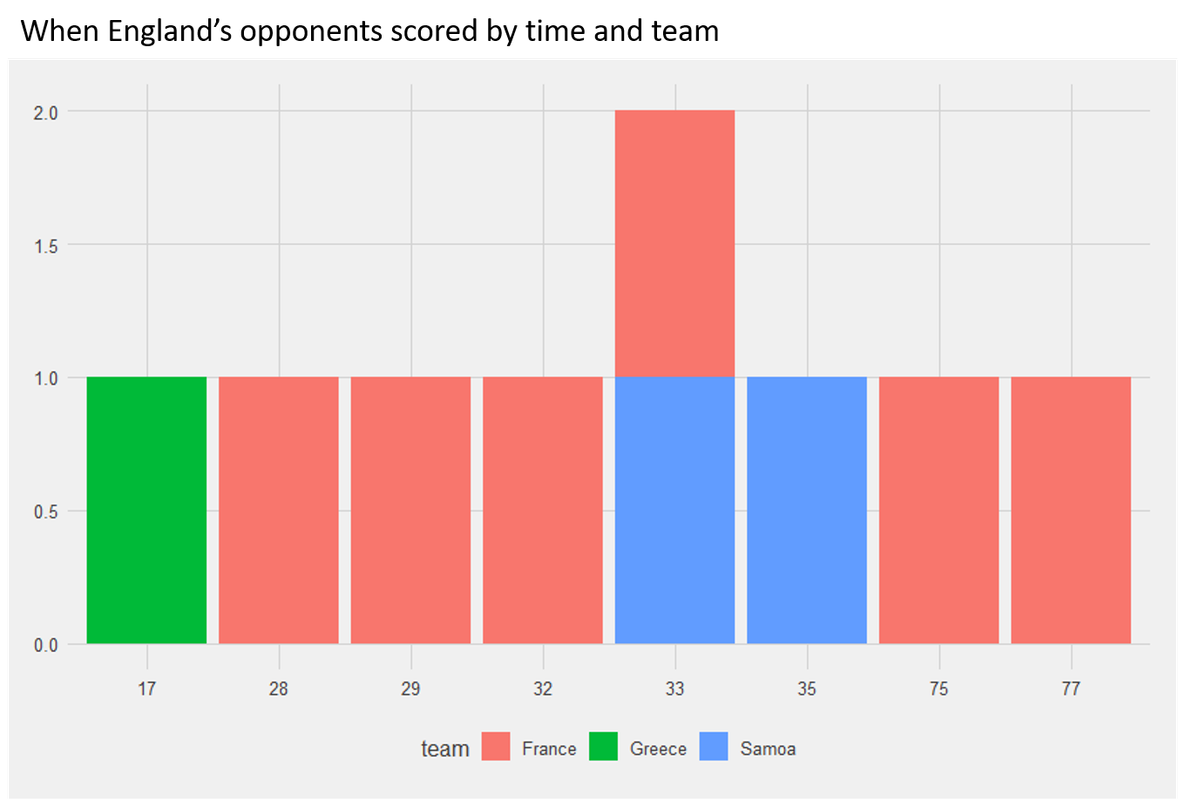
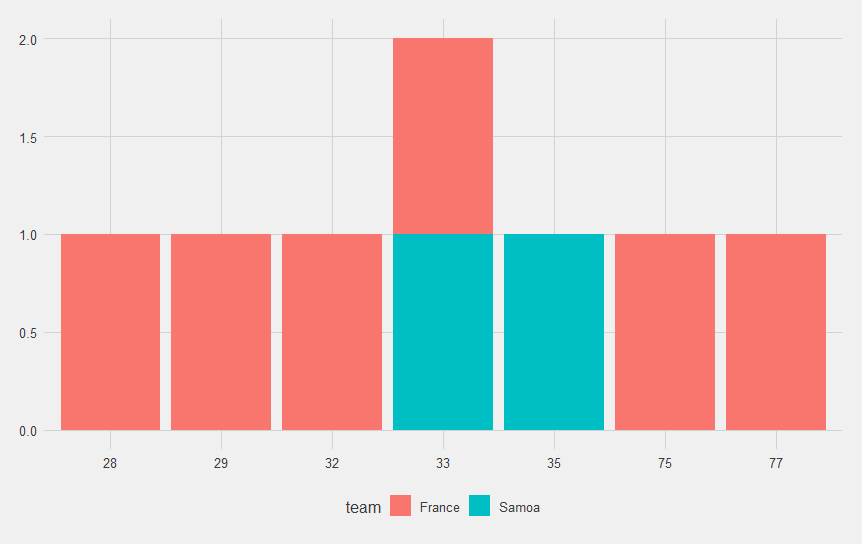
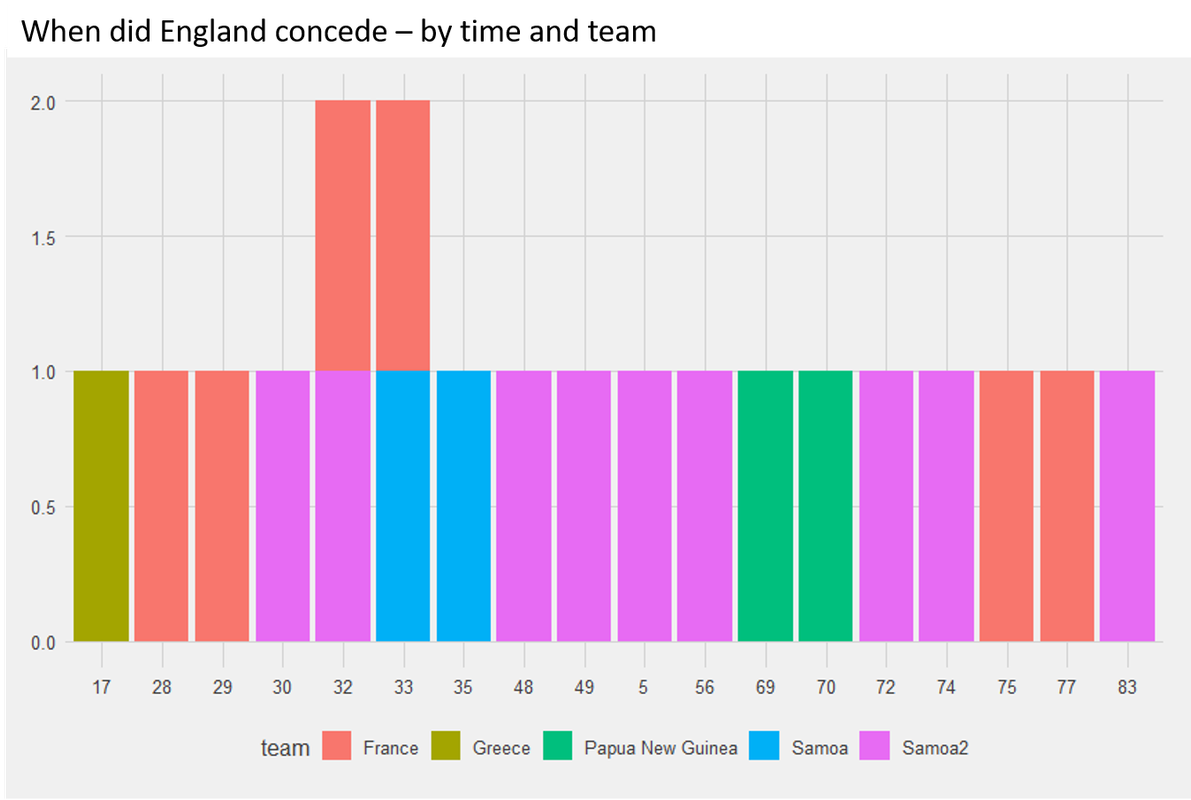
When do England concede points? 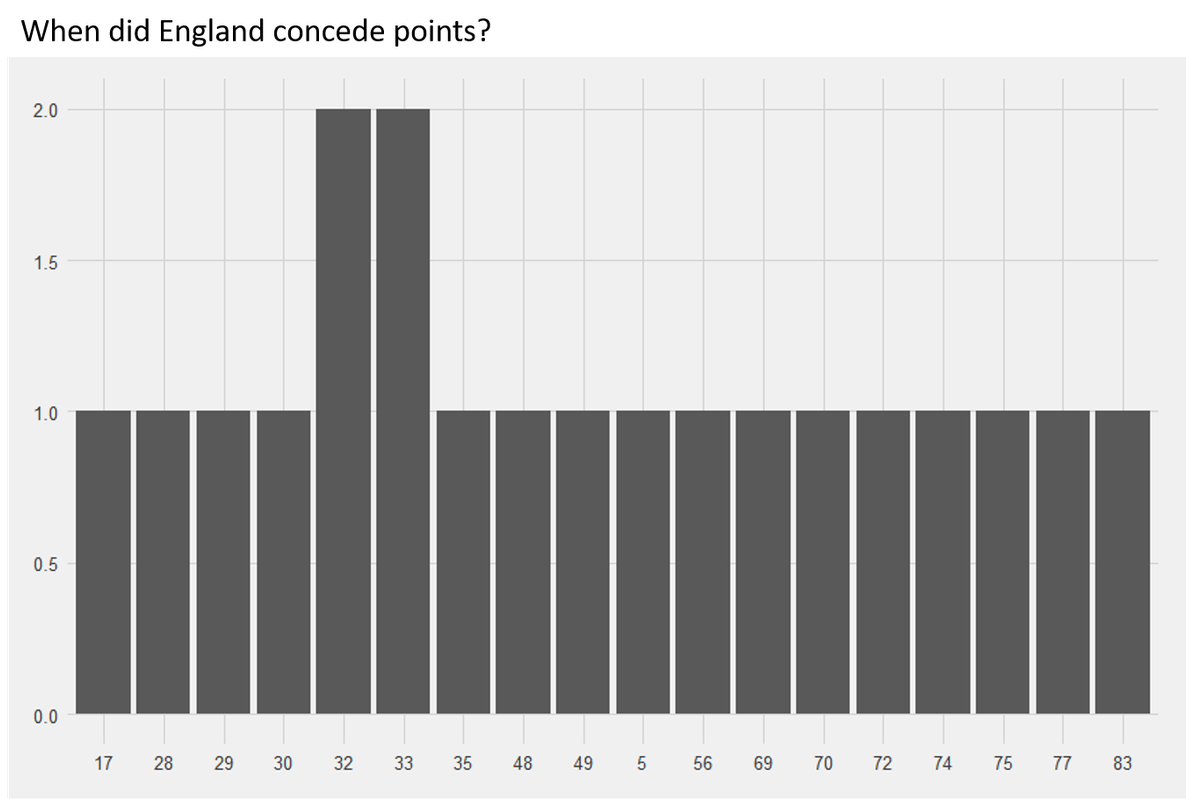
Point-scoring moments against England by time and team:
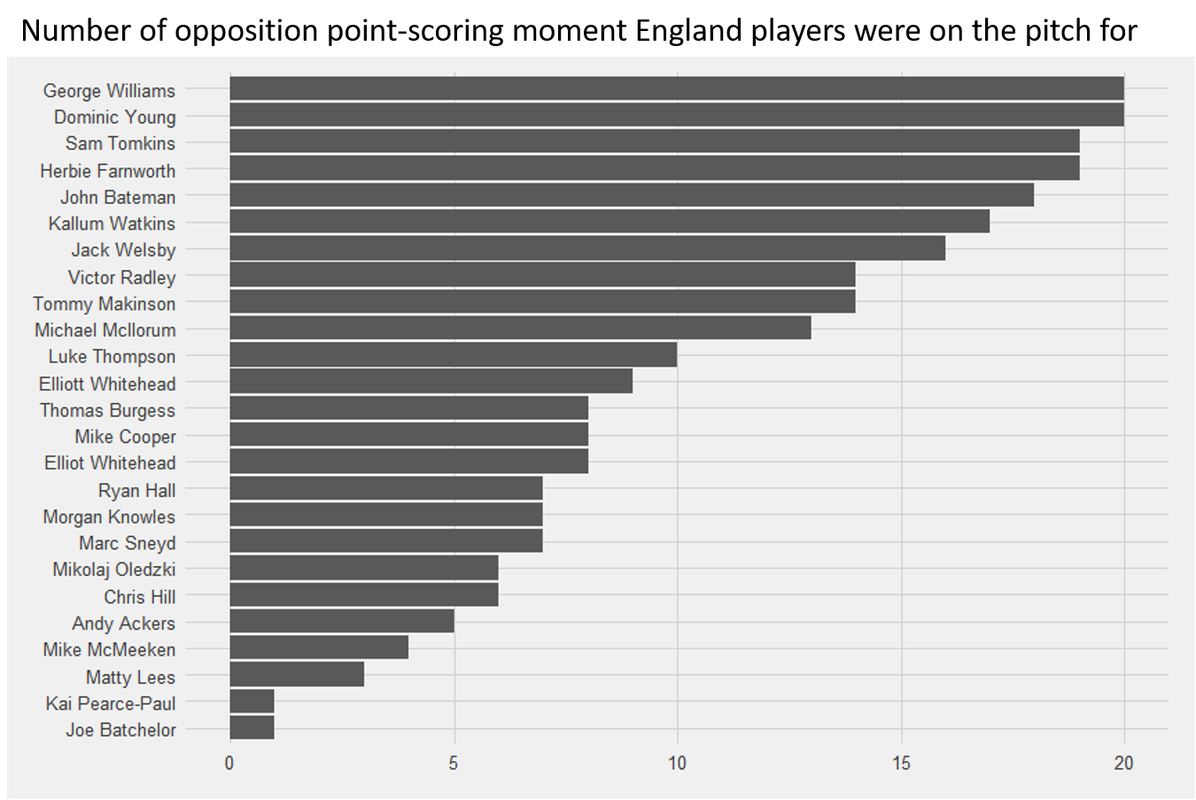
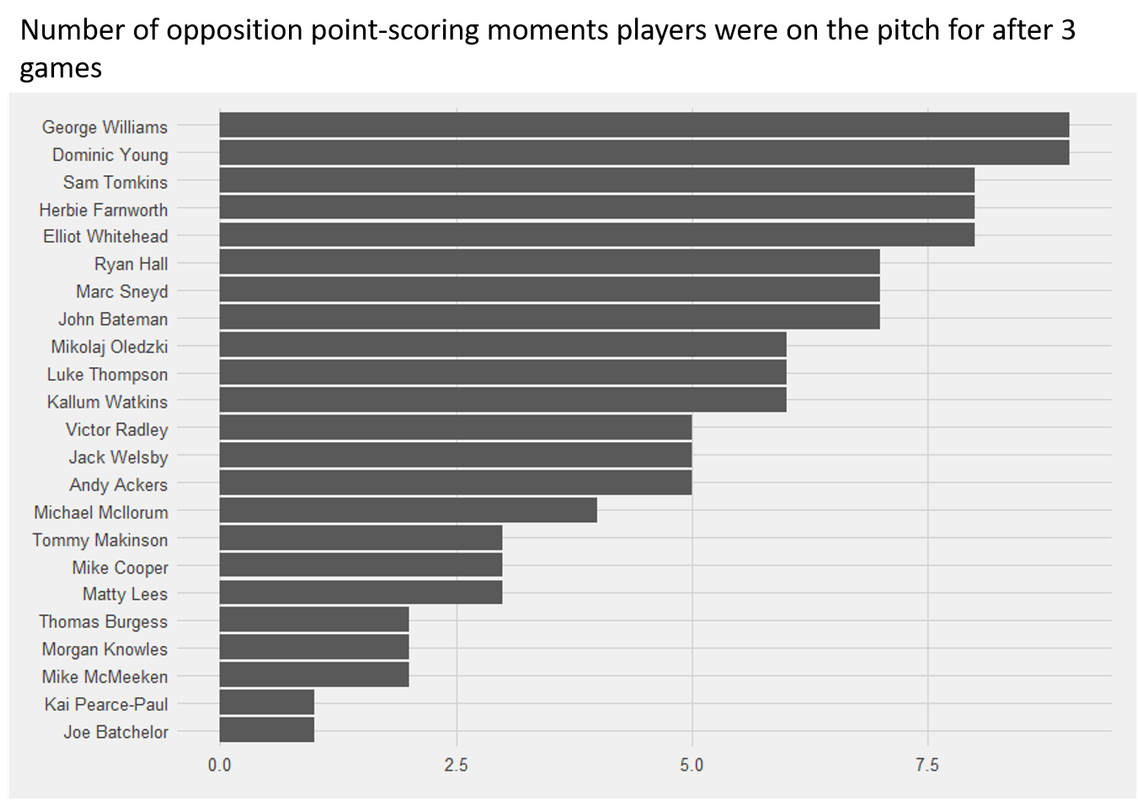
Number of opposition point-scoring moments England players were on the pitch for: