L will tell you that I tend towards the melodramatic when Saints lose to Castleford. I blow it out of all proportion. This is not because Castleford are not a good team. It's more that losing to them is almost always a sign of a Saints season that will not end well. (Seriously tempted to do a stats test on that to prove it's not just fan-madness)
Good things to take from this match:
Two new players got blooded in. The new players (and semi-new players) do give me hope for the future.
Sam Royle, first ever try for Saints - yay!
Things I am going to use to try to feel better:
It was all going so well until minute 50. It can go better again.
On to the season so far:
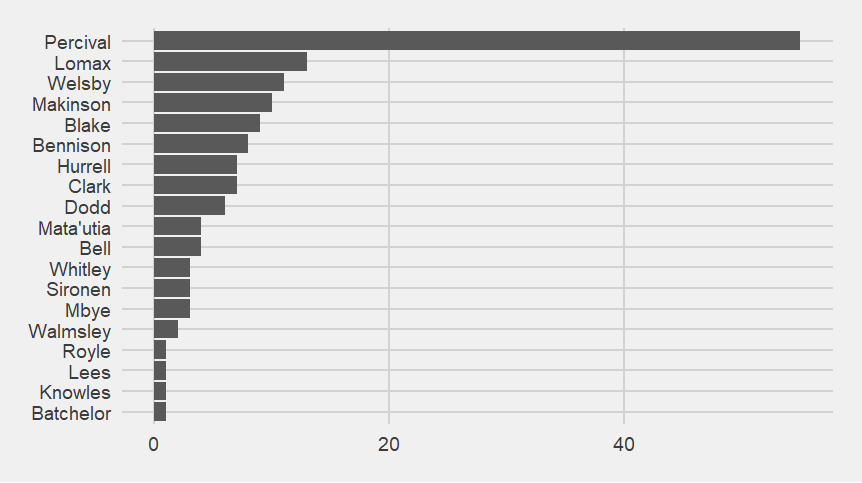
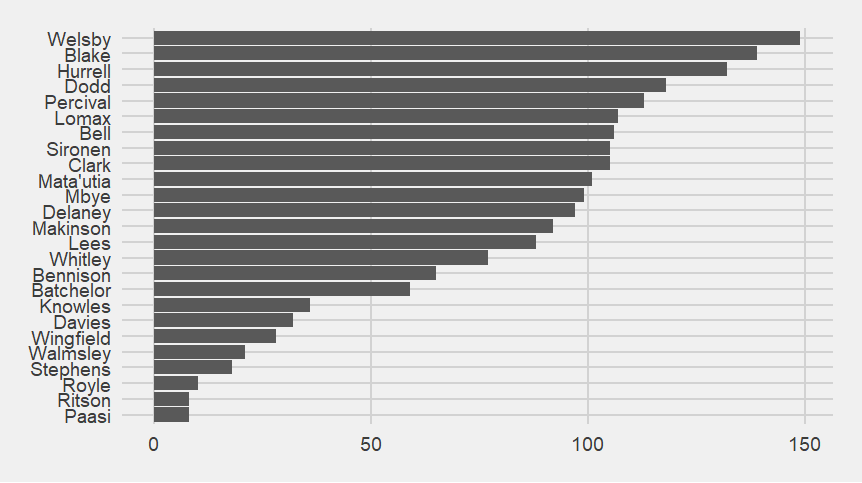
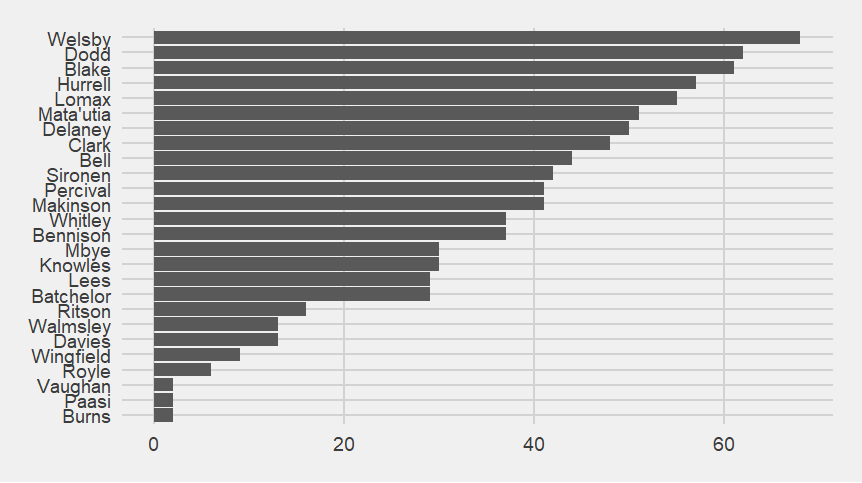
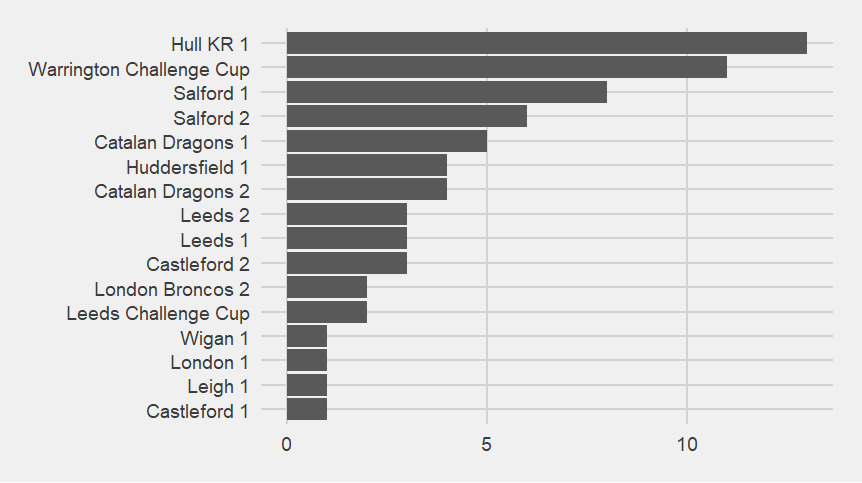 Saints have had 149 point-scoring moments and conceded 67, so the update on who is unexpectedly high on either "present when scoring" or "present when conceding" charts will have to wait until the next game.
 Interesting things.
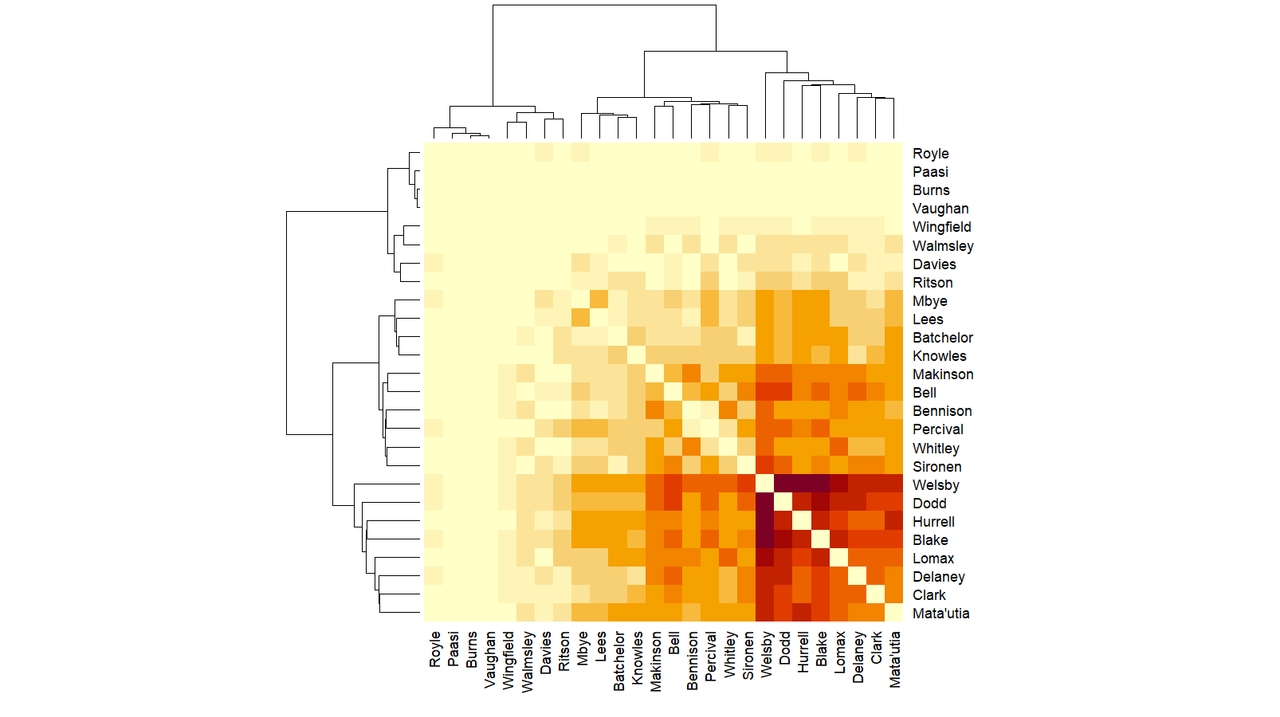
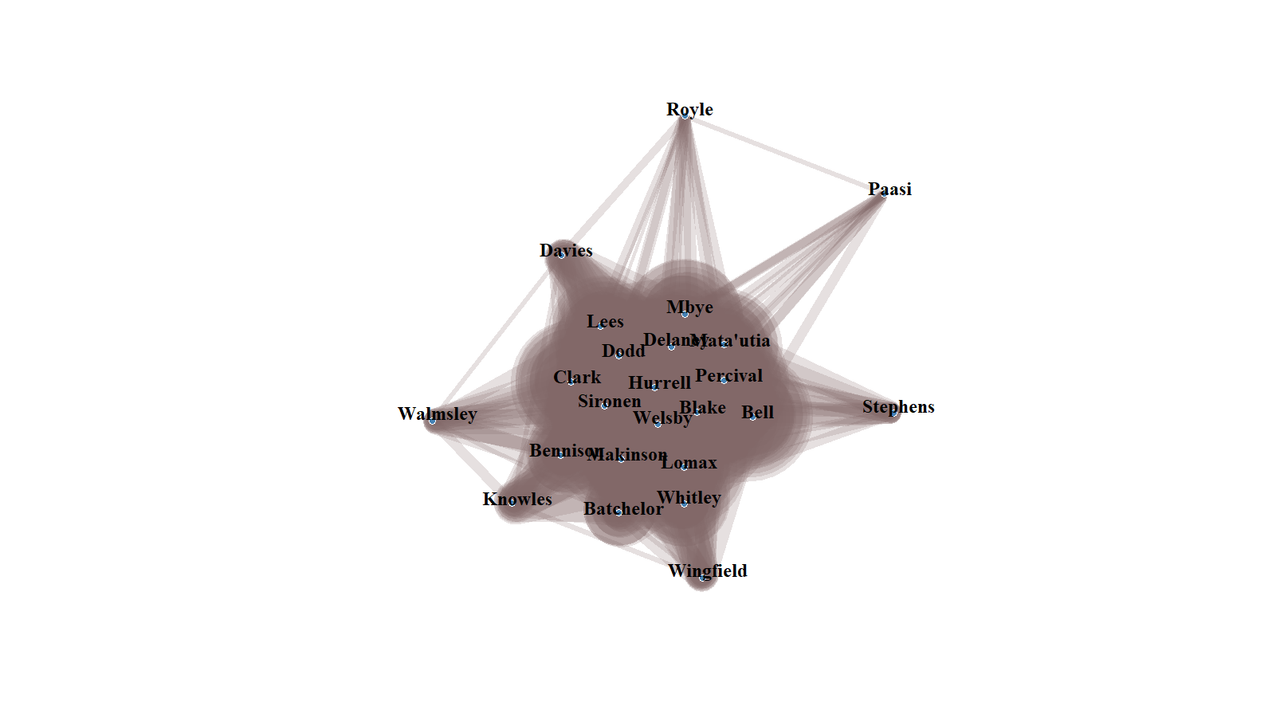
It's the cross points between the arms that are sticking out of the central blob that I don't understand. I presume it means that while Paasi, Royle, Davies, Walmsley, Knowles and Wingfield aren't often with the others when Saints score, when they are present, they are often with each other, with Wingfield and Knowles being closer to the central blob indicating that they are present for more of Saints's scoring moments.
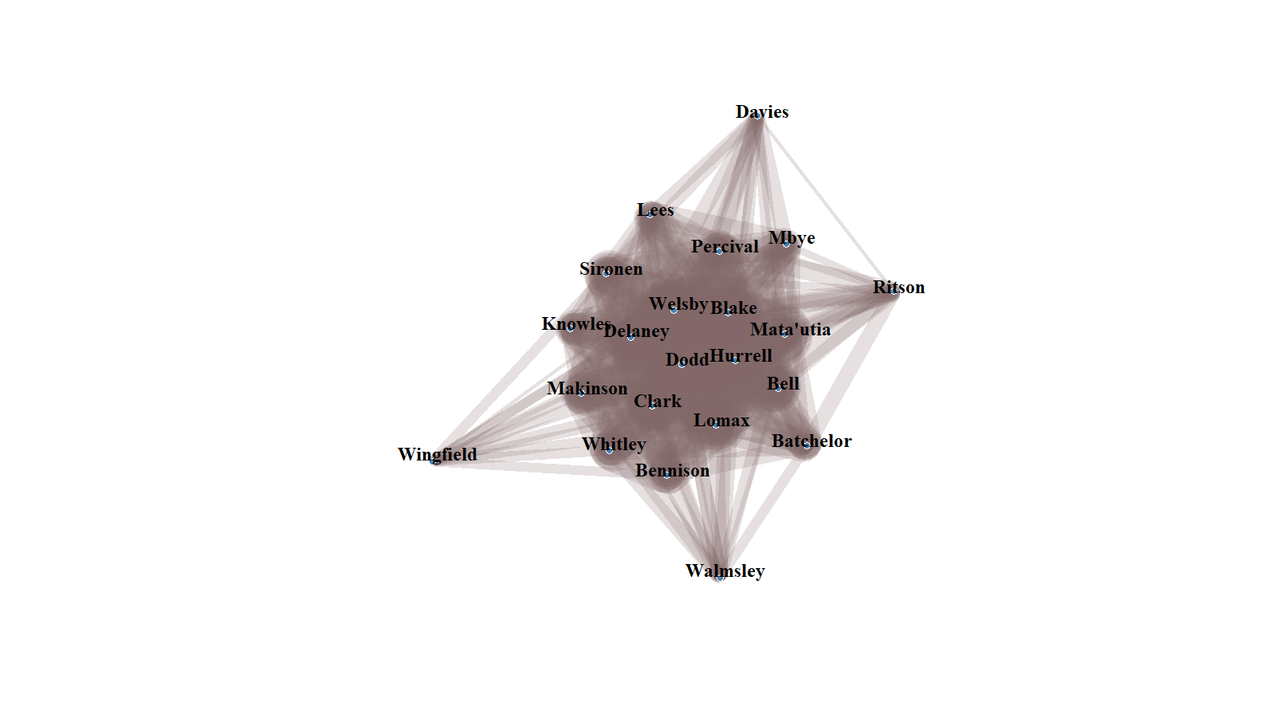
The "who is present when Saints concede" matrix is also interesting, divided as it is almost in four along each edge.



No comments:
Post a Comment