Group Stage:
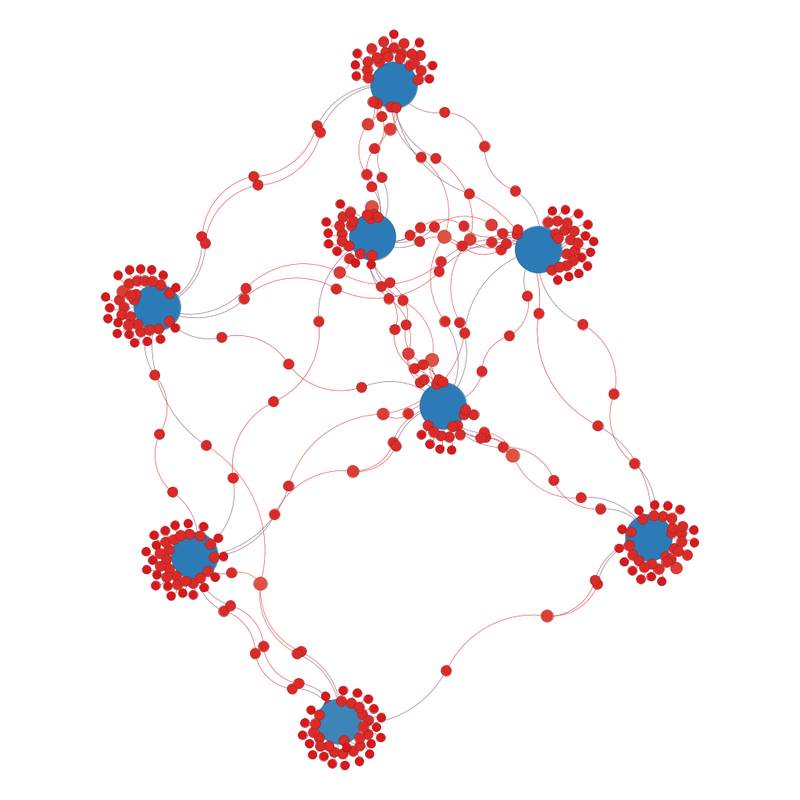
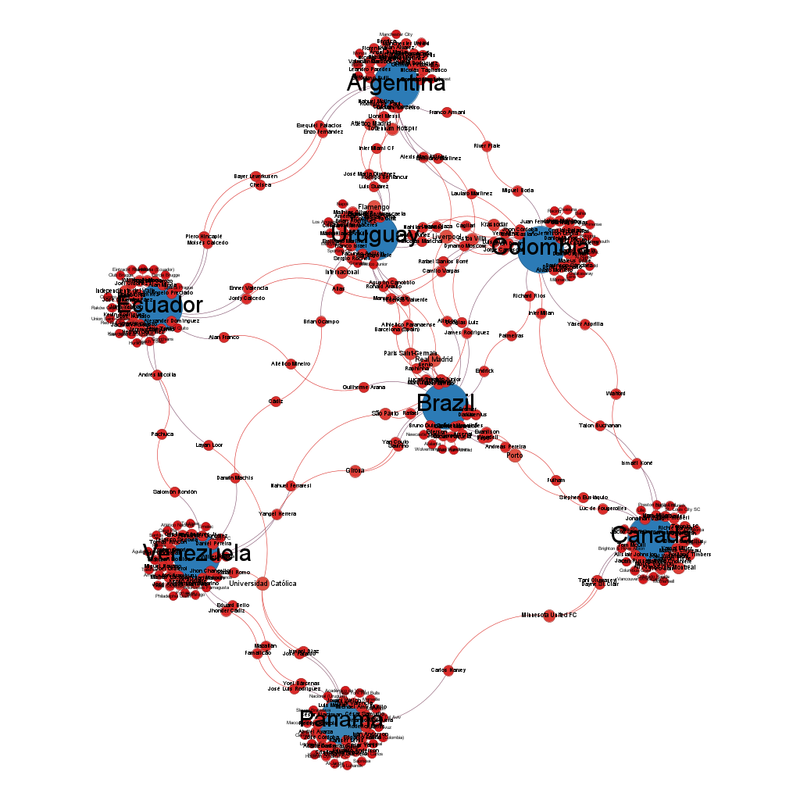
The Copa America network graph at the group stage is less tightly packed and inter-connected than the equivalent Euros graph
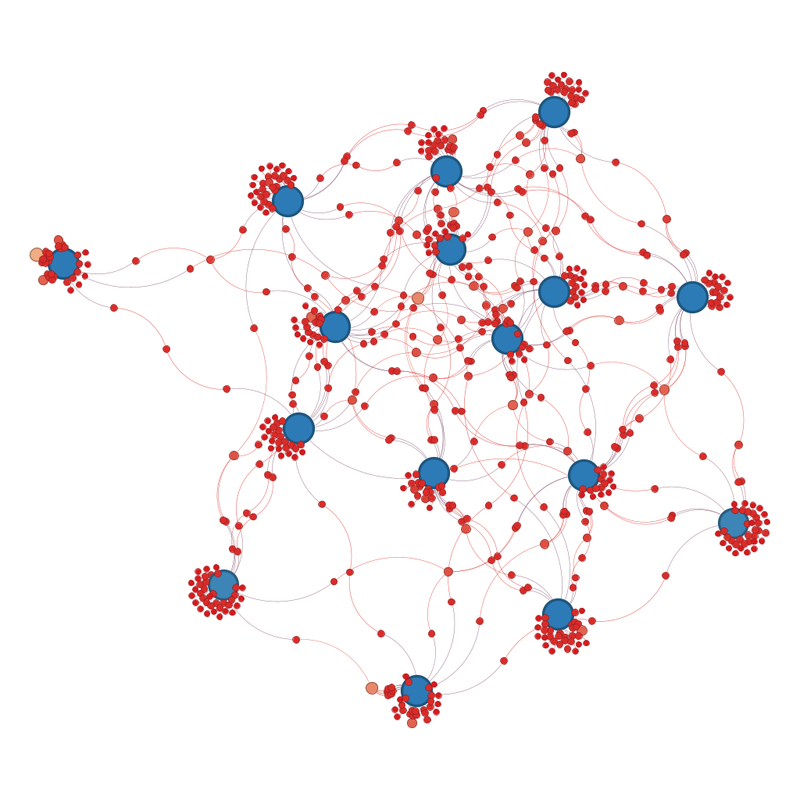
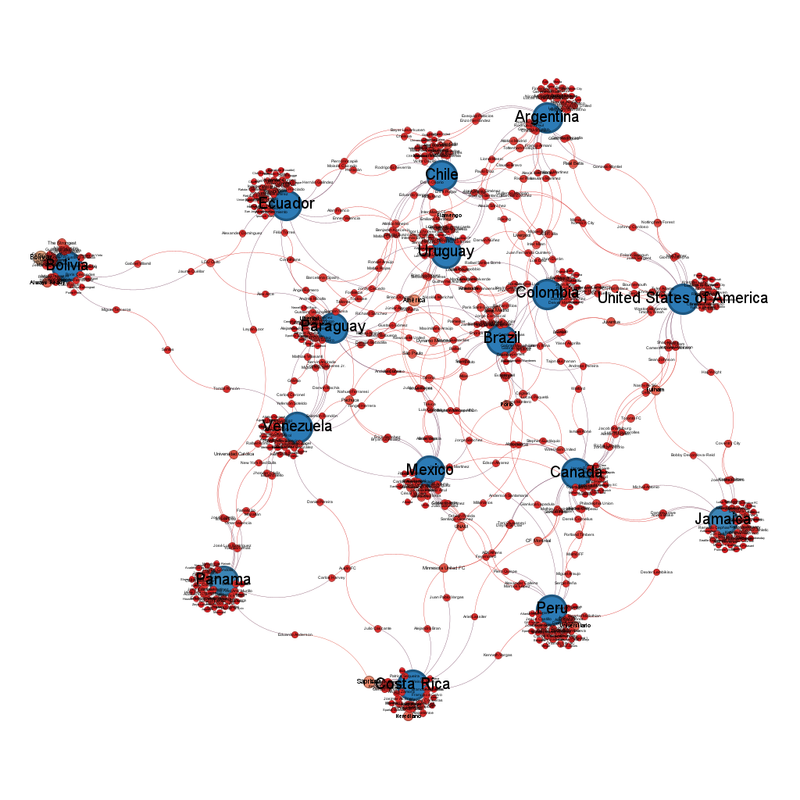
Argentina are not as central as I would have expected, and the US is more central than I would have expected.
Toluca are the club team closest to the centre.


Venezuela are probably the national team closest to the centre, but that's very "ish".
The club team with the most representatives are Bolivar with 9. They are followed by America and Saprissa with 7, then Universitario, Flamengo, Fulham, Porto, Always Ready, Libertad and Herediano with 5.
Jamaica are the odd team out because they only have a squad of 25, compared to everyone else's squad of 26.
All national teams have at least one player playing in their home league.
If the outlying teams predict the teams that are going out, I would expect Bolivia, Panama, Costa Rica, Peru and Jamaica to be among the teams that went out after the group stages, with the others being USA, Argentina and Chile. And I don't think Argentina will be out.
Quarterfinals:
The teams that went out were Chile, Peru, Mexico, Jamaica, United States, Bolivia, Costa Rica and Paraguay.
The graph predicted 6/8 teams that went out. It included 2/3 of the hosts of the next World Cup which does not bode well.
Canada were not the one of the three that I was expecting to survive (are Canada better than we think?).
The club teams with the most players left in are:
4 = Liverpool, Flamengo, Porto, Universidad Catolica, Real Madrid
3 = Atletico Madrid, Tottenham Hotspur, Aston Villa, Minnesota United FC, CF Montreal, Independiente del Valle, Internacional, Sao Paulo, Girona, Paris Saint-Germain and Krasnodar
Brazil are the national team closest the centre and Sao Paulo are the club team closest.
Guessing from which team are the furthest from the centre, Panama are likely to go out. With the others it's less easy to tell, but I would expect Uruguay and Brazil to get through.
Semifinals:
I know Uruguay are good, so I don't think Brazil losing to them is time to declare the end of the world but ... Brazilian football in crisis?
Canada getting through to the semifinals was also unexpected.
What do the semifinal diagrams look like?
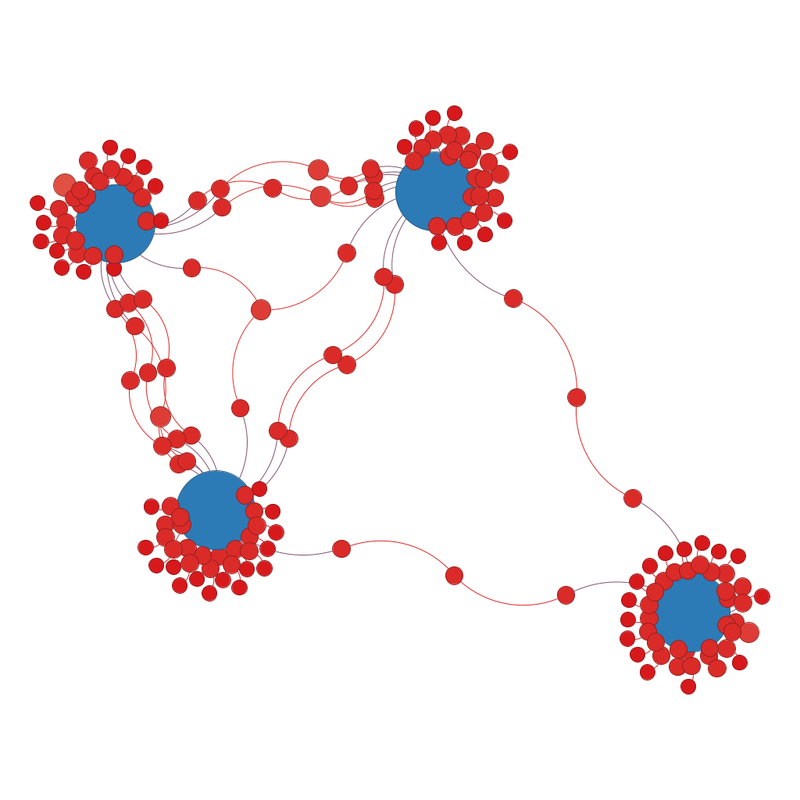
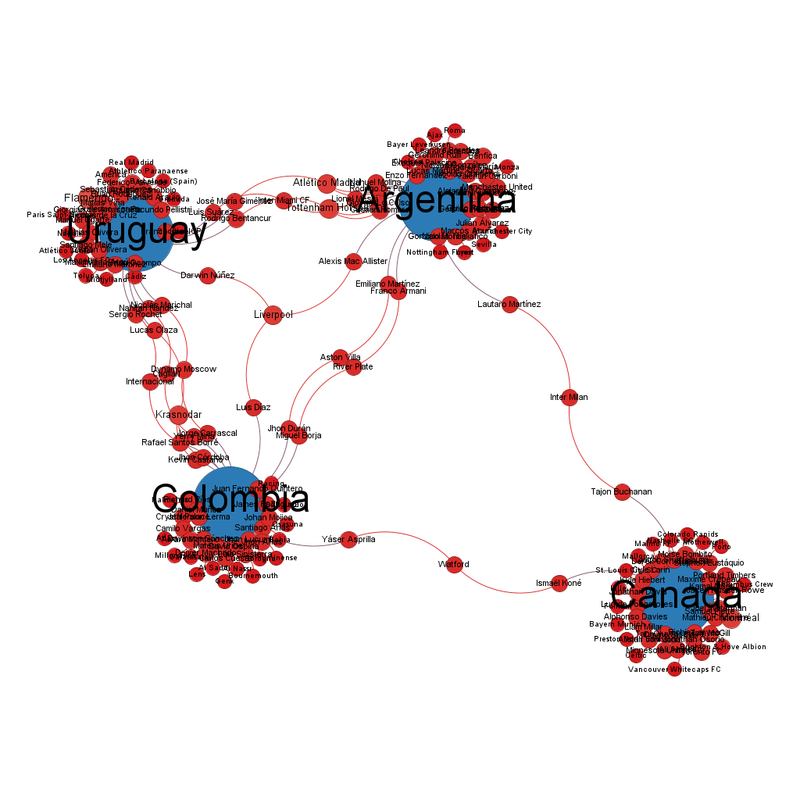
Colombia are the team closest to the centre, with River Plate the club closest to the centre.
The diagram is not positive for Canada's chances in the semifinals.


Finals:
After a semifinal that nearly ended in a riot - https://www.infobae.com/colombia/deportes/2024/07/11/con-pelea-en-la-tribuna-y-lagrimas-de-james-y-luis-diaz-asi-termino-la-semifinal-entre-colombia-y-uruguay/ (I am not sure how it is Suarez's fault but ...), the final had Argentina winning.
I won't say it looked like yet another tournament when it felt like the organisers were bending over backwards to help Argentina to win but ... (I will never forgive FIFA for making me agree with the Croatian football federation).
It also featured poor organisation and celebrations that people had to apologise for - https://en.wikipedia.org/wiki/2024_Copa_Am%C3%A9rica#Argentine_celebrations
Hopefully neither of these will be repeated at World Cup 2026.
The diagram before the final looked like this.
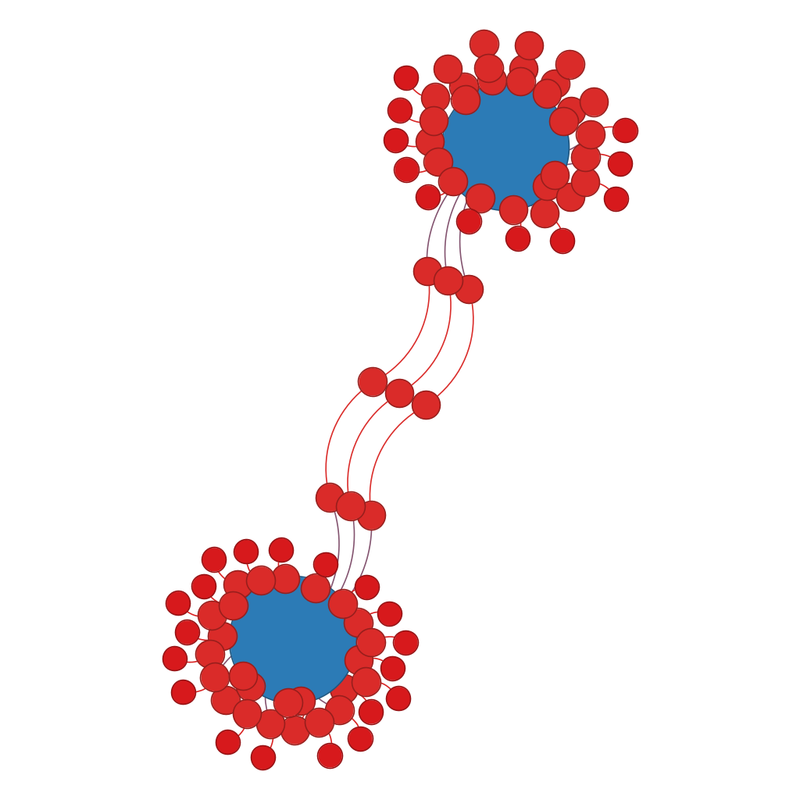
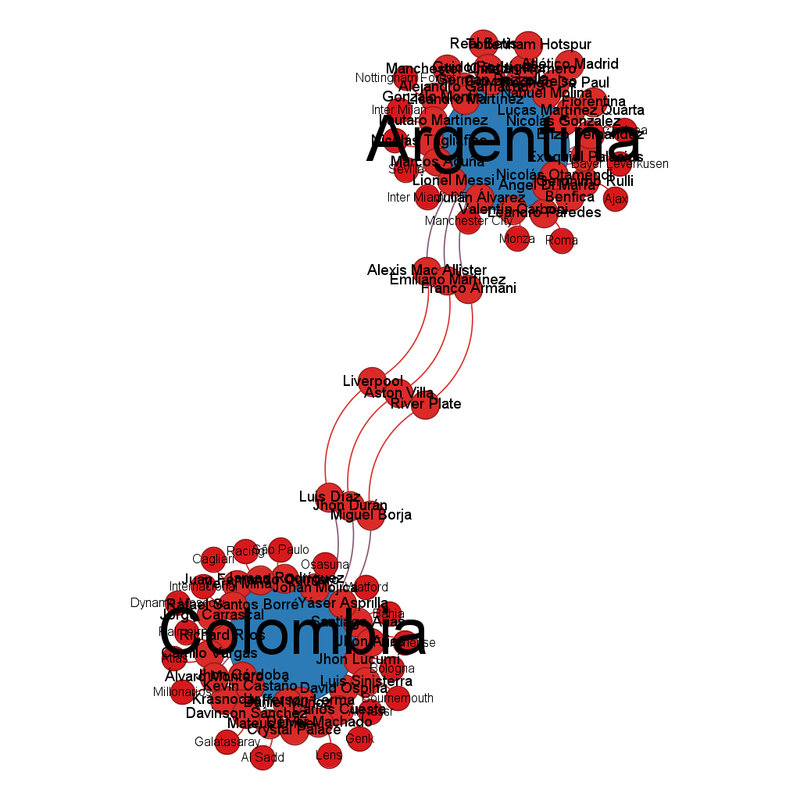


While the Copa America group stages were less interconnected than the Euros, the finals are not much less interconnected. The Euro 2024 final had 4 club teams with players on both national teams (https://fulltimesportsfan.wordpress.com/2024/07/12/euro-2024-final-network-diagram/), the Copa America final had 3.
The three are River Plate, Liverpool and Aston Villa, which I think says a lot about Aston Villa's return to prominence. (There is a small local bias. Only half my colleagues hate everything about this, the other half are enjoying a season where they have beaten Bayern Munich.)
What have we discovered:
1) The "closest to the centre" theory work for European Men's Football, Men's rugby union and men's rugby league. It works less well for European Women's Football and CONCAF/COMEBOL competitions.
2) Argentina and Brazil see my attempts at prediction and mock them.
No comments:
Post a Comment