This time, it was a red card for Tommy Makinson, leaving Saints with 12 men for 67 minutes.
Now against this Castleford team, who themselves had a player sent off in the second half, it didn't really matter, but that sort of thing really tots up over the season.
As does missing kicks, with only 8/12 tries converted.
Especially as he was one of the try scorers.
Due to the injury problems, this game marked Noah Stephens's debut. He appears thoroughly marvellous.
Less marvellous was that Wingfield came back from an injury break only to get injured again.
This game brought up Saints's 100th point-scoring moment of the season. By the end, they were up to 103.
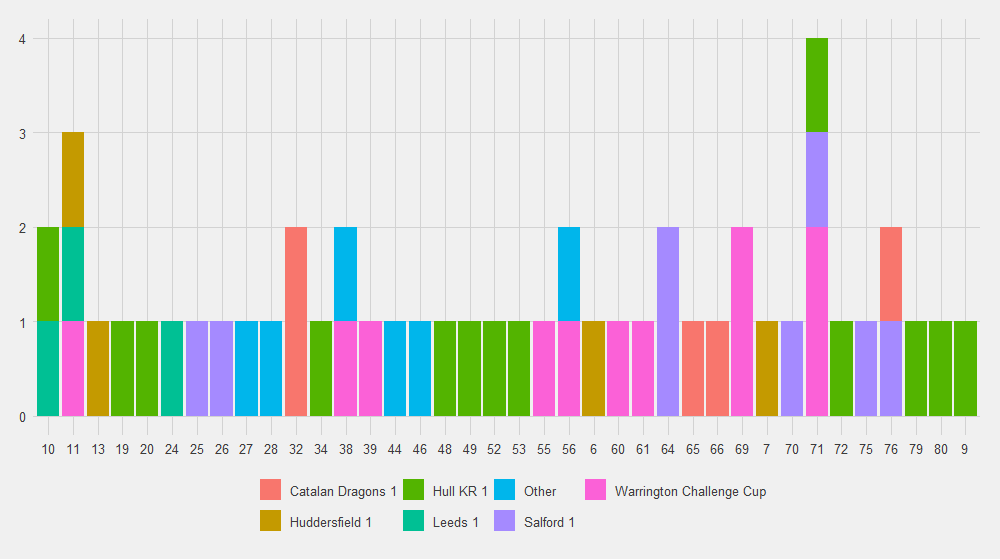
When do Saints score?
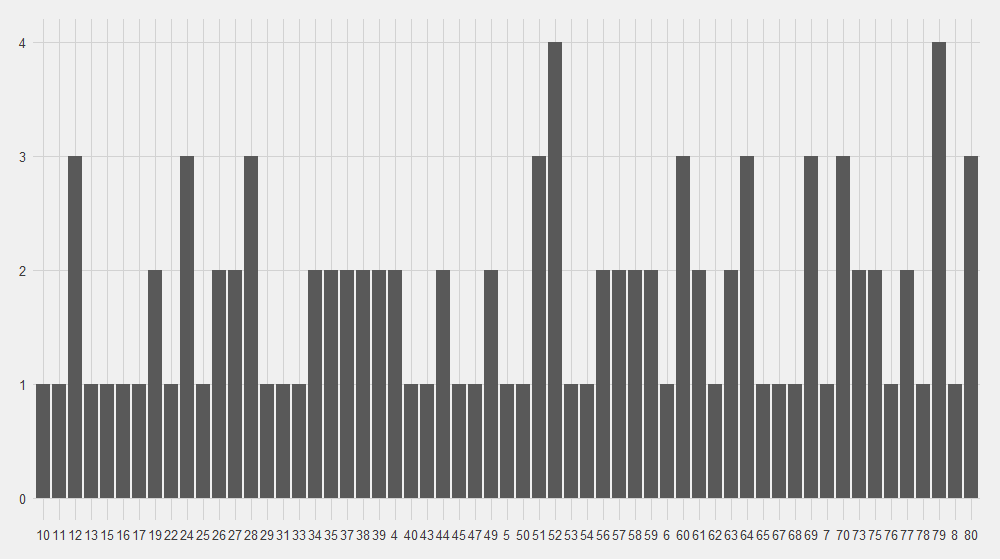
Still no pattern forming, but minute 52 and 79 both have 4 point scoring moments.

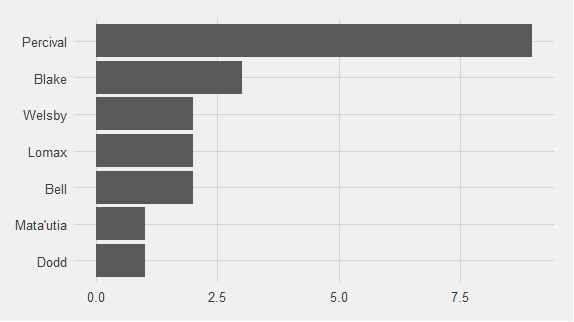
17 different players have already scored for Saints in 2024, but it's not surprising that Percival, our main kicker has the most with 31.
Blake on 7 has more than I expected him to.
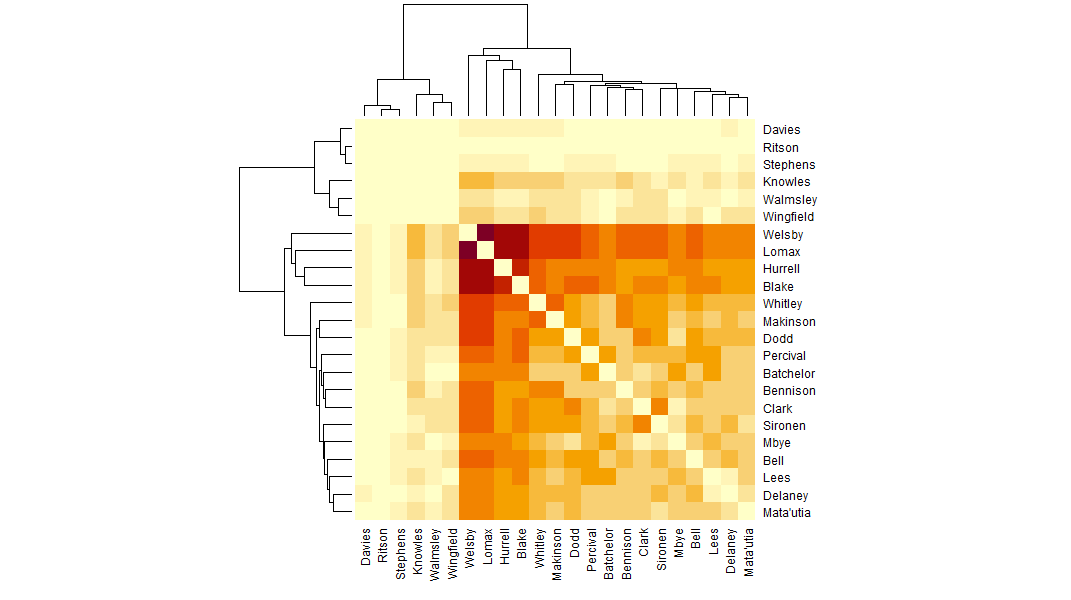
Welsby and Lomax remain ever-presents for when Saints score, which is amazing. (A few Rugby League commentators have been sniffy about Welsby's season this year. I may bite them.)
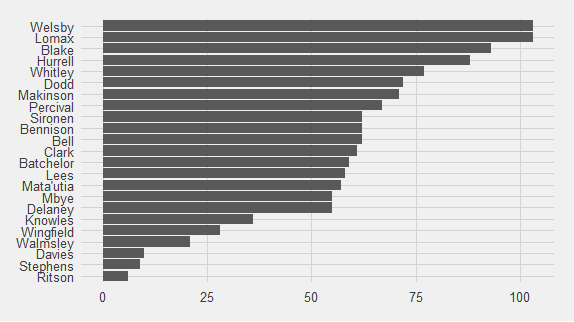

I really didn't expect Blake and Hurrell to be so high up (3rd and 4th respectively).
The pale space at the top is full of injured players (and have now double checked and Knowles was out with a groin injury) or debutants. Or is Tee Ritson.
That's recapitulated by the network graph
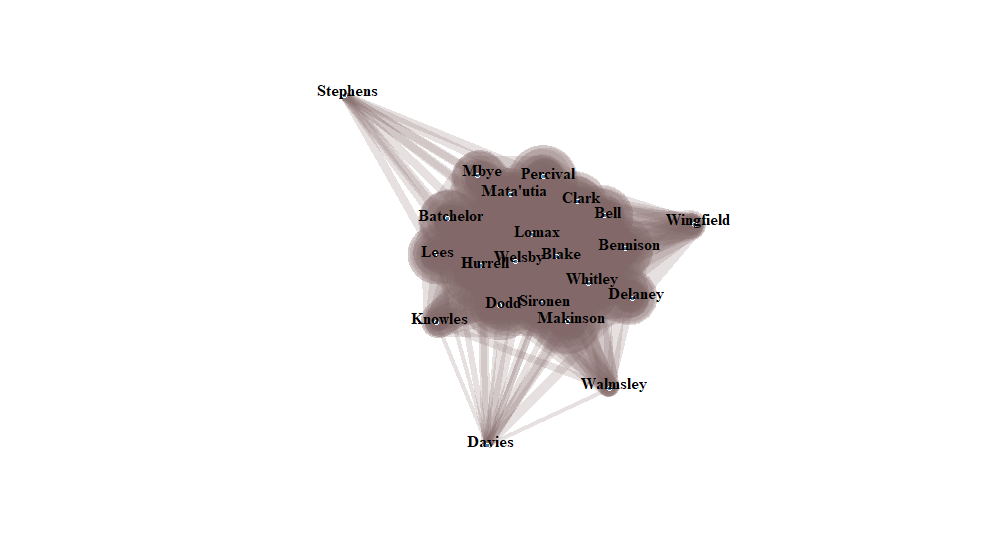
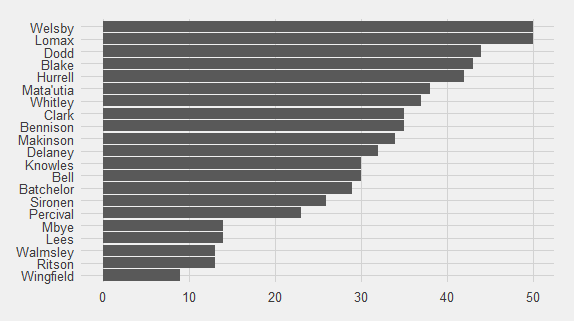
Saints have now conceded 50 point-scoring moments over the season.

Lomax and Welsby at the top of that isn't a surprise because they've been ever present when Saints scored too.
With Saints having had >100 point-scoring moments and conceding 50, it seemed like a good time to compare where the players sit in the "present for scoring/conceding" rankings".
Mata'utia is the player present, relatively, for the most concessions versus scores, but he, along with Sironen, Bell, Mbye and Clark have been affected by the Saints twitter not always catching all the substitutions.
Ritson is next highest in that, but that's a statistical quirk because he's not played many minutes.
Then comes Clark. I think that's because he's the starting hooker and will always play more minutes in the tougher matches.
On the other side, the player present, relatively, for the most scores versus concessions is Percival, but I think that's an artefact of the pull him off at minute 50 thing.
Then comes Sironen, who I've always said does the hard yards quietly and well, then Whitley and Lees. But Lees I know is because he's been off the pitch due to his own cards!
Which players are present together when Saints concede?
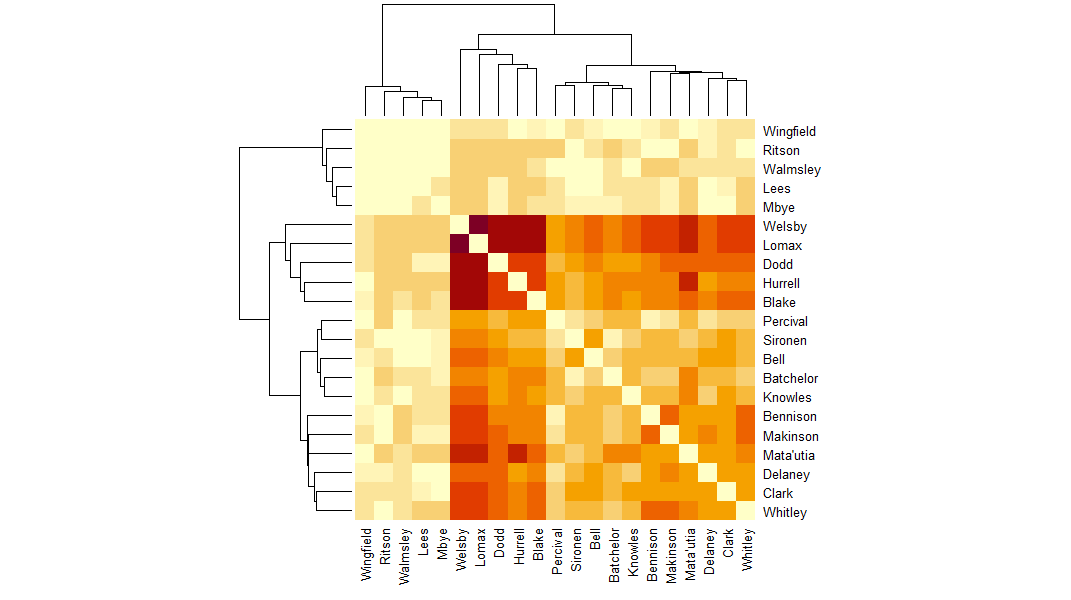
Because fewer players have been on the pitch when Saints concede than when they scored, there is less variation in colour than the scoring matrix.
The network graph is also more spread out for concessions,
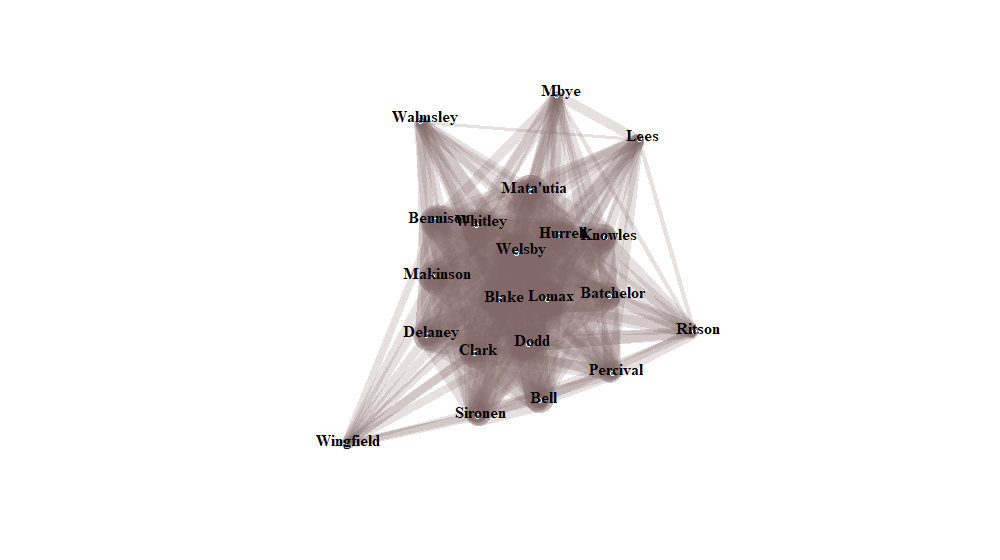


The interesting thing is that Mbye is one of the outliers on this view, which I'm presuming is because he players fewer minutes than Clark. Lees is because of the cards.

No comments:
Post a Comment