game 9 - lose to Warrington, game 10 - annihilate Hull FC, game 11 - narrowly squeak past Huddersfield with a last minute drop goal (thank you so much Johnny Lomax).
Match report here - https://www.saintsrlfc.com/matches/2024/first-team/saints-v-huddersfield-giants-2024-04-25/?swcfpc=1
Because the game was so low-scoring (13-12), I've got no figures for the game. But there are some interesting changes to the rolling diagrams.
Who scores for Saints?
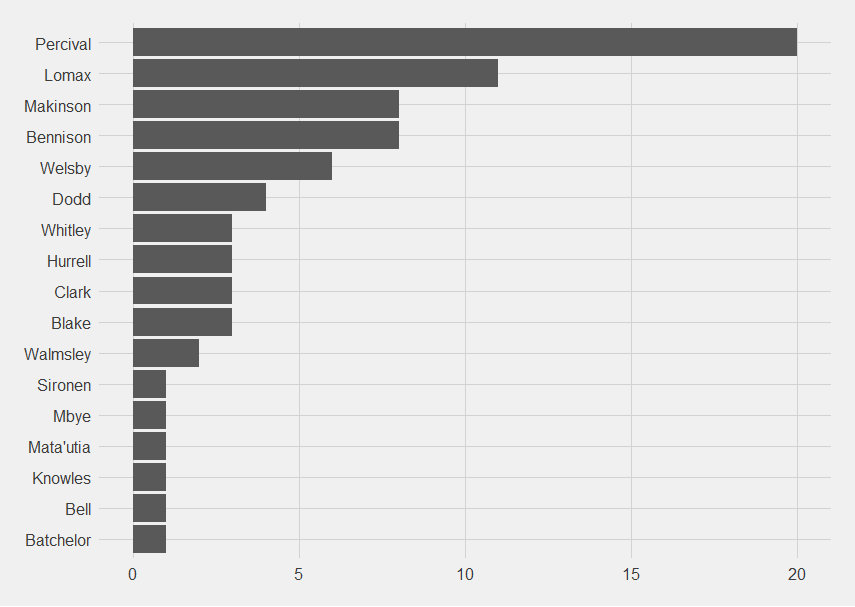 Percival brings up his 20th point-scoring moment.
Percival brings up his 20th point-scoring moment. 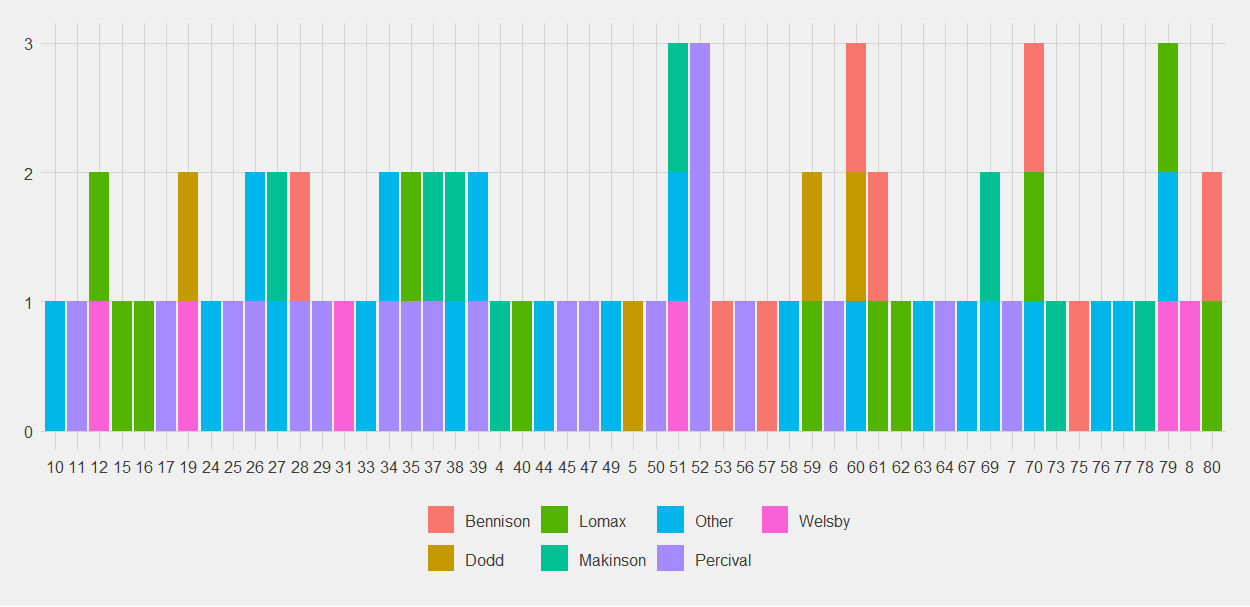
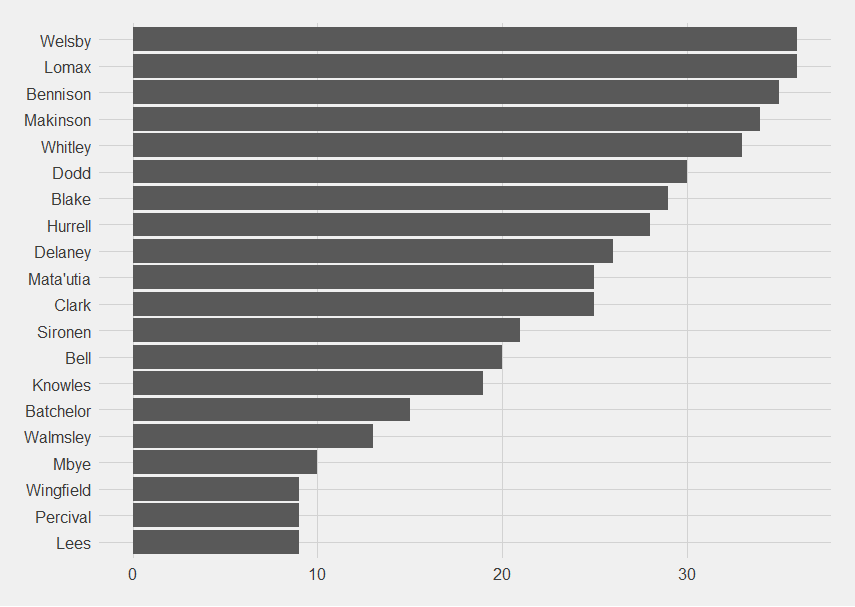
Who is present when Saints score?
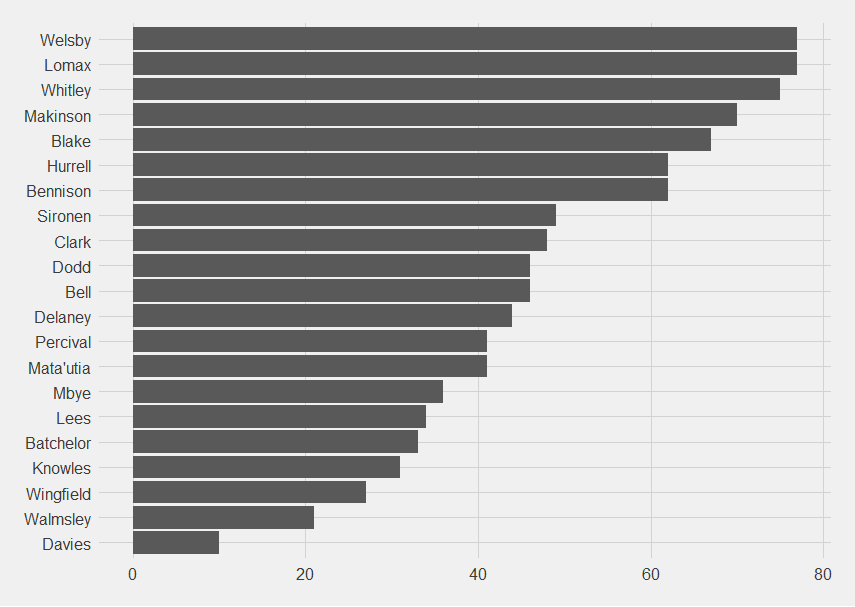
Welsby and Lomax have been present for all point-scoring moments, followed by Whitley and Makinson.
The least present are Wingfield (who has been injured), Walmsley (also injured) and Davies (guess what). This was when Saints 2024 injury curse really started to become obvious.
The matrix has changed significantly. Last time, the dark purple "most often together when Saints score" was in the bottom right hand corner, now it's in the top left hand corner.
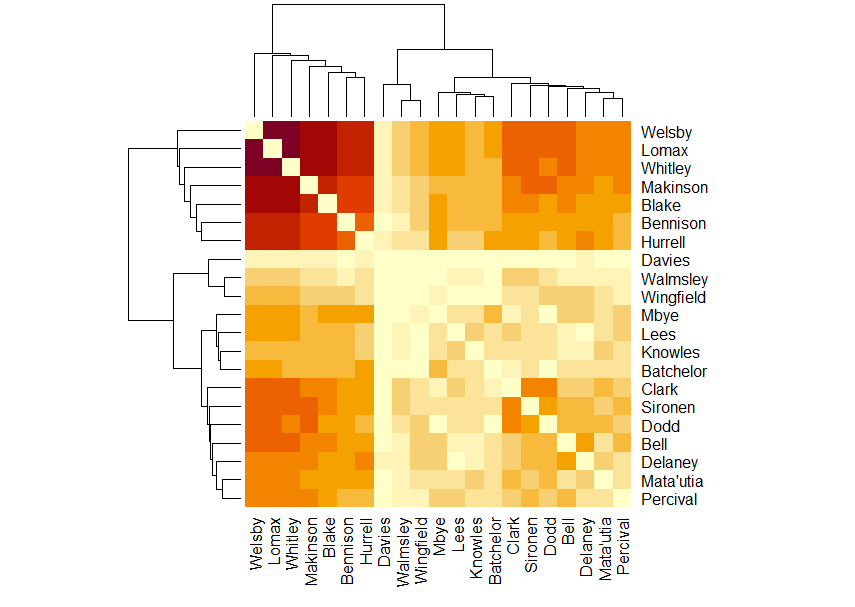 Interestingly, the next darkest area is the top right and the pale section is in the middle.
Davies is unexpectedly pale ... because he hasn't played often due to injury.
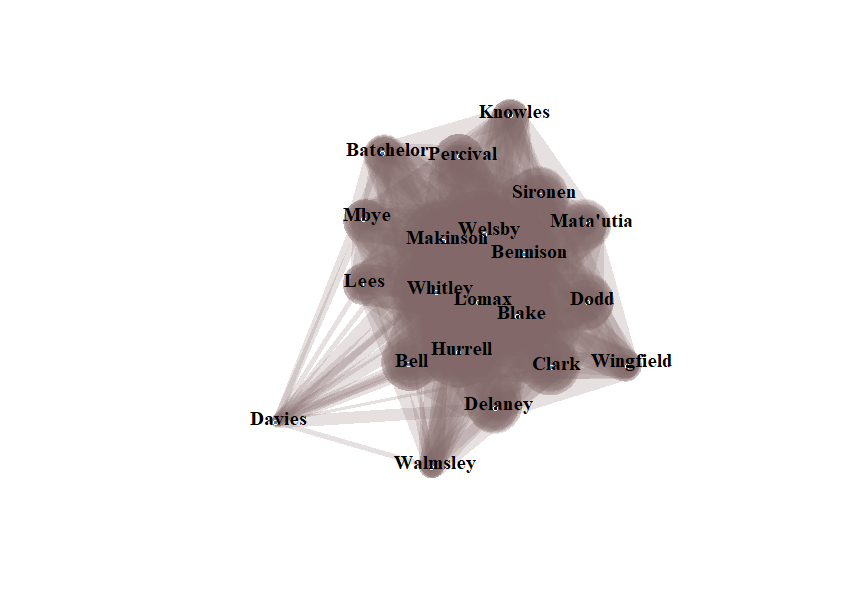
That's also why he sticks out of the network graph.
Interestingly, the next darkest area is the top right and the pale section is in the middle.
Davies is unexpectedly pale ... because he hasn't played often due to injury.
That's also why he sticks out of the network graph.
Walmsley's been injured, I'm presuming Knowles also.
Interestingly, the next darkest area is the top right and the pale section is in the middle.
Davies is unexpectedly pale ... because he hasn't played often due to injury.
That's also why he sticks out of the network graph.
Saints also concede mostly in the second half.
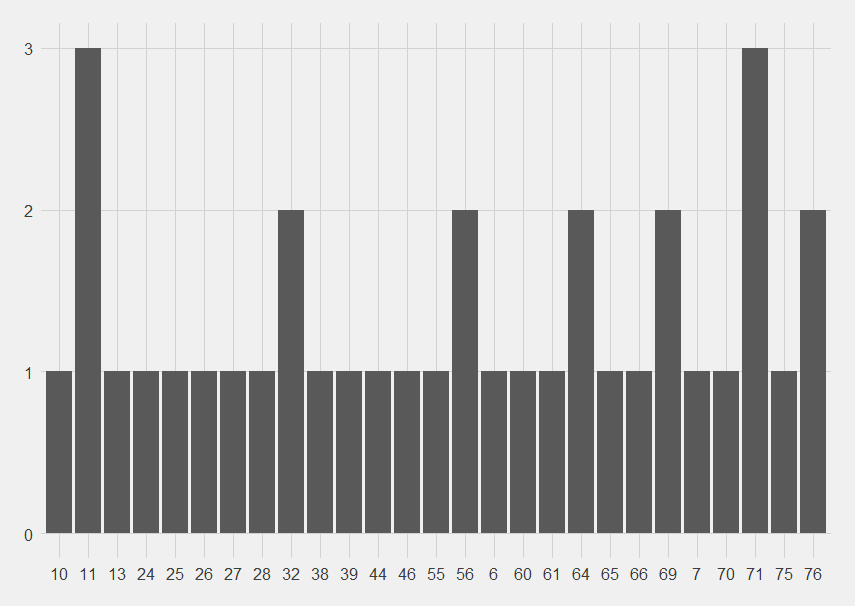
I do not approve of so many point scoring moments happening against Saints in minute 11.
Who is present when Saints concede?
Bennison continues to be present for more concessions than scores. Percival is present for few because of the "wrap him up in cotton wool at minute 50" scheme.
The concession network diagram is bizarre.
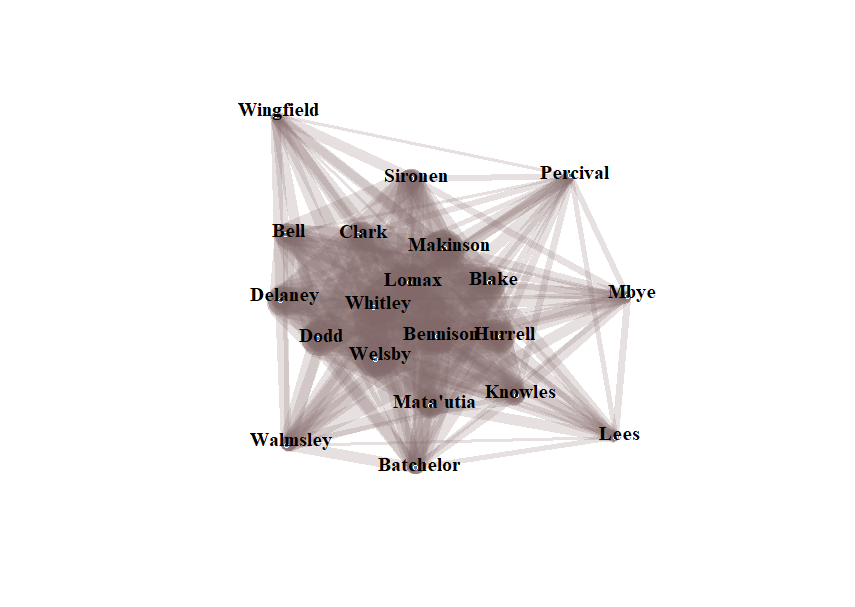 There's now a central core, with an outer halo of Wingfield, Percival, Mbye, Lees, Batchelor and Walmsley, with Bell and Delaney linking the two parts.
There's now a central core, with an outer halo of Wingfield, Percival, Mbye, Lees, Batchelor and Walmsley, with Bell and Delaney linking the two parts.
No comments:
Post a Comment