Matters were helped by not having Saints players subbed off injured like last time and John Asiata getting sin binned.
Looking at game 3 in isolation:
It's nice to see Mbye getting some game time.
The game 3 dendrogram shows the same pattern: 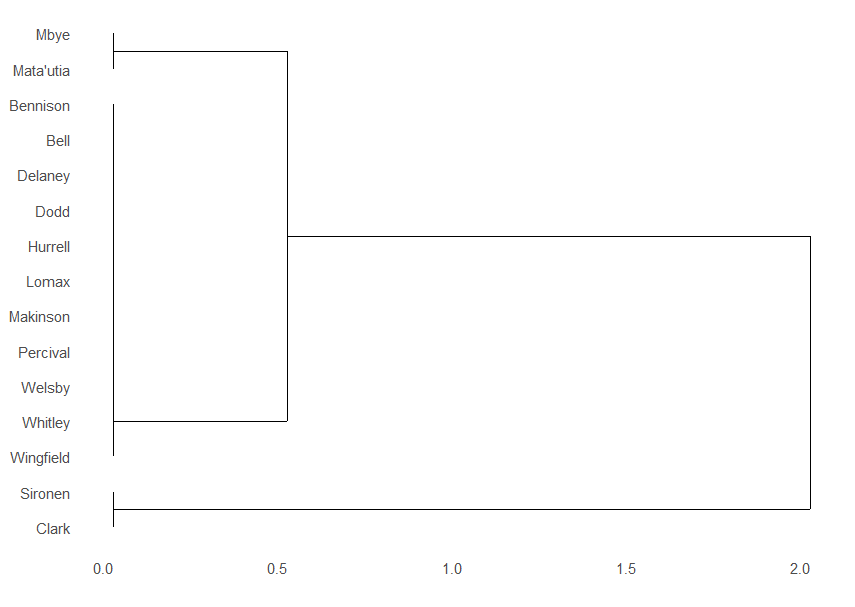
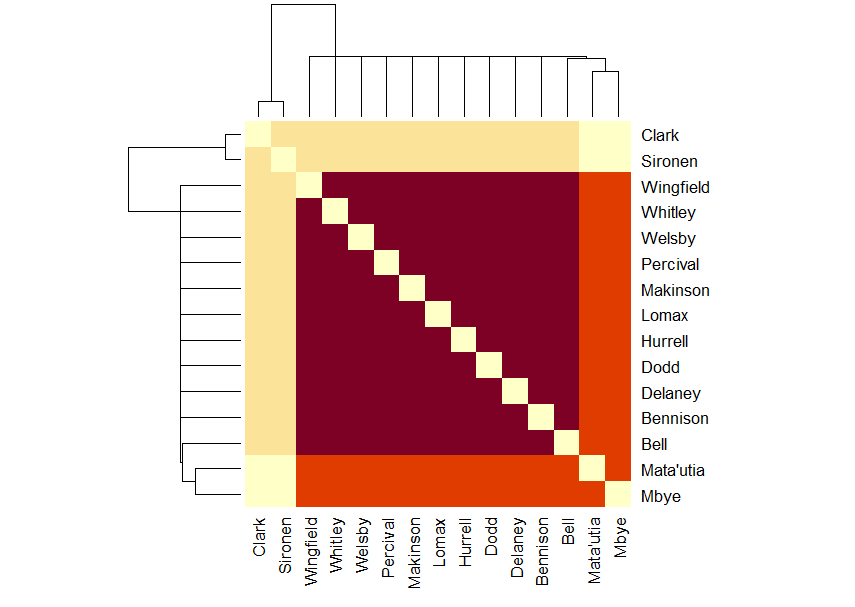
Mbye and Matautia and Sironen and Clark not sharing time makes sense, given its a forward and a hooker and another forward and a hooker.


Now, the season to date:
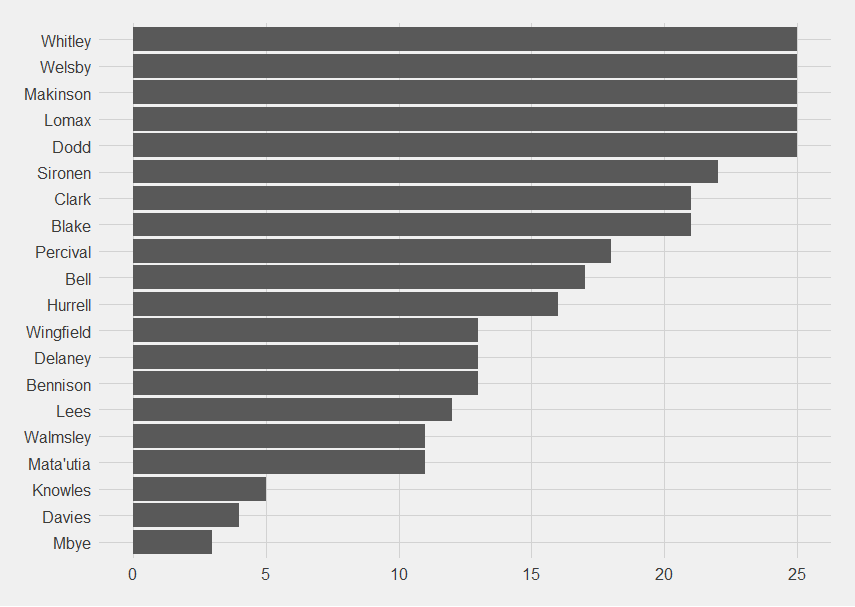
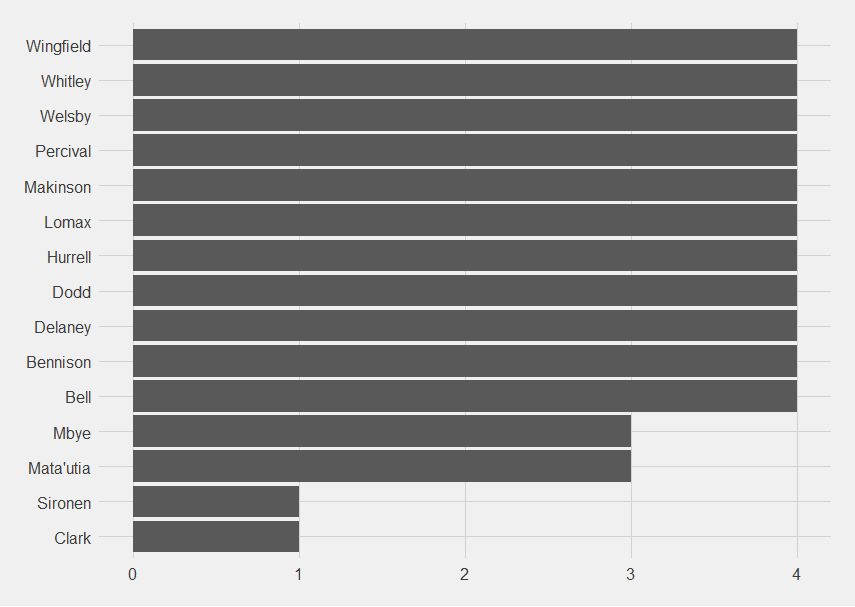
This is how many point-scoring moments players were present for:
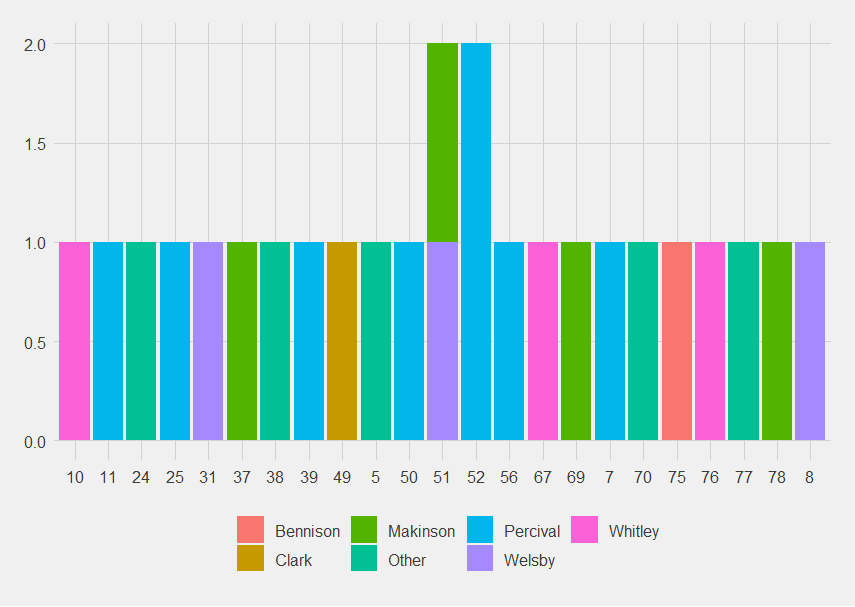
Now looking at the actual scorers and when they scored:
Percival, despite everything, had the most point-scoring moments with 8, then Makinson with 4, Whitley and Welsby on 3, then Walmsley, Matautia, Lomax, Knowles, Dodd, Clark and Bennison on 1.
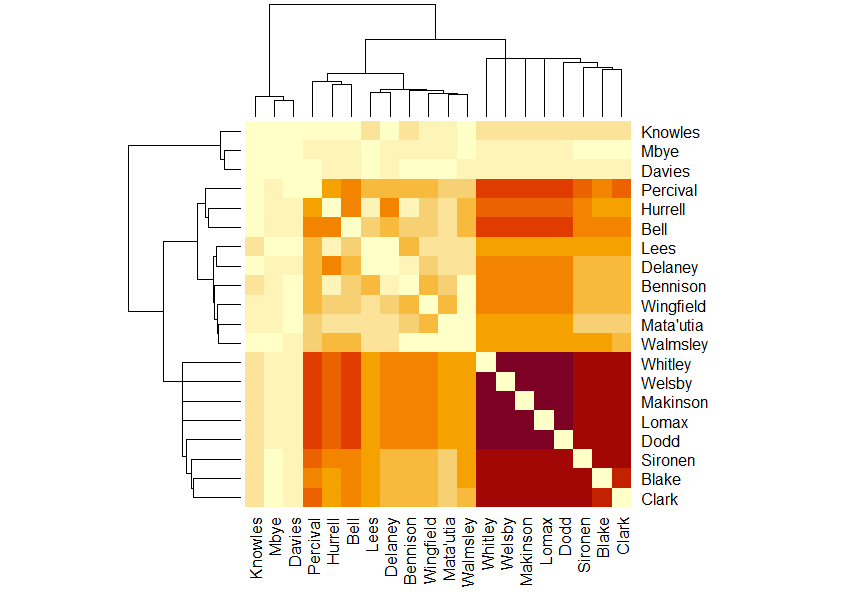
The dendrogram is now a lot more complicated.
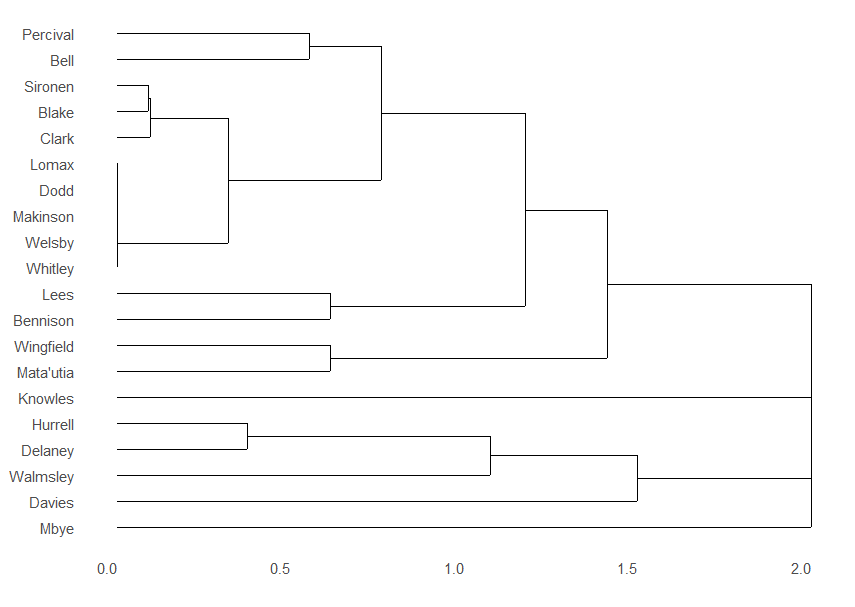
That complication is reflected in the matrix, where there's now a block of solid purple, the red, then the mixed part which is the players who sub on and off frequently, then the very top, palest rows, which are the players who haven't played often (yet).
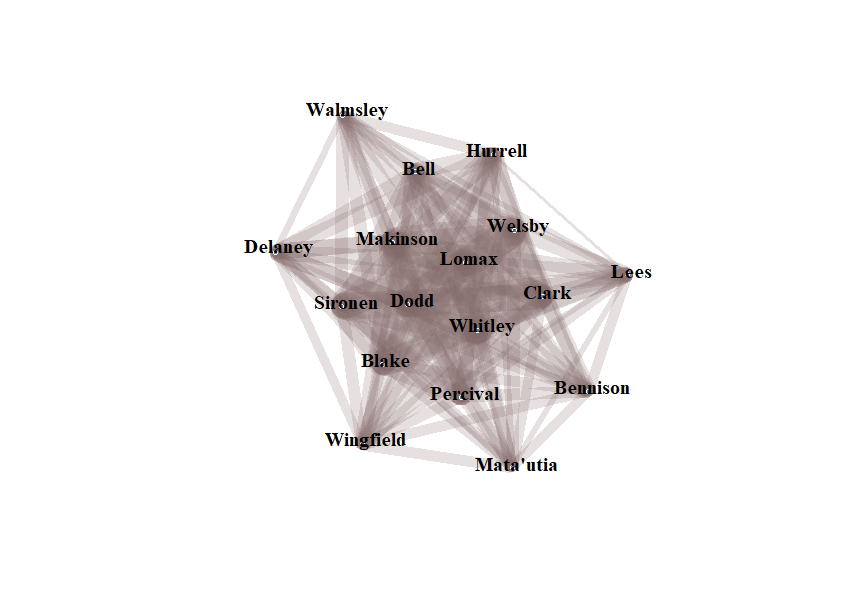
The network graph for the season is 17, which is a nice number for a squad.
The Saints defence conceded against Leigh. Having only conceded two point-scoring moments in three games (versus creating 25 point-scoring moments), it feels petty to name players present.
One interesting pattern, on an N of 2 mind you, is that both points were conceded in minutes 40-50 (44 and 46 to be precise). That's just after half time so I'm wondering if it's Saints not being fully switched on when they first come back.


Or I'm being hyper-critical and impossible. Which is very possible.
No comments:
Post a Comment