Saturday 2 March 2024

Saints Ahoy - Visualisations from game 2 and the season to date

This is the second post in my 2024 Super League data visualisation project (https://fulltimesportsfan.wordpress.com/category/saints-ahoy-rugby-league-project-2024/). Yes, I know I'm two days late, but there was a work trip in midweek 

Included will be the game 2 visualisations, and the visualisations covering games 1 and 2. What there won't be is the defensive visualisations, because Saints kept Huddersfield to nil in the game (https://www.bbc.co.uk/sport/rugby-league/match/EVP4369771), so there's still only one data point there. 

As a Saints fan, this pleases me immensely. I'm fully behind "Saints, the entertainers" but a lot of that flair comes naturally (The Saints Way etc), so defensive solidity is a nice addition. The best Saints teams have combined both. 

A fuller report on the Saints vs Huddersfield match can be found here - https://www.saintsrlfc.com/matches/2024/first-team/huddersfield-giants-v-saints-2024-02-24/ 

The game 2 dendrogram again shows that central core of players who play most of the game, the prop swaps, and that Saints are continuing the policy of wrapping Percival up in cotton wool once the game is won. I still approve. Dendrogram, all the useful information is in the description above. 
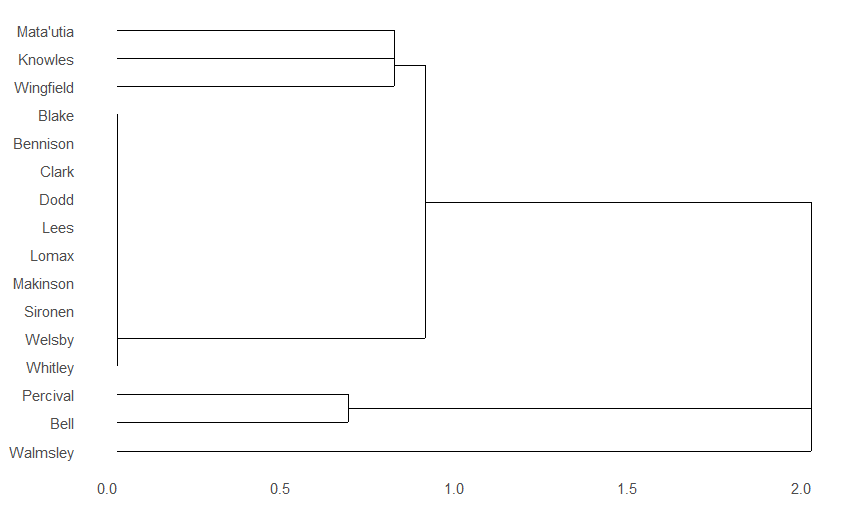
This time, Walmsley was the one with the short stint at the start. Which suggests that it's strategic, not injury related (despite the news about Matty Lees coughing up blood - https://www.saintsrlfc.com/2024/02/26/medical-update-on-matty-lees/)
 
Line chart showing when players were on the pitch when Saints scored Line chart showing when players were on the pitch when Saints scored.  Whitley, Welsby, Sironen, Makinson, Lomax, Lees, Dodd, Clark, Blake, Bennison and Knowles played the whole match, Percival was taken off around 50 minutes, Wingfield and Matautia came on later on, Bell did a stint in the middle and Walmsley had a mini-cameo at the start.

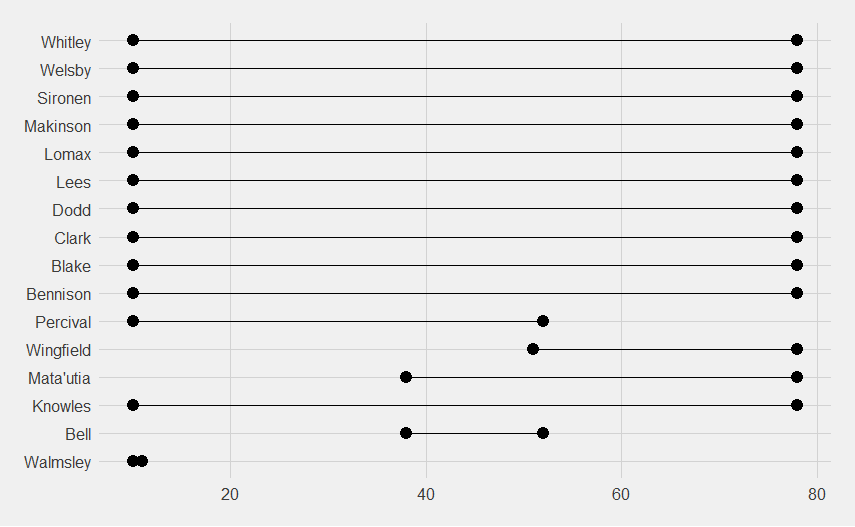
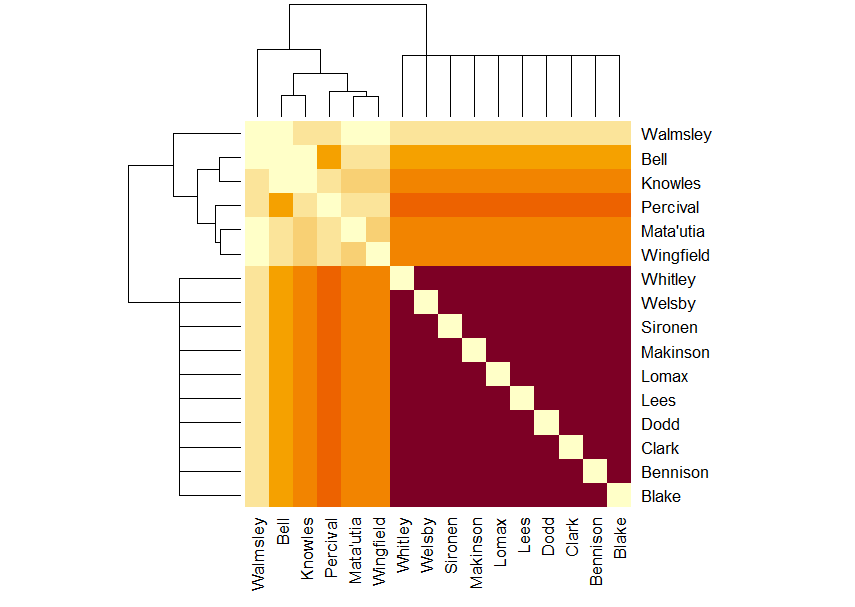
Game 2 Matrix diagram
Dark purple cluster of Whitley, Welsby, Sironen, Makinson, Lomax, Lees, Dodd, Clark, Bennison and Blake. Percival is the darkest orange but separated from them because he left the pitch early.  Knowles, Matautia and Wingfield are the next shade down, reflecting the rolling substitutions, then Bell, then Walmsley the palest, reflecting his single stint. The darkest cluster are Whitley, Welsby, Sironen, Makinson, Lomax, Lees, Dodd, Clark, Bennison and Blake who played the whole game. Percival is the darkest orange but separated from them because he left the pitch early. Knowles, Matautia and Wingfield are the next shade down, reflecting the rolling substitutions, then Bell, then Walmsley the palest, reflecting his single stint. There are fewer players in the network diagram than last time (https://fulltimesportsfan.wordpress.com/2024/02/21/saints-ahoy-rugby-league-data-visualisation-2024/)

The network diagram:   Whitley is in the centre of the diagram, surrounded by (starting at 12 if it was clock) Sironen, Makinson, Welsby, Lomax, Bennison, Lees, Blake, Clark and Dodd. 

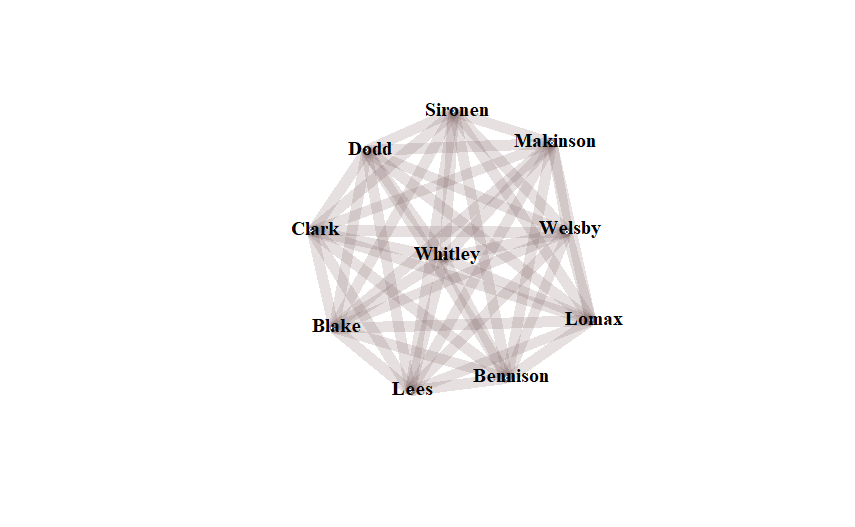
I hadn't realised how central Whitley was, but I can believe it. 

If we look at the combined data sets they look like this. 

Season to date data visualisations 

Who scored points for Saints - with the note that it's point-scoring moments, not number of points. Percival has the most with 6, followed by Whitley and Makinson on 3, then Welsby on 2.  Walmsley, Matautia, Lomax, Knowles, Dodd, Clark and Bennison are on one. 
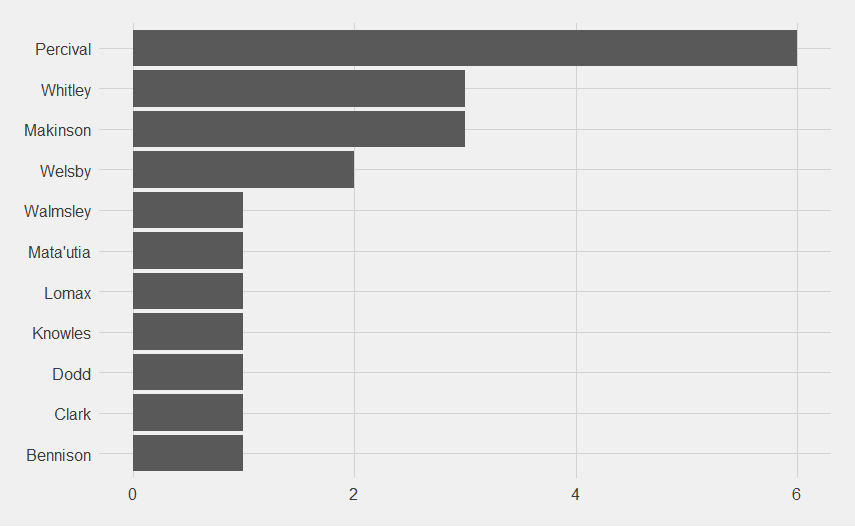
Despite being taken off early, and all the missed conversions which will undoubtedly haunt us come the big matches, Percival has had the most point-scoring moments.

Combined dendrogram:   Wingfield and Matautia are their own mini-cluster at the top.  Then Lees and Bennison, then Knowles on his own.  There is a central cluster of Dodd, Blake, Lomax, Makinson, Sironen, Welsby, Whitley, with Clark dangling off to the side.  Then there is Percival, who is there for all the point-scoring moments until he gets subbed off at 50 minutes.  Then Walmsley and Hurrell make a mini-cluster, with Bell dangling off, then Davies and Delaney. There are some clear prop clusters, Wingfield and Mata'utia, Walmsley, Hurrell and Bell. The Davies and Delaney cluster is pleasing to see because it suggests they're slowly blooding them in. It looks like the spine of the team are Dodd, Blake, Lomax, Makinson, Sironen, Welsby, Whitley and Clark. 

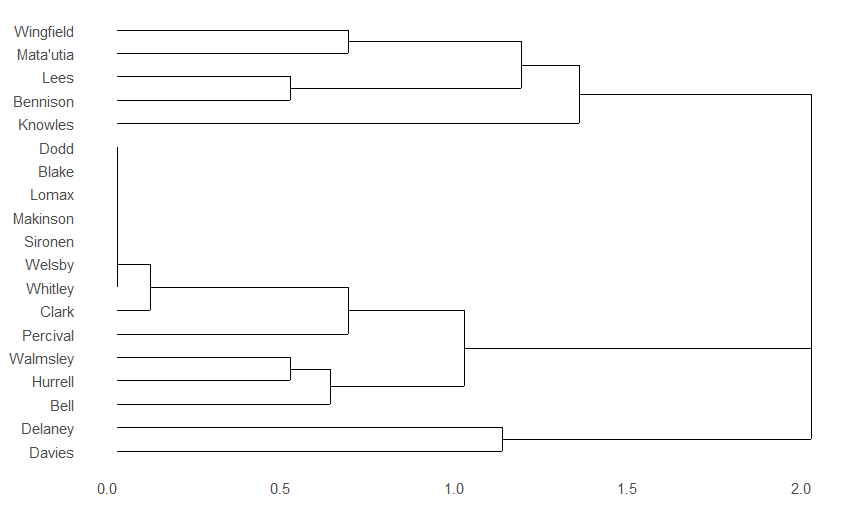
Percival is there for all the point-scoring moments until he gets subbed off at 50 minutes. 

This pattern is also seen in the matrix diagram Dark purple cluster of Whitley, Welsby, Sironen, Makinson, Lomax, Dodd, Clark and Blake.  Next darkest are orange are Percival and Bell.  Then Hurrell.  The next palest are Hurrell, Lees and Walmsley.  Then Bennison, Wingfield and Delaney.  Then Matautia.  The palest colours are Davies and Knowles. 
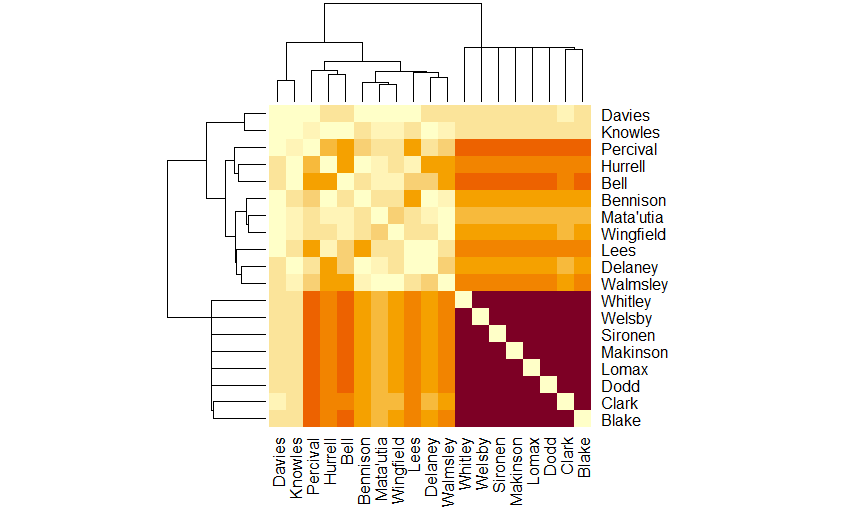
The matrix reflects the dendrogram, but you can also see some interesting patterns, like Bell and Knowles not playing together, Hurrell playing less with Lees, Bennison and Knowles and so on. These patterns will both strengthen during the season and might get more mixed up as injuries (and suspensions) take their toll. 

The network diagram looks like this: There are two rings of players.  The central one contains (from the top) Dodd, Clark, Makinson, Welsby, Blake, Sironen, Lomax and Whitley.  Percival lies just slightly outside this ring.  Then the second ring, which surrounds the first, contains Wingfield, Matautia, Delaney, Walmsley, Hurrell, Bell, Bennison and Lees. 

It's interesting that two games in there's already a clear central core and then a secondary ring. 

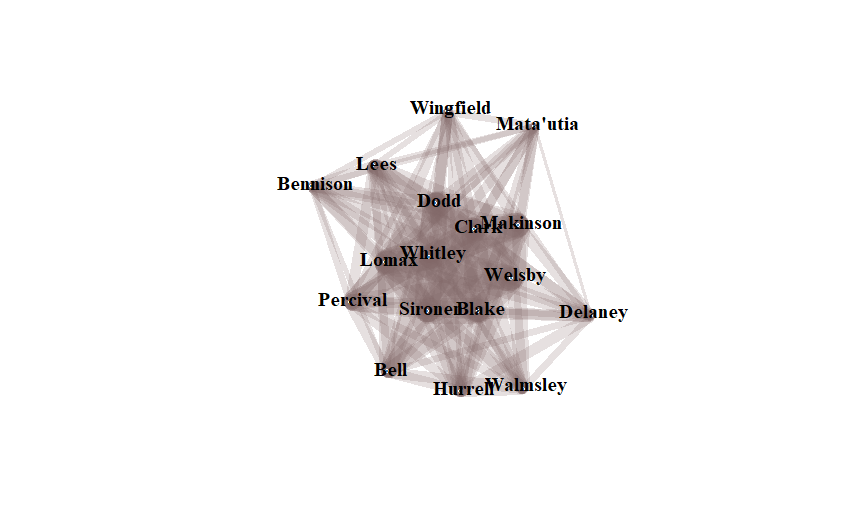
Will have the data from the Leigh game inputted when I get an hour to spare.

No comments:

Post a Comment