Thursday, 4 July 2024

Euro 2024 Network Diagrams - Quarterfinals

Okay, so Austria are out, as I suspected they would be. 

For the second Euros in a row, a team they beat in the group stage has gone further than them. But at least it took this absolute stunner of a save for Turkey to beat Austria - https://x.com/EURO2024/status/1808266570327634063 

Of the clear predictions, the diagram was 4/4, and the diagram was part of why I wasn't surprised by Italy or Austria's losses. (I have a series of theories about why the UK press always underestimates Turkey, they are all rude.) 

So, what does the diagram look like now? As expected, the outlying teams all lost, so there's now only the central core teams left. 

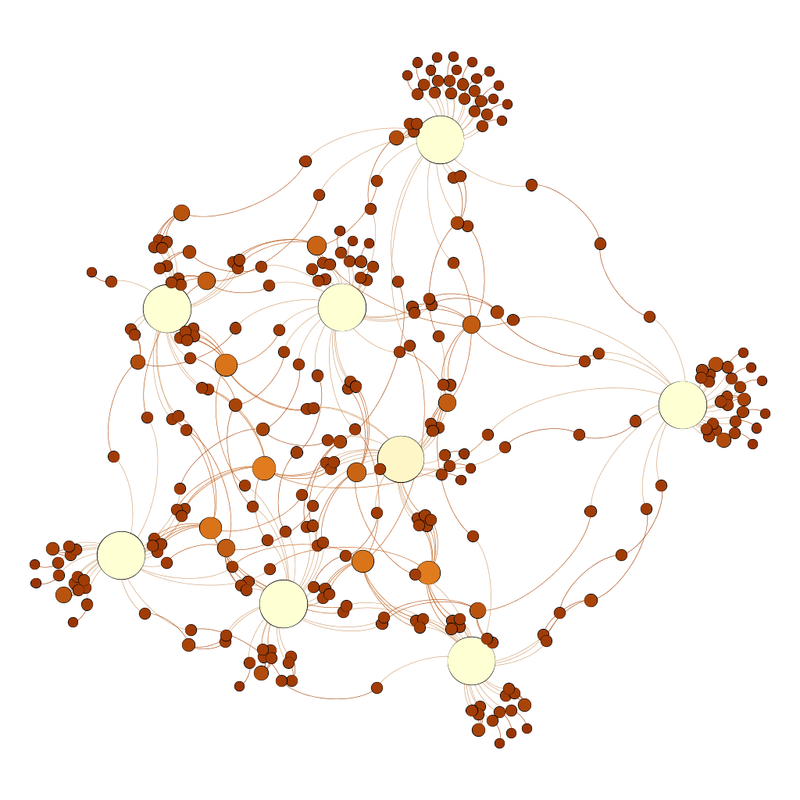
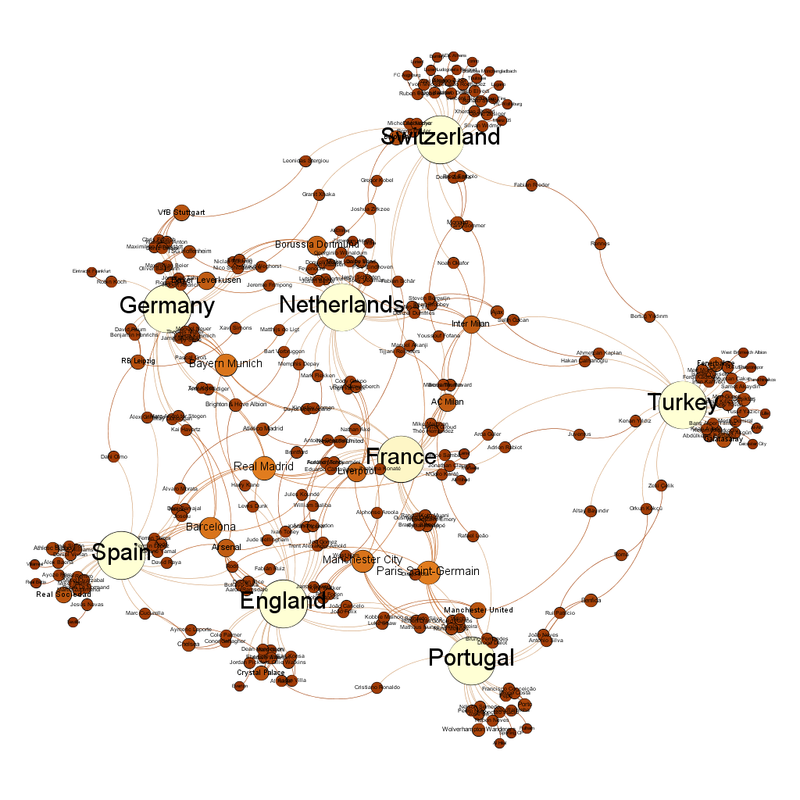
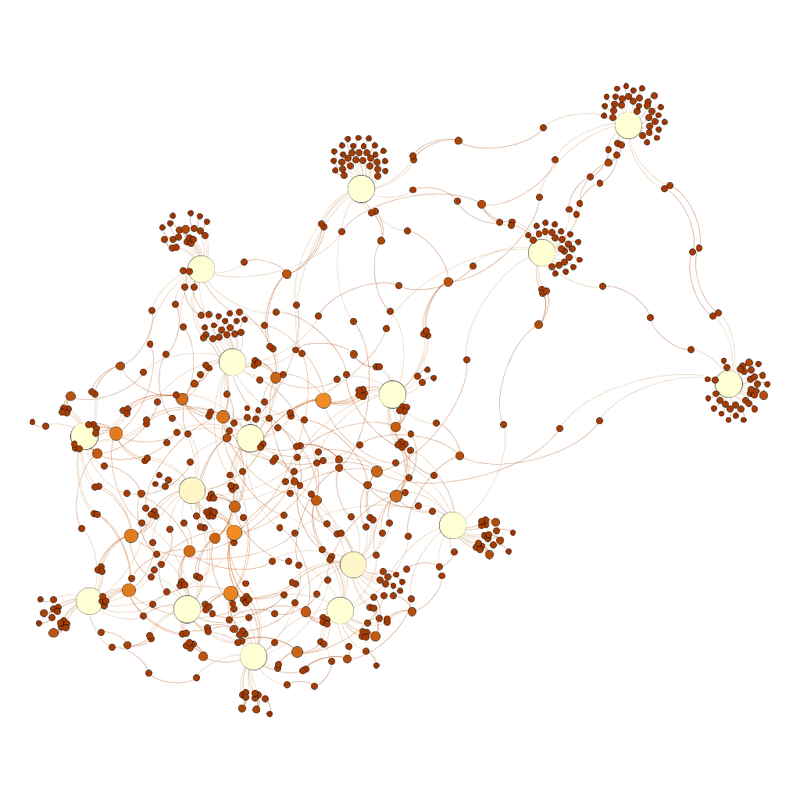
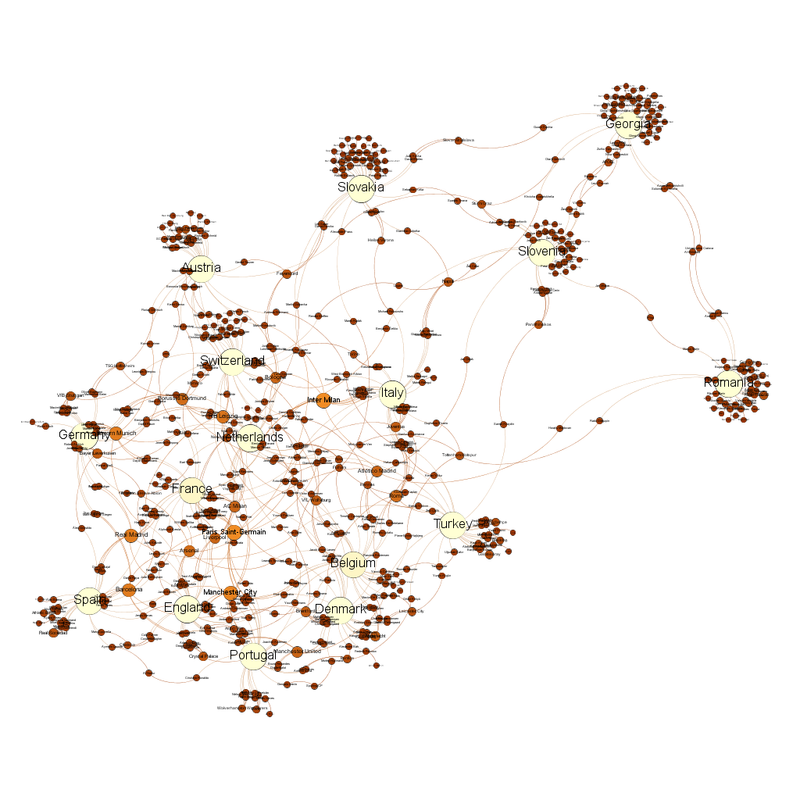
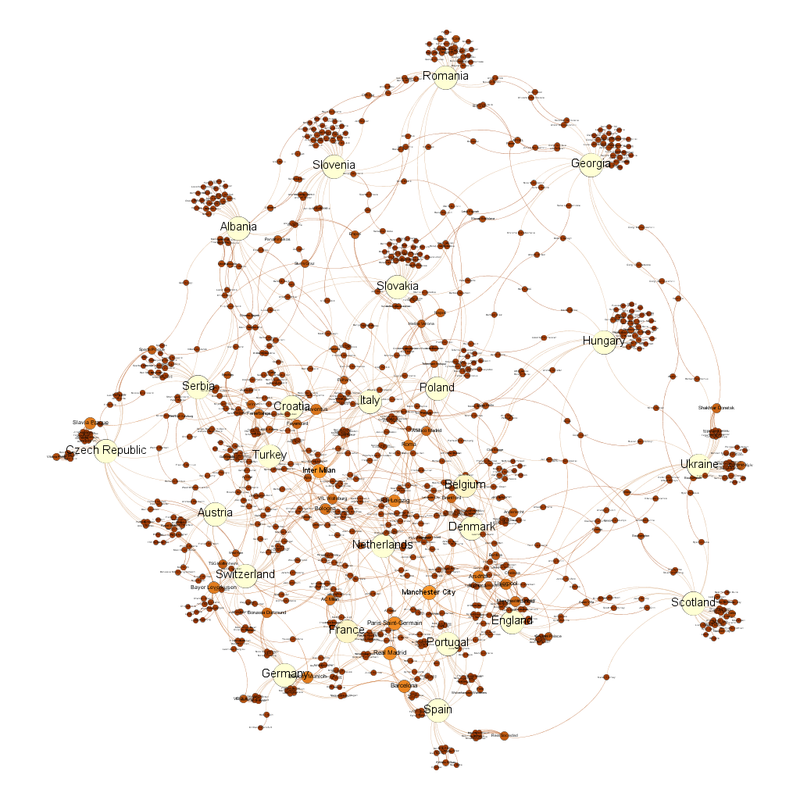
Looking at the unlabelled diagram, the central clump is now not as clumped, and one team sticks out to the right.  Network diagram.  While the central clump of teams remains, it is now left shifted, with one team standing slightly separately to the right.Labelled, it looks like this: Labelled version of the figure above.  Around the outside, clockwise, Switzerland are at 12, then Turkey at 3, Portugal at sort of half 5, then England at half 6 and Spain at 7.  Germany are at half 9.  France and the Netherlands are the two teams in the centre of the clockface, with France right in the centre.  Turkey are the team that stick out slightly. France are the team closest to the centre, while AC Milan are the club team closest to the centre. 

The club teams with the most representatives left are Real Madrid and Paris Saint-Germain with 10, Bayern Munich, Barcelona and Manchester City with 9, then Borussia Dortmund and Liverpool with 7 (stop giggling back there about that linkage). 

Inter Milan have been significantly reduced, not just because of Italy going out but also because they had several players in other teams that have been eliminated. 

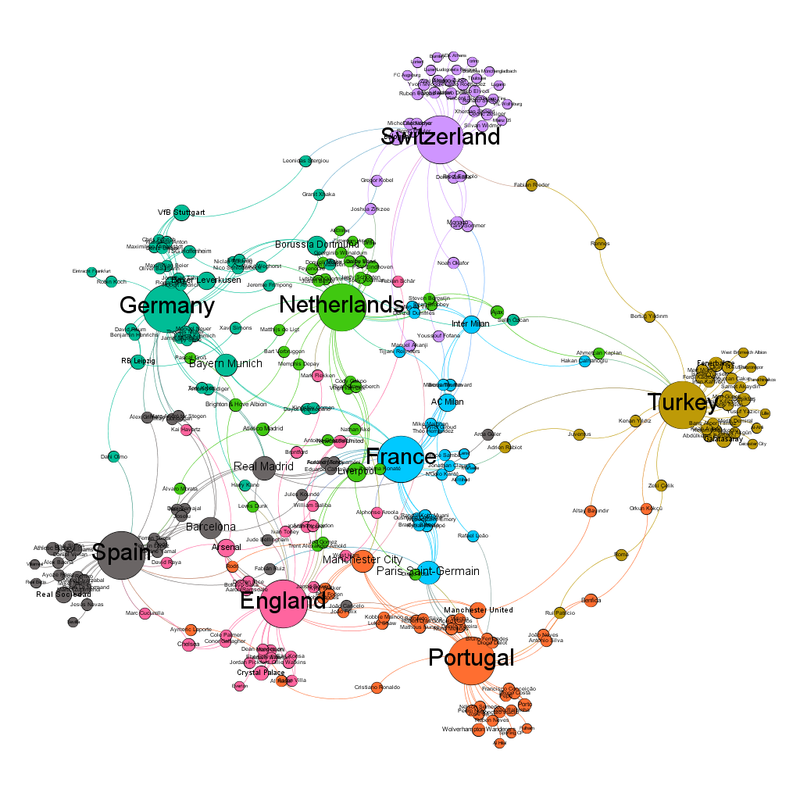
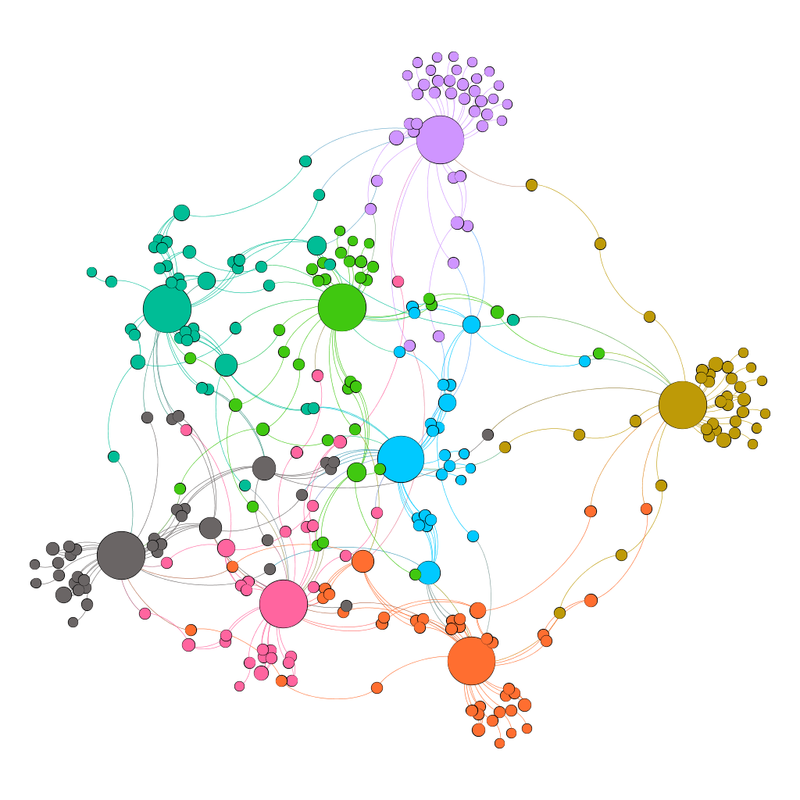
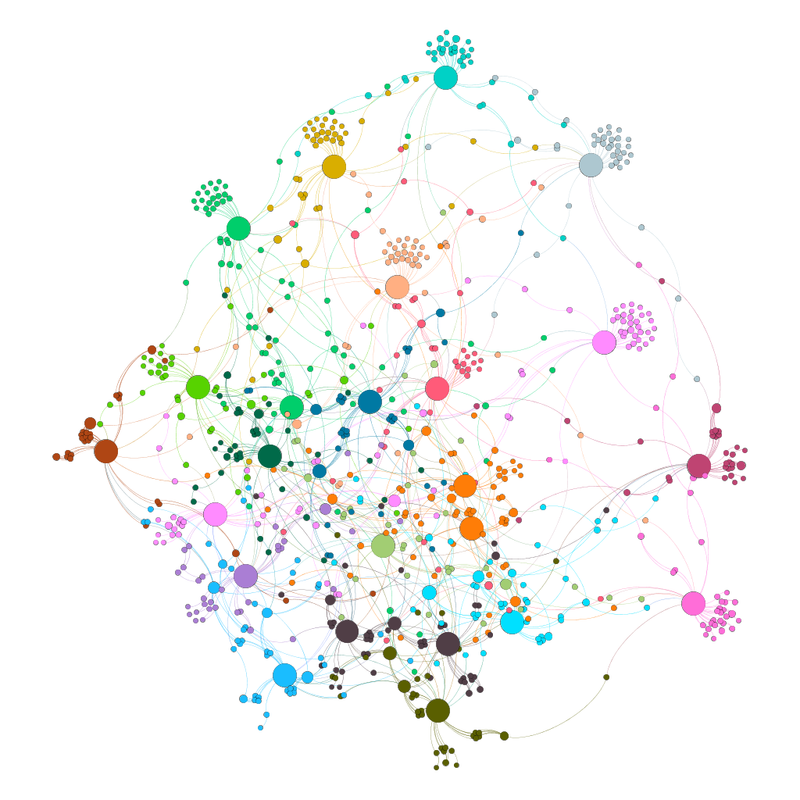
All the teams are their own community in the community views. Around the outside, clockwise, Switzerland are mauve at 12, then Turkey olive green at 3, Portugal are orange at sort of half 5, then England in pink at half 6 and Spain in grey at 7.  Germany are at half 9 and are sort of turqoise-green.  France (bubblegum blue) and the Netherlands (green) are the two teams in the centre of the clockface, with France right in the centre.  Turkey are the team that stick out slightly. Unlabelled community view diagram, because it looks pretty. 

I can understand why Inter Milan are French in the community view, what with Italy going out, but Manchester City and Manchester United being Portuguese intrigues me. 

Predictions from this (and the reason why I'm writing this while watching the election coverage so it's out before tomorrow): 
Spain vs Germany - Diagram says Germany, just 
Portugal vs France - Diagram says France 
England vs Switzerland - too close to call 
Netherlands vs Turkey - Diagram says Netherlands (this one is the one I think could be an upset. This Turkey team have a vibe.)

Thursday, 27 June 2024

Euro 2024 Network Diagram - Now the group stage community views

I described the group stage diagram as looking like a peacock (https://fulltimesportsfan.wordpress.com/2024/06/15/euro-2024-network-diagram-only-a-day-late/), and I'm amazed how many of the peacock tail survived. Well done Georgia and Romania in particular. 

My prediction for who would go out was Albania, Slovenia, Romania, Georgia, Ukraine and Scotland, then Slovakia and Hungary, with Poland or Austria in place of one of Romania, Slovakia or Ukraine. I was right for 5/8, which I could as going okay. I also hadn't expected Belgium to turn the Group of Cuddly into the Group of Sickos.
  Screenshot from the BBC website showing that group E finished with all 4 teams having 4 points.

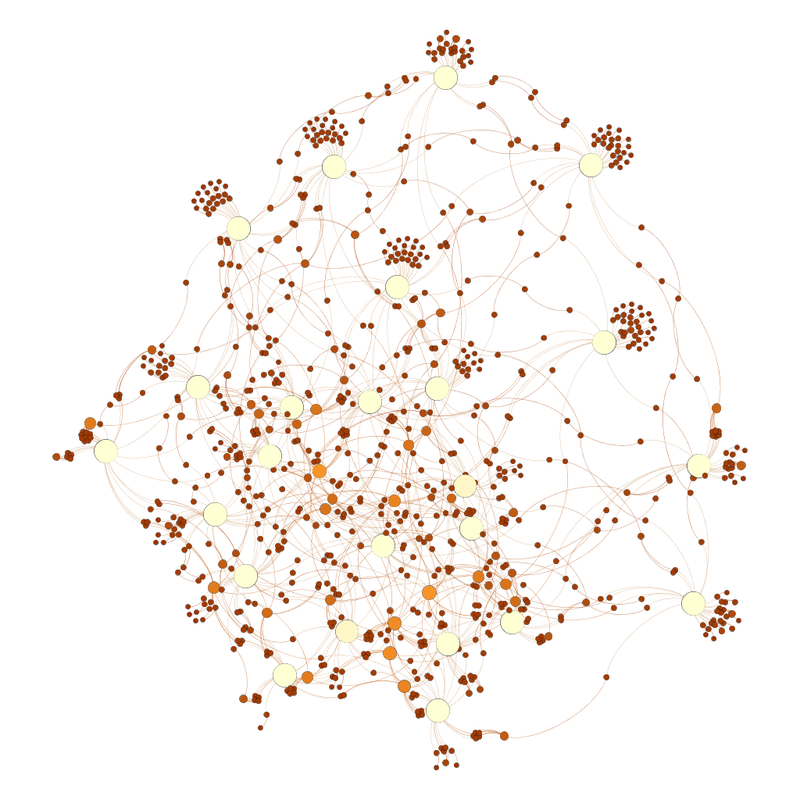
The network graphs for the last 16 look like this: Unlabelled network diagram, with a tightly packed core at the bottom left, and four teams trailing out to the right. The central core are still there (mostly, really wasn't expecting Croatia to go out), with four teams trailing out to the right. Labelled, it looks like this: Same diagram but labelled.  The four teams sticking out on the right are Slovakia, Slovenia, Romania and Georgia. Slovakia, Slovenia, Romania and Georgia being so far away from the main core highlights how much of a surprise their going through to the last 16 is. 

Because of the odd weighting, identifying the central team is less valuable than usual. Italy are the national team closest to the centre, and Juventus are the club team closest to the centre. 

The club teams with the most players left in are Inter Milan and Paris Saint-Germain with 12, then Manchester City with 11, then Bayern Munich, Real Madrid and Barcelona 10.

The community view looks like this:   Same figure as before, but coloured by community. Labelled version of that picture. Now each team is it's own community. 

Predictions, as requested by L. 

Spain vs Georgia - diagram says Spain 
Germany vs Denmark - no clear winner on the diagram 
Portugal vs Slovenia - diagram says Portugal 
France vs Belgium - diagram says France 
Romania vs Netherlands - diagram says Netherlands 
Austria vs Turkey - no clear winner on the diagram (I will be crossing my fingers and avoiding the match) 
England vs Slovakia - diagram says England 
Switzerland vs Italy - no clear winner on the diagram 

That central core is tightly packed, which is what's led to that uncertainty.

Saturday, 22 June 2024

Euro 2024 Network Diagram - Now the group stage community views

Because I was trying to race the start of the Euros with my diagrams, I didn't add the community view.

They're below and are quite busy.   Teams in the Euro 2024 tournament coloured by community Same diagram as previous but unlabelled There are 20 communities for 24 teams. 

Belgium and Denmark share a community because both teams have players that play for Anderlecht. France and Portugal share a community because of their Paris Saint Germain players.  
Then there's Albania and Croatia, and despite almost being on opposite sides of the diagram, Austria and Hungary are one group.

Saturday, 15 June 2024

Euro 2024 Network Diagram - Only a day late

(Stuff, still happening. Everything, still late.) 

So after OMG! 12 years of doing this, I know what shape I am expecting from this sort of thing. 

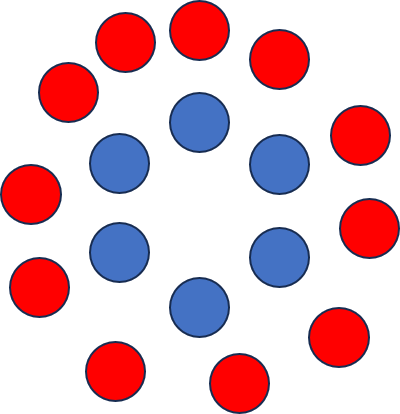
I am expecting a central tight core, surrounded by others (like the diagram below). A circle of blue circles surrounded by a circle of red circles. 

Now sometimes, the cluster is shifted and tighter at one point rather than the centre, like at the Women's World Cup 2023 (https://fulltimesportsfan.wordpress.com/2023/07/22/womens-world-cup-2023-group-stage-network-diagrams/), but what I didn't expect is what this one looks like. 

I've made a simplified description below because having 24 teams with 26* players each makes the diagram really busy. (* Except France and Belgium, because ... actually does anyone know why?) A circle of blue circles, three-quarters surrounded by red circles. 

So there's one cluster, and the other, less connected, teams splay out like a peacock's tail.

This is what the real one looks like:   Same shape as the circle surrounded by three-quarters but with more circles and a lot more lines and links. The same diagram, but now labelled, which only makes it busier. The same diagram as previously, but labelled.  The teams in the tight cluster are, in no particular order, Czech Republic, Serbia, Croatia, Italy, Poland, Turkey, Belgium, Austria, Netherlands, Denmark, Switzerland, Germany, France, Portugal, Spain and England.  The teams around them are, clockwise from the equivalent of 11, Albania, Slovenia, Romania, Georgia, Hungary, Ukraine and Scotland. 

It does make identifying the central team less worthwhile than usual. 

That team are Italy. 

Turkey are a lot closer to the cluster centre than I expected. 

One of Fulham, Tottenham Hotspur and Atletico Madrid are the club team closest to the centre. 

The clubs with the most representatives are Inter Milan and Manchester City with 13. The come Real Madrid, Barcelona and Paris Saint Germain with 12, the Bayern Munich and RB Leipzig with 11. 

Interestingly, a lot of Barcelona and Real Madrid players are not playing for Spain and we've definitely moved on from the days where Spanish players played for either one or the other. 

I am not even getting into the whole thing about 3 different club teams all being Red Bull teams (not least because I have a whole post about it here - https://fulltimesportsfan.wordpress.com/2023/03/29/in-which-we-know-that-uefa-wont-do-anything-about-dual-ownership-but-a-girl-can-dream/). 

Prediction: From the diagram, I think the 8 teams that will be eliminated will be Albania, Slovenia, Romania, Georgia, Ukraine and Scotland, then Slovakia and Hungary. 

You'll note that includes none of the group D teams, supporting the theory that it really is a group of Death!!! I suspect one of Poland and Austria will be out instead of Ukraine. Group E more like the group of cuddly if you're Belgium.

Monday, 3 June 2024

Saints Ahoy - Visualisations from game 7 and the season to date

(Sorry for the break, RL happened with a vengeance) 

The most important thing about Easter weekend was that the forces of Good (Saints) beat the forces of Evil (Wigan) in the Good Friday game, somewhat against the run of form. 

In the sort of derby where it was 2-0 at half time, 3 people went off for Head Injury Assessments and there was somehow only 1 yellow card 

https://www.saintsrlfc.com/2024/03/29/saints-defeat-wigan-on-good-friday/ https://twitter.com/SuperLeague/status/1773756078875959601 - Tommy, Tommy Mak 

Those are the important rugby points ;) 

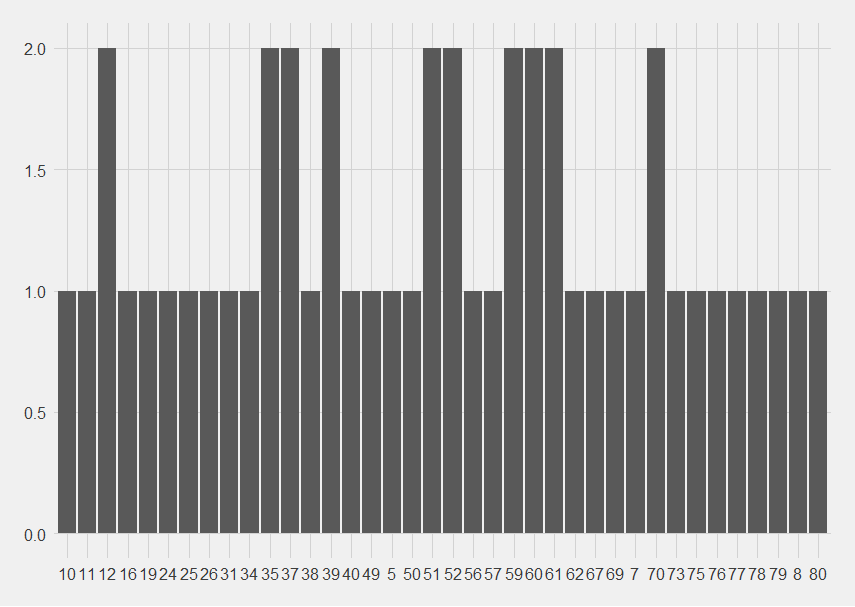
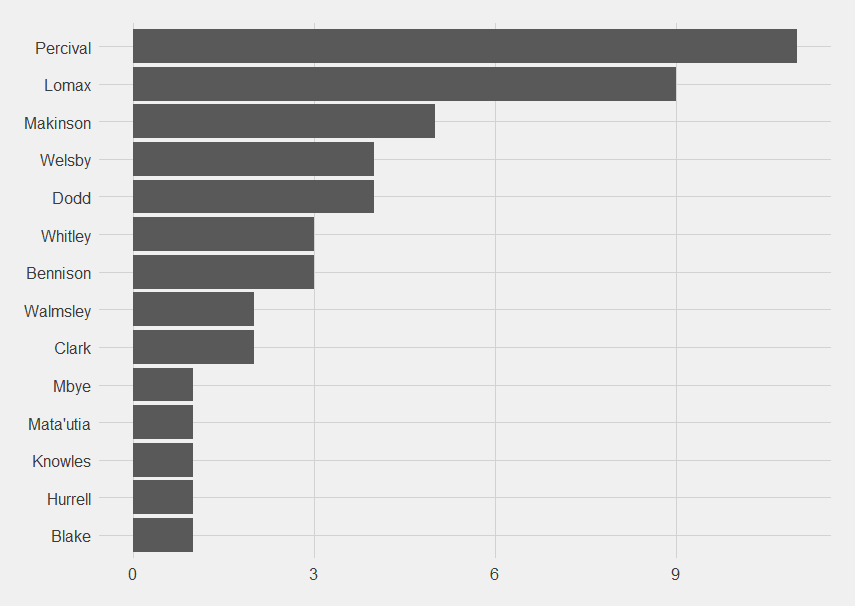
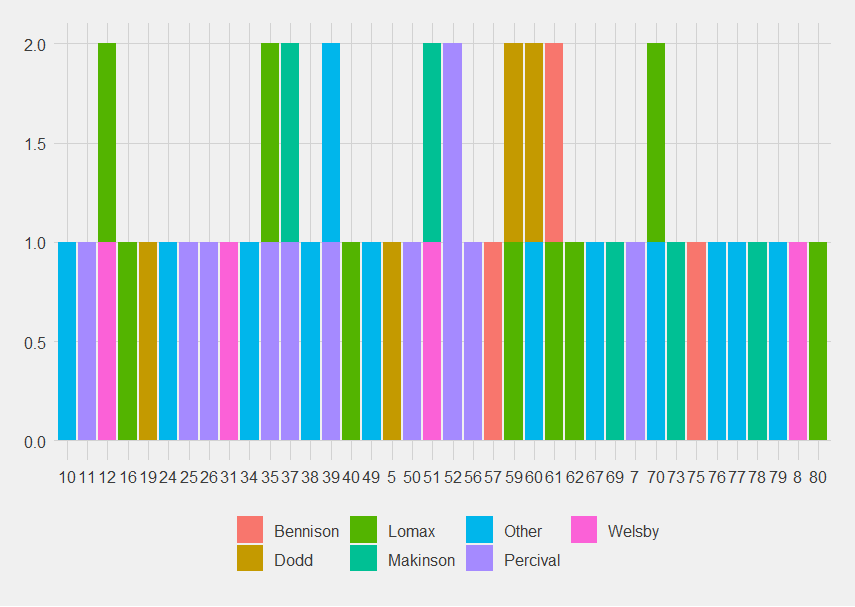
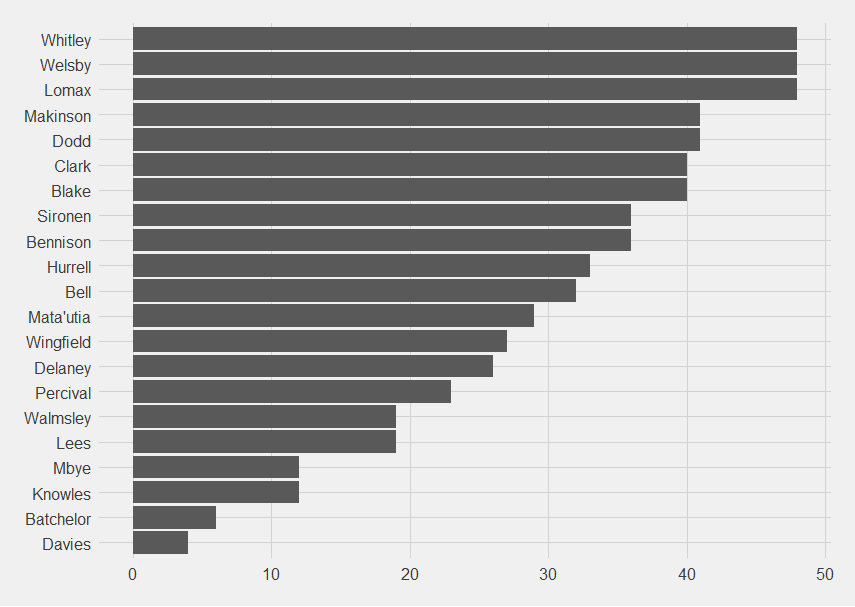
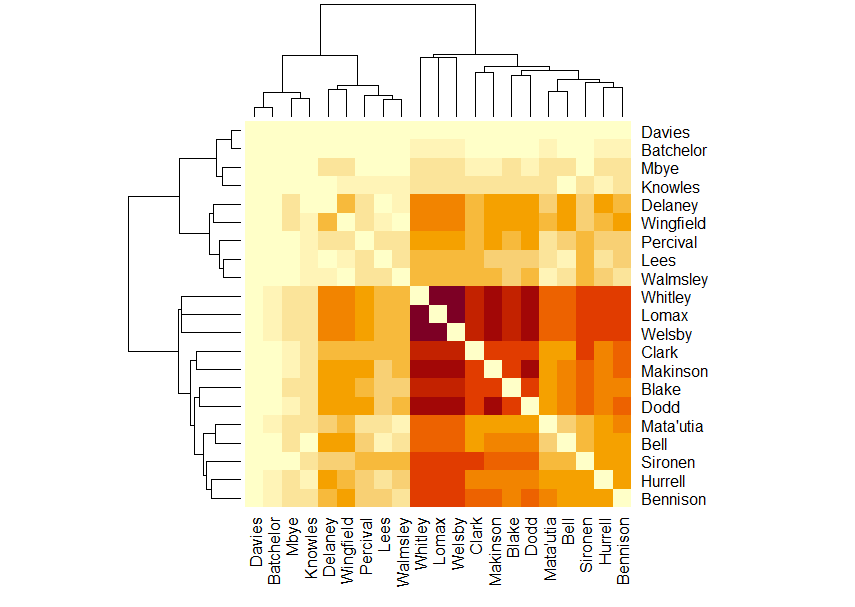
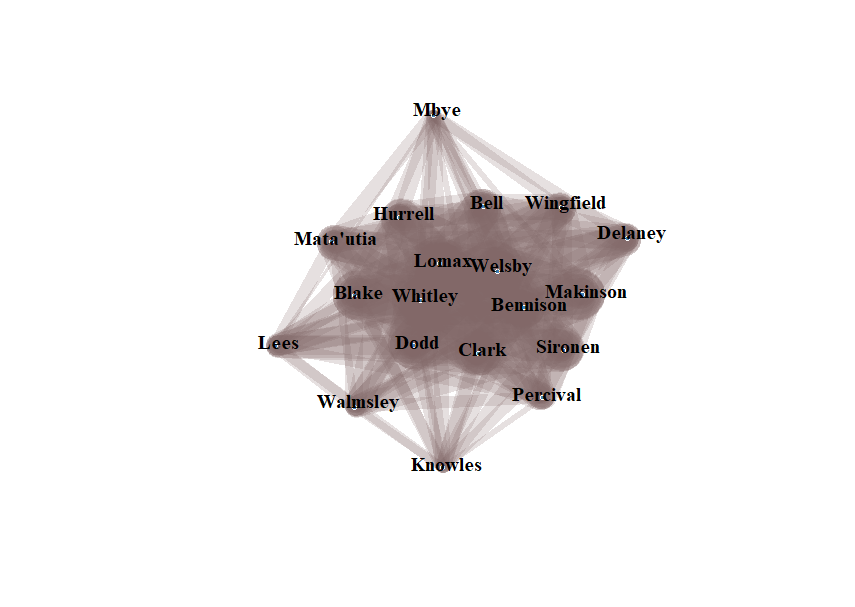
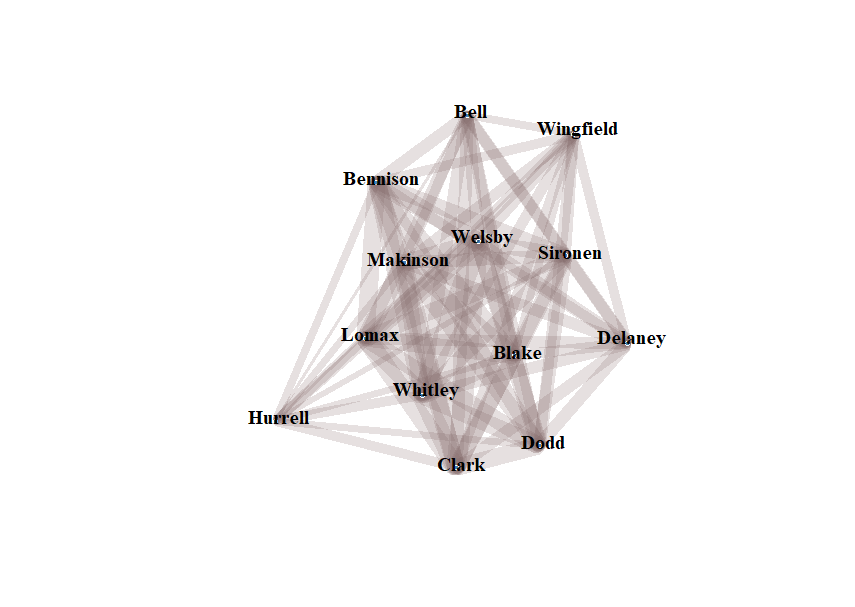
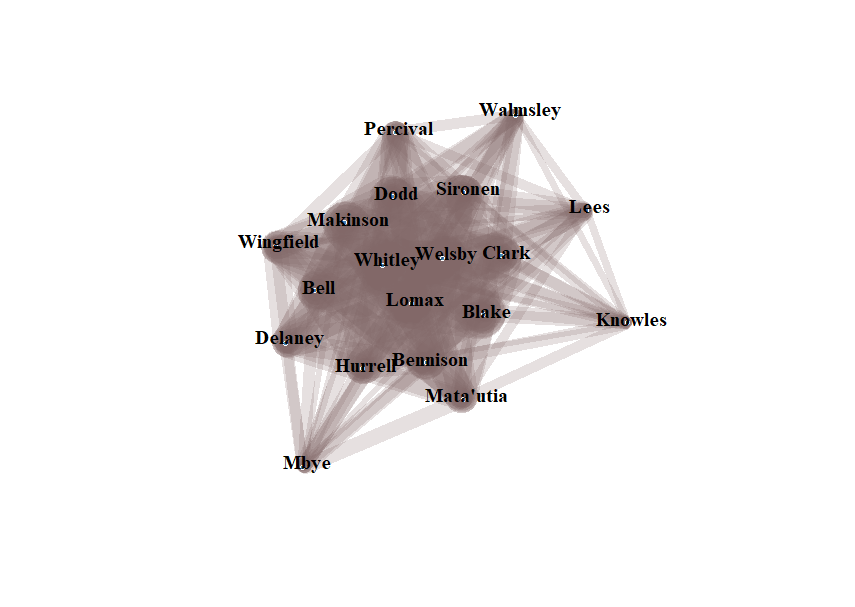
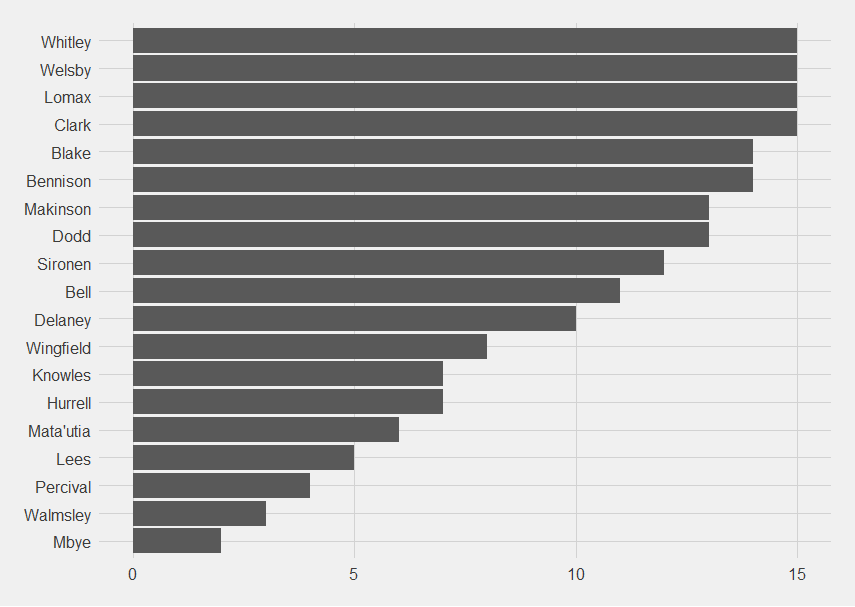
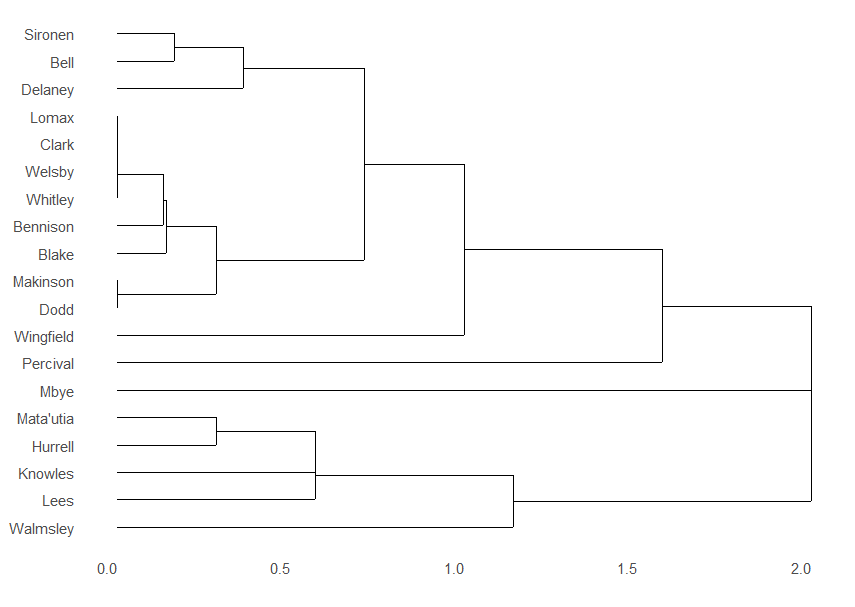
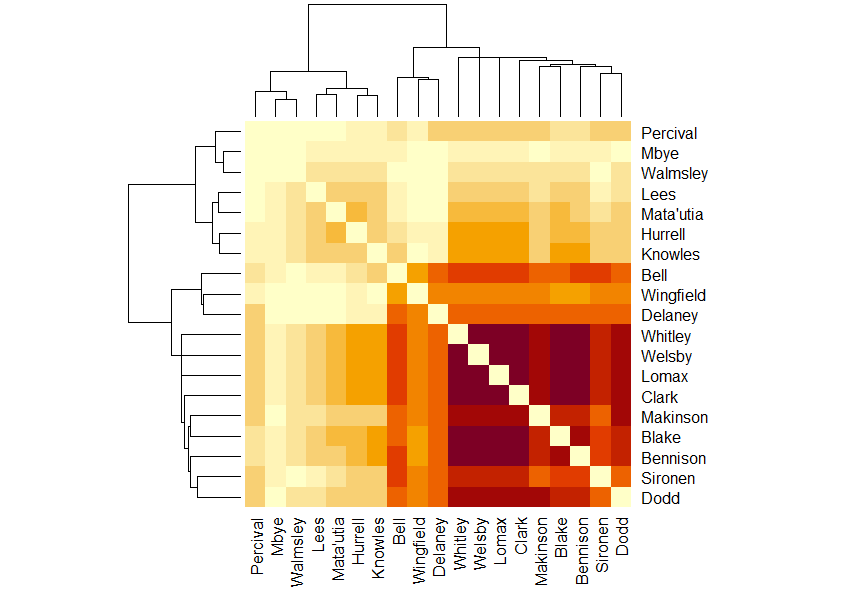
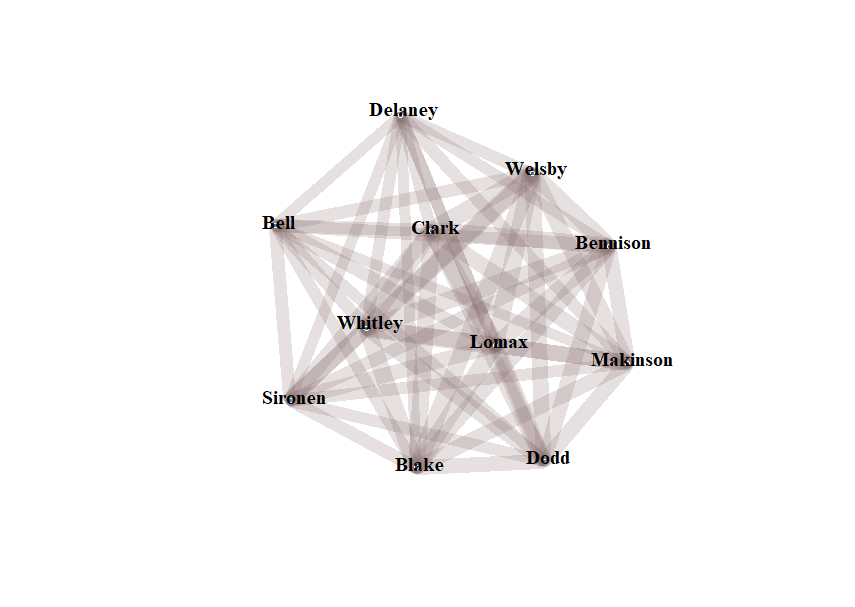
There is still no obvious pattern to when Saints score Bar chart showing when Saints score.  There are a couple of points where they have scored two points but no obvious pattern has emerged. Percival and Lomax, the kickers, are still the people with the highest number of point-scoring moments, as expected. Tommy Makinson is still doing his thing (Tommy Tommy Mak!) Percival has still has the most point-scoring moments with 11, then Lomax with 9.  Mbye, Matautia, Knowles, Hurrell and Blake have one each. But there's also no pattern to when they score. Bar chart of when Saints score, coloured by scorer. Only 3 players have been present for all point-scoring moments, Whitley, Welsby and Lomax. Bar chart showing which Saints players have been present when they scored.  Three players have been present for all point-scoring moments, Whitley, Welsby and Lomax who have been present for all 48.  Davies has been present for the least, with 4. In the matrix, the cluster of always theres has moved into the middle, possibly because there's so few of them. The purple in the middle is the ever-presents.  Paler means present together less often. There are now 19 people in the present when Saints score network graph, a central 15, plus Mbye, Lees, Knowles and Walmsley stuck out from them. Network graph.  There are a central 15 players and 4 around the outside.  The 4 around the outside are Mbye, Lees, Knowles and Walmsley. Moving over to when Saints concede. Our three ever presents are here as well but Bennison is there as well, which is unexpected. Not sure if he's just been unfortunate to be on the pitch when Saints are short-handed, or if I need to start shouting about defensive practise. Purple is the players who are together often when Saints concede.  Whitley, Welsby and Lomax are there as expected, but there is an extra purple line for Bennison. The network diagram for when Saints concede now has 13 players. The thirteen players in the present when Saints concede diagram are Bennison, Bell, Wingfield, Makinson, Welsby, Sironen, Lomax, Blake, Whitley, Delaney, Clark and Dodd, with Hurrell sticking out to the left. ~~~~ 
Given the sad news - Rugby league legend Burrow dies aged 41 (https://www.bbc.co.uk/sport/rugby-league/articles/c2qqwvwzp5zo) - if you like these posts and have a few quid to spare, there's a couple of funds that could do with donations: 
Motor Neurone Disease Association - https://www.justgiving.com/campaign/robburrow 
Rob Burrow fund - https://www.gofundme.com/f/leeds-players-association-supporting-rob-burrow Leeds Hospital Charity - https://www.leedshospitalscharity.org.uk/donate/mnd-centre-appeal

Friday, 19 April 2024

Formula 1 2024 - Australian Grand Prix

 Apparently, getting your appendix removed acts like go-faster stripes - https://www.bbc.co.uk/sport/formula1/68649296

Before any of the speed freaks get any ideas, that's a joke.

A Ferrari 1-2 should always be celebrated, except there's that sinking feeling that it was only possible because Max Verstappen's car broke.

Also, having the race carry on while a driver was trapped in his car on the circuit - not good. F1, you are better than that.

Wednesday, 17 April 2024

Saints Ahoy - Visualisations from game 6 and the season to date - now with the Challenge Cup

I was torn about including the Challenge Cup matches in this analysis. Because it's supposed to be covering the League, and the Cup is separate from the League. 

On the other hand, as L pointed out when I asked, Rugby League is not like football; because the Super League teams only join the cup in the 6th round, there isn't as much squad rotation. Therefore, I am going to include the Challenge Cup games. 

Of course, the minute I do that, Saints don't play two of their previous "always presents", Makinson and Dodd, in the Challenge Cup match against Leeds. Dodd was explained as a precautionary, but I'm not sure if an explanation was ever given for Makinson's absence. Saints also played Clark and Mbye together, which is also going to confuse the diagrams. 

This was the second away match against Leeds in a row, and sure, Saints had beaten them in the League (https://www.saintsrlfc.com/matches/2024/first-team/leeds-rhinos-v-saints-2024-03-15/) but I then had the fear over the Challenge Cup match. Saints won (https://www.saintsrlfc.com/2024/03/22/saints-progress-to-challenge-cup-quarter-finals/

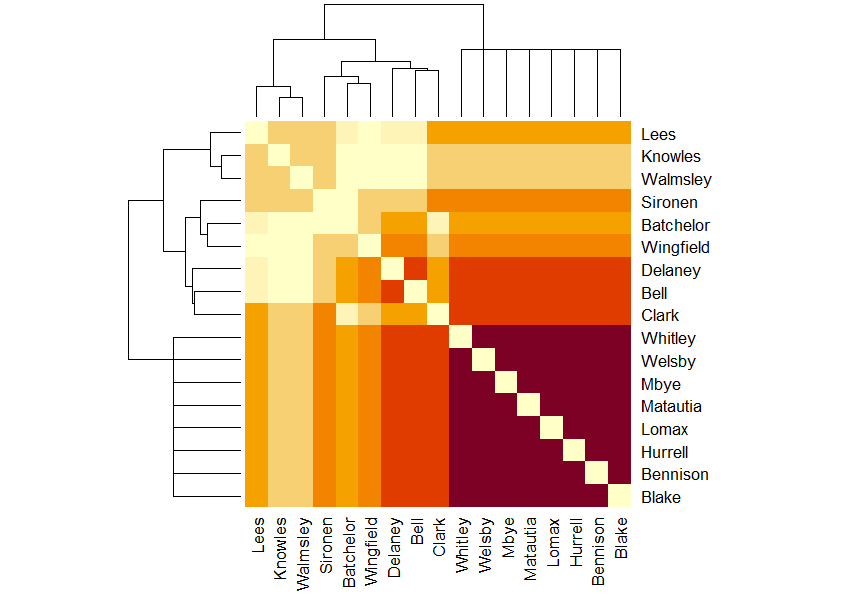
The changes to the team meant the "play together when Saints score in game 6" matrix looks like this: There is a cluster of dark purple always together of Whitley, Welsby, Mbye, Matautia, Lomax, Hurrell, Bennison and Blake.  Then there is the orange of Delaney, Bell and Clark.  Sironen and Wingfield are the next level of orange down, but they are split by a yellow-orange Batchelor.  Lees at the top is the next orange, between Lees and Sironen are the palest, Knowles and Walmsley. The most interesting thing to me is that the crossing point for Batchelor, Wingfield, Delaney, Bell and Clark and Knowles and Walmsley is so pale, suggesting that those two don't play on the pitch with the others when Saints score. 

Because this was the second match of Percival's ban (https://fulltimesportsfan.wordpress.com/2024/04/05/saints-ahoy-visualisations-from-game-4-and-the-season-to-date/), Lomax who took over the kicking duties from Percival really has shot up the "Point-scoring moments, season to date" chart.
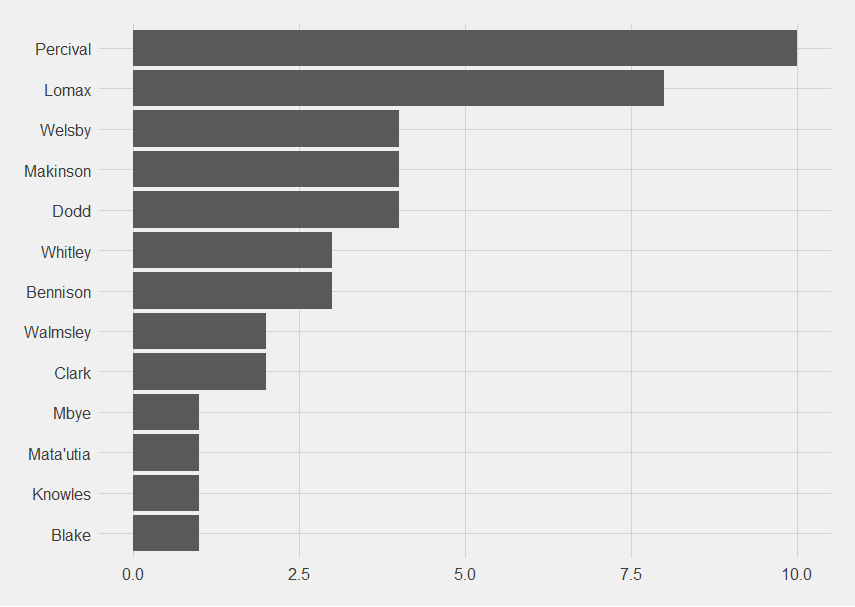
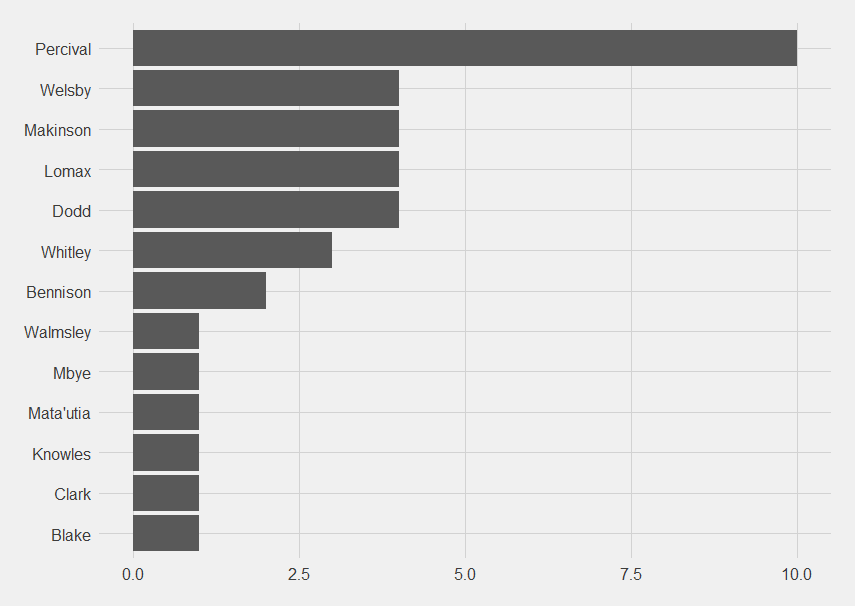
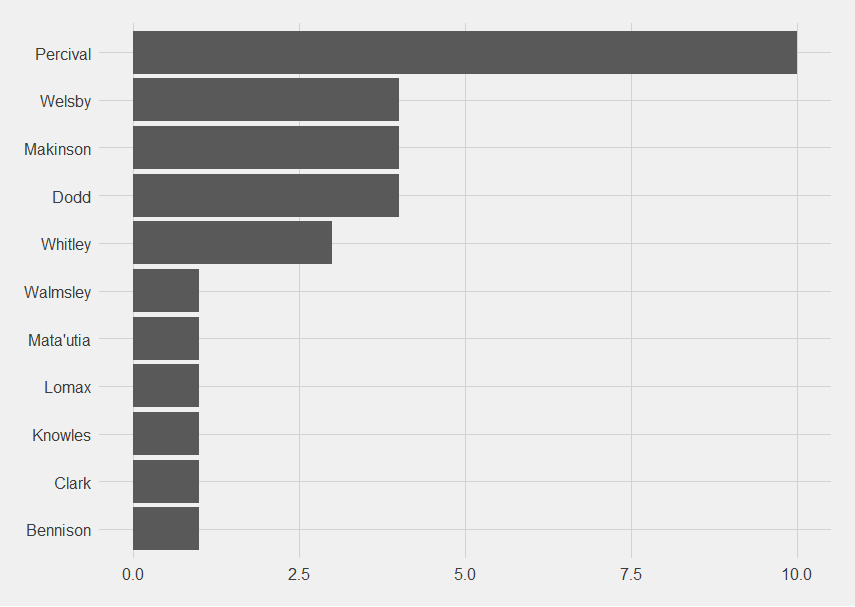
  Bar chart.  Percival still has the most with 10.  Lomax now has 8.  They are followed on 4 by Welsby, Makinson and Dodd, then Whitley and Bennison on 3, Walmsley and Clark on 2, then Mbye, Matautia, Knowles and Blake on 1. 

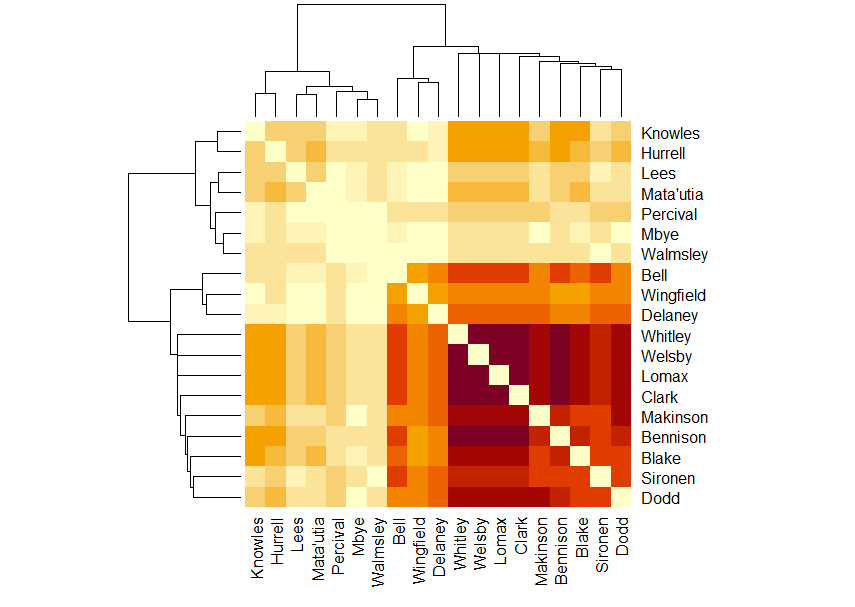
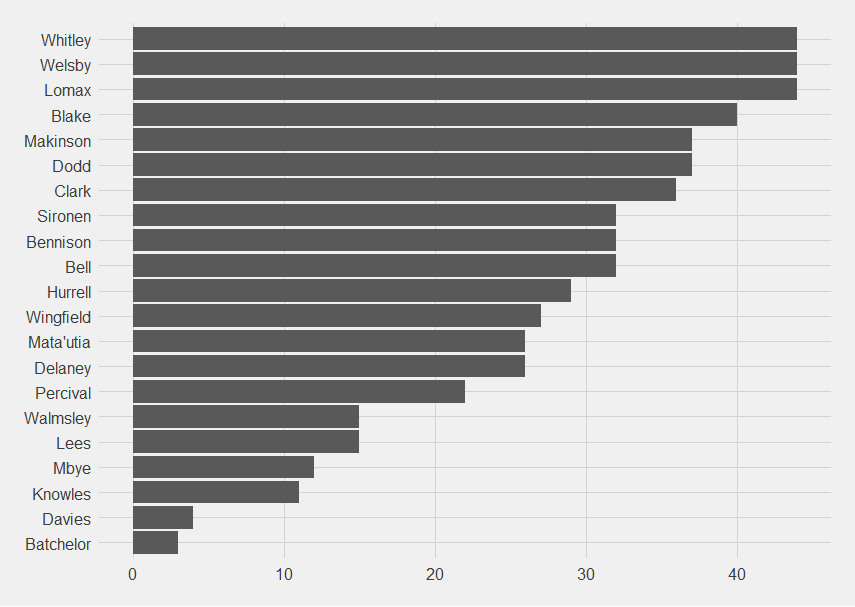
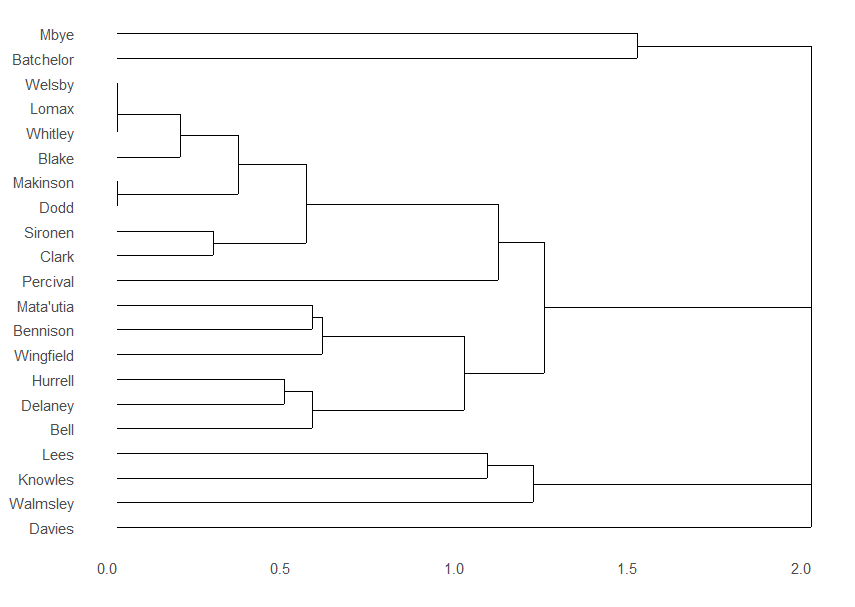
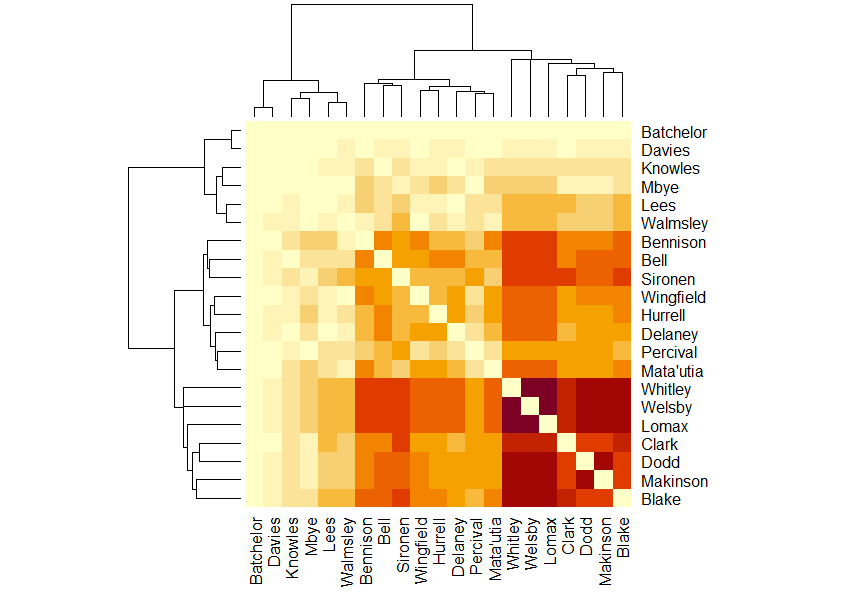
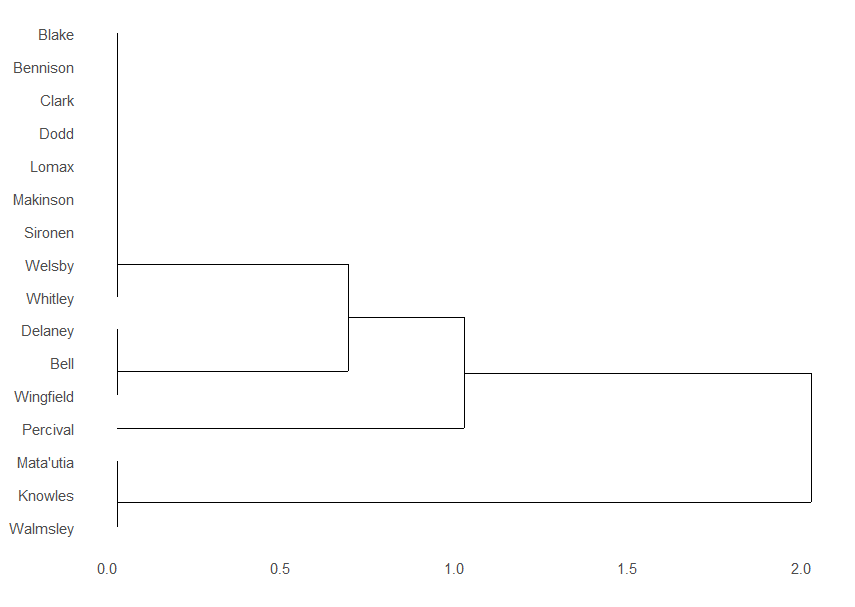
In the point-scoring moments present for diagram, for the season to date, the Whitley, Welsby, Lomax, Dodd and Makinson group has been broken up. Bar chart - Whitley, Welsby and Lomax are the only players present for all point-scoring moments.  Blake has been present for 40.  Then come Makinson and Dodd.  On the bottom end, Batchelor is finally present (yay!), then Davies and Knowles. The dendrogram has become very complicated. Deliberately not writing every players name.  There are now three clusters.  At the bottom, there are Lees, Knowles, Walmsley and Davies, the lesser used props.  Then there is a frequently present group that are not tightly clustered, and finally Mbye and Batchelor stuck out at the top. Which also makes the matrix complicated. The purple cluster is now only Whitley, Welsby and Lomax.  The two dark red patches are where their lines cross those of the other players who play often.  The dark orange is the players one step less frequent.  There is one sticky out dark orange square for where Sironen and Clark cross.  The medium orange are the next step down.  The medium orange chunk is broken up by a line of yellow for Percival, thanks to him being subbed off early in games and because he missed two matches suspended.  Lees and Walmsley are the next palest, then Mbye, Knowles, Davies and Batchelor. 

As well as Sironen and Clark's crossing point being darker than their surrounding area, suggesting they play together more often, so is Clark and Lees and Walmsley and Sironen, while Walmsley and Clark, Clark and Delaney and Percival and Blake have paler crossings than expected. 

The network diagram looks like this: There is a central cluster of Welsby, Whitley and Lomax, surrounded by an outer ring of (clockwise from top) Dodd, Sironen, Clark, Blake, Bennison, Hurrell, Bell and Makinson.  Outside them to the left are Wingfield and Delaney, and Matautia to the bottom.  Sticking out at the top is Percival, then Walmsley, Lees and Knowles to the right, and Mbye at the bottom left. 

It's now 19 players. 

It's interesting that his suspension for two games has moved Percival out of the middle, and there's now a decided cluster of replacement props at the left. 

Looking at the concession diagrams, Clark is higher up in this than expected. Present for all 15 of them are Whitley, Welsby, Lomax and Clark.  Mbye is present for the least with 2. Whitley, Welsby and Lomax are ever presents so their presence makes sense. Clark's less so. 

The dendrogram is three clusters, and three straight lines: Starting from the bottom, the first cluster is Matautia, Hurrell, Knowles, Lees and Walmsley, then there are the three straight lines of Mbye, Percival and Wingfield, then the frequently present cluster, and at the top is another forward cluster of Delaney, Bell and Sironen. 

I do find it interesting that there's two separate forward clusters, possibly suggesting forward pairings. 

The matrix looks like a zoomed-in tartan. The dark purple cluster is cut through by a single red-brown line, causing the tartan effect.  The red-brown line is Makinson. The Blake and Mata'utia, Mata'utia and Hurrell, Sironen and Bell and Bennison and Bell crossing squares are darker than expected, while the Bennison and Mata'utia, Makinson and Sironen, Mbye and Makinson and Walmsley and Sironen crossings are lighter than expected. 

The concession network graph still only has 11 players on it. It is now a central trio of Clark, Whitley and Lomax, surrounded by (clockwork from the top), Delaney, Welsby, Bennison, Makinson, Dodd, Blake, Sironen and Bell. 

I'm not sure why Welsby is in the outer ring, not the middle. 

I don't think it's quite at the point where I can guess the starting 17, but I think it's getting there. I blame uncertainty around the forwards.

Saturday, 13 April 2024

Saints Ahoy - Visualisations from game 5 and the season to date

I told you I was trying to catch up with everything that I'd missed. I am aware I am 3 rugby league games (about to be four) and 2 F1 races behind. 

The Leeds Rhinos vs St Helens Saints league game (https://www.saintsrlfc.com/matches/2024/first-team/leeds-rhinos-v-saints-2024-03-15/) was the first of two back-to-back games vs Leeds. Despite Leeds's poor start to the season (by their standards), I was quite worried about this game. 

Saints proceeded to not help matters by not turning up for the first quarter of the match.

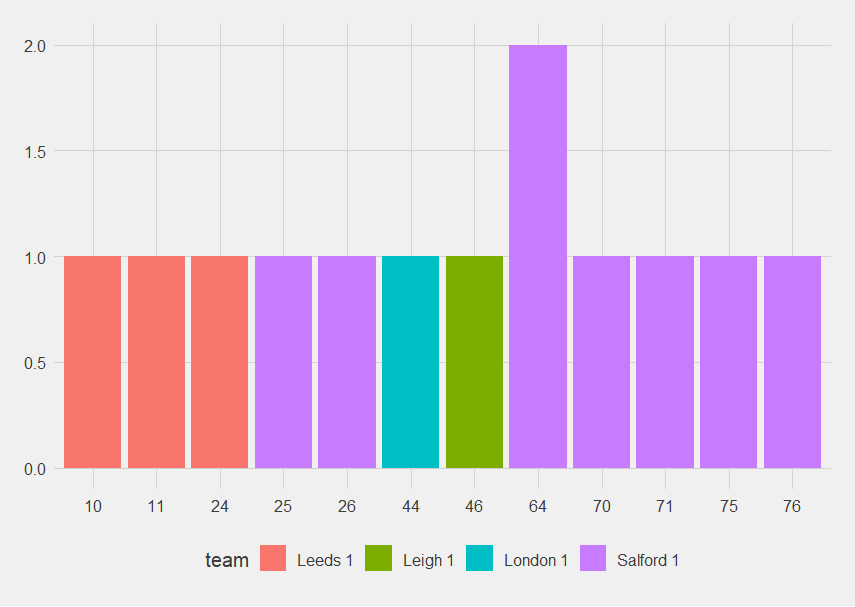
When Saints conceded:   Bar chart showing when Saints conceded over the first five games.  In pink are Leeds.  All of their points were scored in the first 24 minutes. 
This match was also the first time the Saints live text has let me down. 

I know Mbye must have come on before he scored, but it didn't say when, so there's now going to be a slight * against him and Clark's data (because if he came on for anyone, it was Clark as they are our hookers). The advantage to getting data over a whole season is that one oops ought to be watered down. 

Who scored for Saints up to game 5? Bar chart.  Percival is still top with 10 point-scoring moments, because he is the main kicker for Saints.  Next, on four point-scoring moments each, are Welsby, Makinson, Lomax and Dodd, followed by Whitley on three, Bennison on two, and Walmsley, Mbye, Matautia, Knowles, Clark and Blake on 1. With Percival missing the game due to being sent off in the last game (https://fulltimesportsfan.wordpress.com/2024/04/05/saints-ahoy-visualisations-from-game-4-and-the-season-to-date/), Lomax took over the kicking duties, which is why he has risen so far up that bar chart.

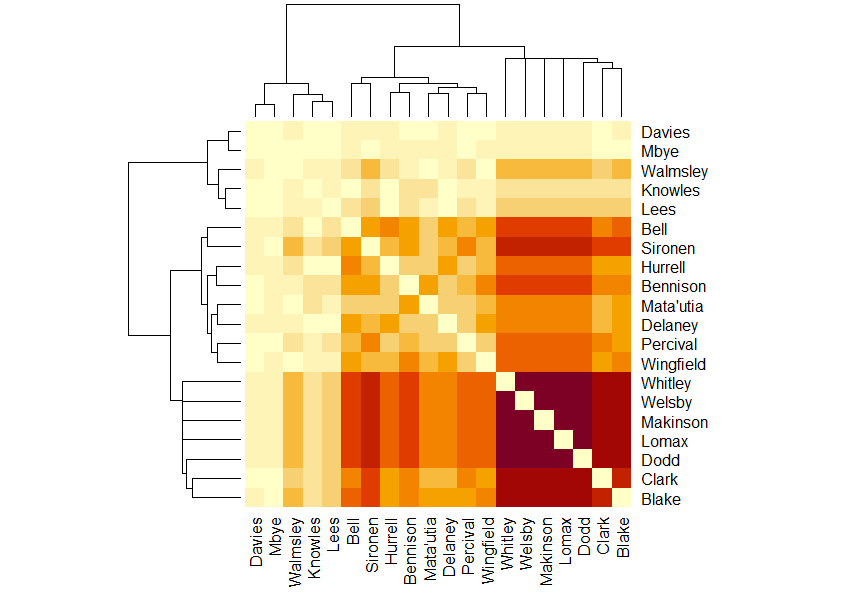
Okay, let's look at point-scoring moments players were present for: Whitley, Welsby, Makinson, Lomax and Dodd have been present for all 37 of the point-scoring moments for Saints.  Davies has been present for the least with 4, then Mbye with 5 and Knowles with 9. 

The dendrogram for when players are on the pitch together at Saints's point-scoring moments has become more complex, there's only really one true cluster left, of Lomax, Makinson, Dodd, Welsby and Whitley. 

What is interesting is that there's now two clear "families" of players, Lees, Knowles, Walmsley, Davies and Mbye in one, and everyone else in the other. I know Lees and Knowles haven't played as much as I would have expected, Davies barely at all, and Mbye only when they need to spell Clark, but I felt Walmsley had played more. So count one for stats telling you something you don't feel.
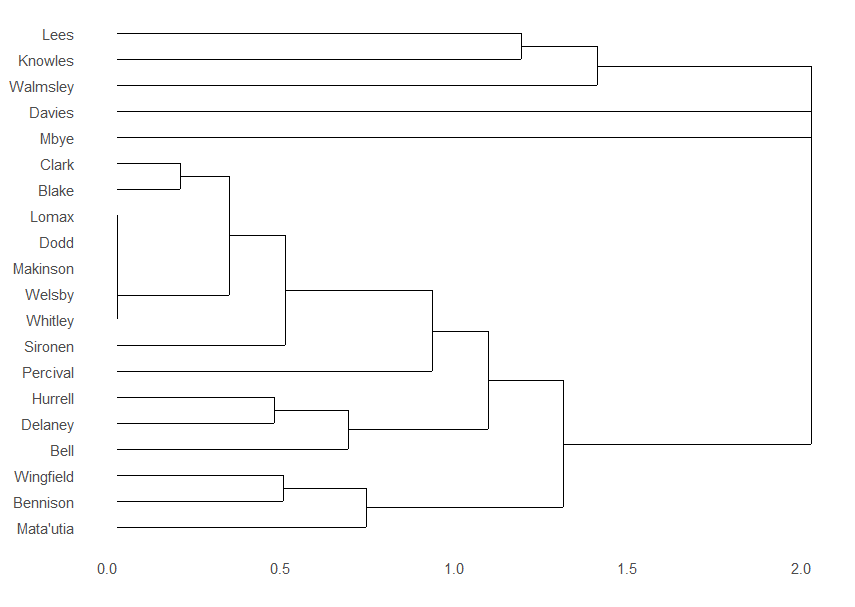
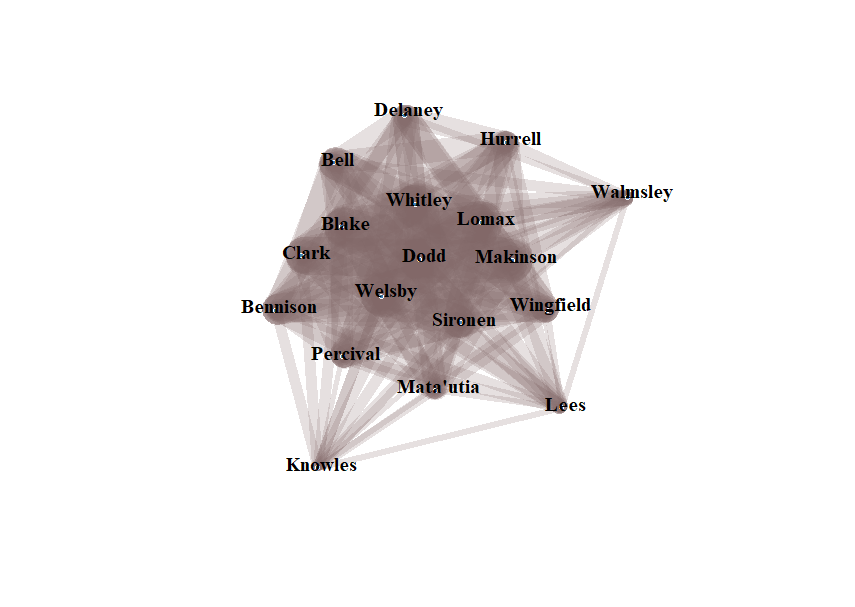
  The important points of the dendrogram are described in the text above. On the other hand, the matrix diagram does have Walmsley in a darker colour than the others so maybe he is just very effective when he is on the pitch. The matrix makes it look like three groups, the Lees, Knowles, Walmsley, Davies and Mbye one, then Bell, Sironen, Hurrell, Bennison, Matautia, Delaney, Percival and Wingfield, then finally the darker coloured group of Whitley, Welsby, Makinson, Lomax, Dodd, Clark and Blake. The network graph is now an interesting shape, with a central cluster with Walmsley, Lees and Knowles hanging off. There is a slightly left offset central core of Delaney, Bell, Hurrell, Clark, Blake, Whitley, Welsby, Dodd, Lomax, Bennison, Percival, Sironen, Wingfield and Matautia.  Hanging off the core are Walmsley, Lees and Knowles. 
Looking at when Saints concede instead: Whitley, Welsby, Makinson, Lomax, Dodd and Clark have been present all 13 times Saints conceded.  Then Blake and Bennison on 12.  Walmsley and Lees are present for the least, with 3, then Percival and Matautia with 4 and Knowles and Hurrell for 5. 
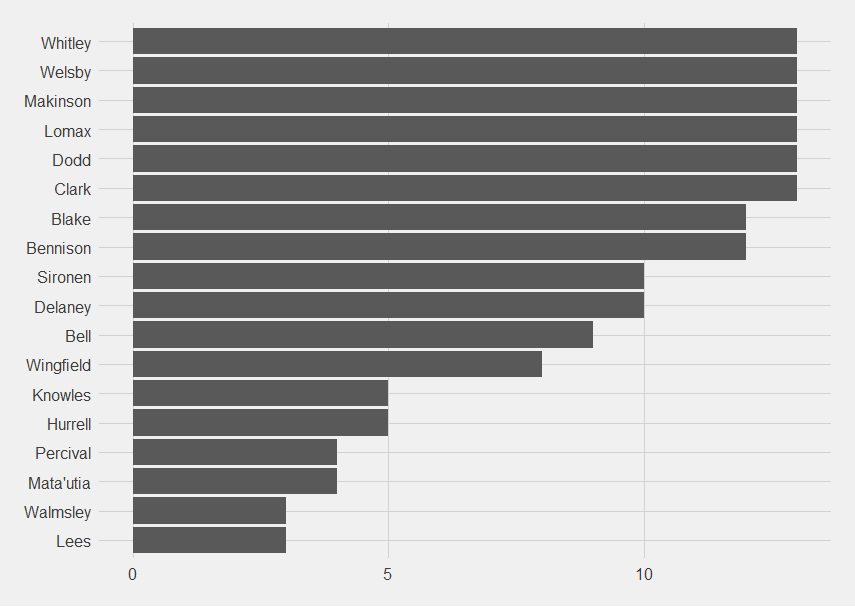
The players present for the most (Whitley, Welsby, Makinson, Lomax, Dodd and Clark) are the ones that have been present the most when Saints score, with the exception of Clark who is sometimes swapped out for Mbye. 

Looking at the players present for the least, Walmsley and Lees are present for the least, with 3, then Percival and Matautia with 4 and Knowles and Hurrell for 5.  I'm starting to wonder if I have anyway of looking at it divided by time played, because I know Percival was being subbed out at 50 mins even before the sending off. 

The concession dendrogram has the same pattern as the bar chart. 

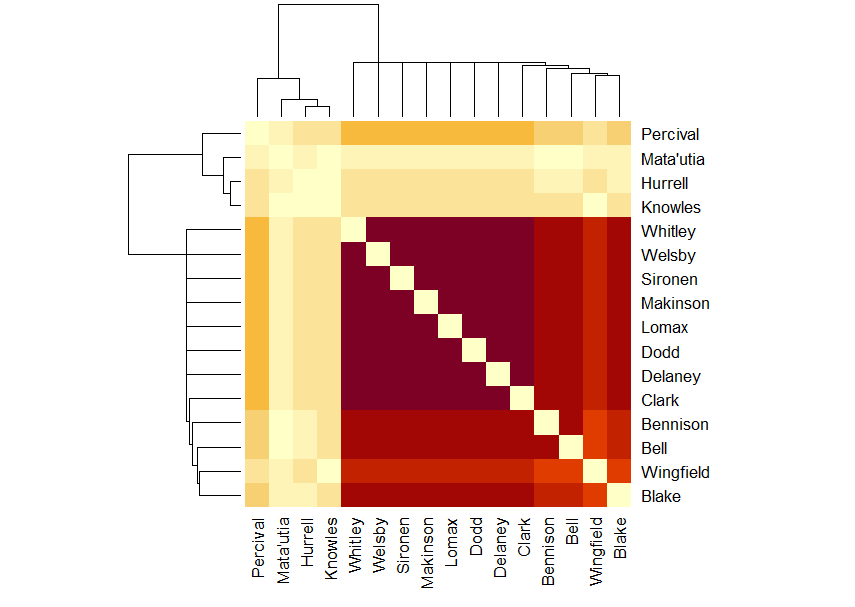
The concession matrix has an interesting pattern of colours You would expect only one dark cluster, of Whitley, Welsby, Makinson, Lomax, Dodd and Clark.  That dark cluster is present, but there is a second dark cluster of Blake and Bennison, separated from the other by Sironen and Delaney (their own dark orange cluster), Wingfield (who is his own medium shade of orange) and Bell (darker orange than Wingfield, not as dark as Sironen and Delany).  The points where Sironen, Delaney, Wingfield and Bell cross Matautia, Lees and Walmsley are so pale that it is clear that they do not play together. 
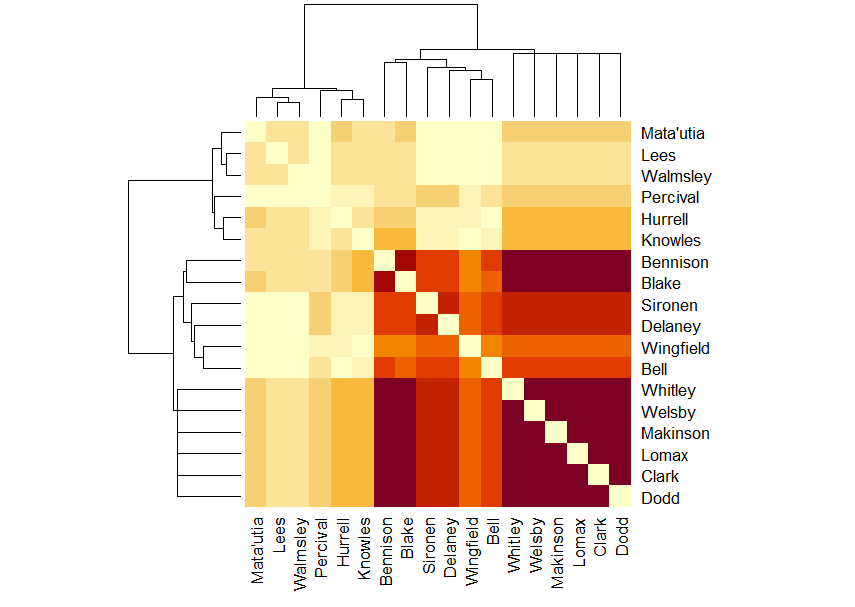
I was only expecting one really dark cluster, not two, and the points where Sironen, Delaney, Wingfield and Bell cross Matautia, Lees and Walmsley are so pale that it is clear that they do not play together, so I think we can really start to see who the forward pairings are when Saints concede. 

Wingfield and Knowles don't play together, and neither do Bell and Hurrell. 

That Percival doesn't play with Matautia, Lees and Walmsley is unexpected. 

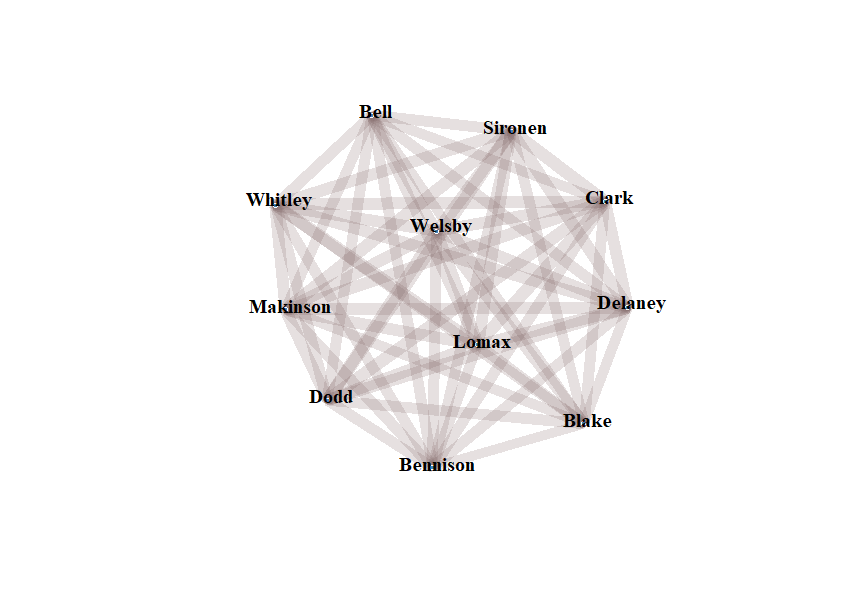
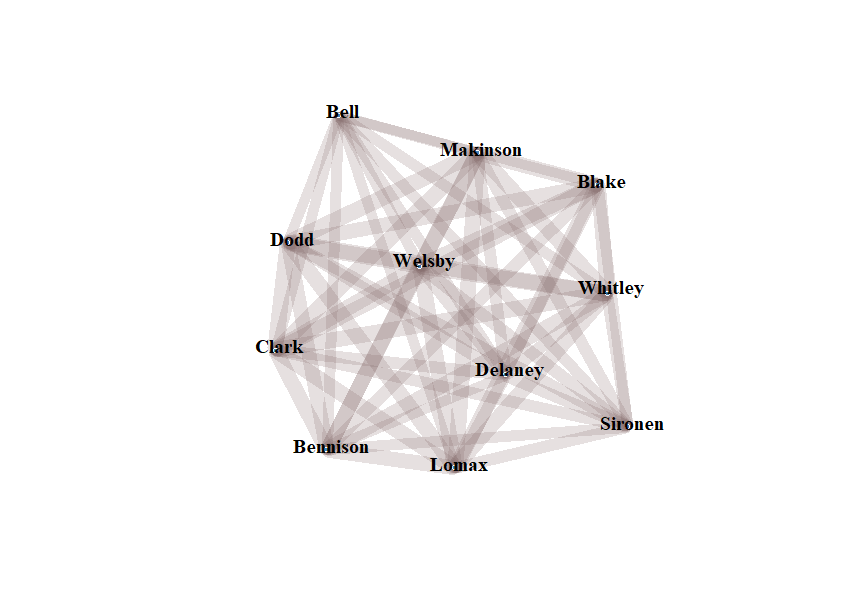
There are still only 11 players on the "when Saints concede" network diagram, Welsby and Delaney are still in the centre, surrounded by (clockwise from top) Makinson, Blake, Whitley, Sironen, Lomax, Bennison, Clark, Dodd and Bell.
Friday, 5 April 2024

Saints Ahoy - Visualisations from game 4 and the season to date

(Delayed due to extreme RL busyness)

L was slightly concerned that I hadn't stated that I was a Saints fan quite loudly enough in my previous posts. I think it may become obvious throughout this summary of the Saints vs Salford match. All winning runs have to come to an end, and 44 years is a pretty long time to not be beaten at home (https://www.bbc.co.uk/sport/rugby-league/68501496 / https://www.saintsrlfc.com/matches/2024/first-team/saints-v-salford-red-devils-2024-03-08/) and they needed Percival to get sent off for goodness knows what to beat Saints. 

That does explain why Percival is, once again, alone in the dendrogram. Dendrogram - players are in 4 groups.  A large group with Blake, Bennison, Clark, Dodd, Lomax, Makinson, Sironen, Welsby and Whitley, then a second group of Bell, Delaney and Wingfield, a group of Matautia, Knowles and Walmsley, and Percival on his own. 

It shows you that Sironen put one heck of a shift in to cover for Saints being a man down. 

This match has an interesting effect on the "up to the end of game 4" charts. 

When Saints score still hasn't really built up into an informative pile of data, but point-scorers (no division between tries and kicks) is starting to: Percival has the most point-scoring moments with 10, followed by Welsby, Dodd and Makinson on 4.  Then there is Whitley on 3, then Walmsley, Matautia, Lomax, Knowles, Clark and Bennison. Percival having the most moments makes sense, with him being the kicker (if only he could convert more often), and Dodd and Makinson who can also kick makes sense, Welsby up there highlights his wonderful poaching abilities. Whitley on 3 is an unexpected bonus. He's working out well so far, isn't he? 

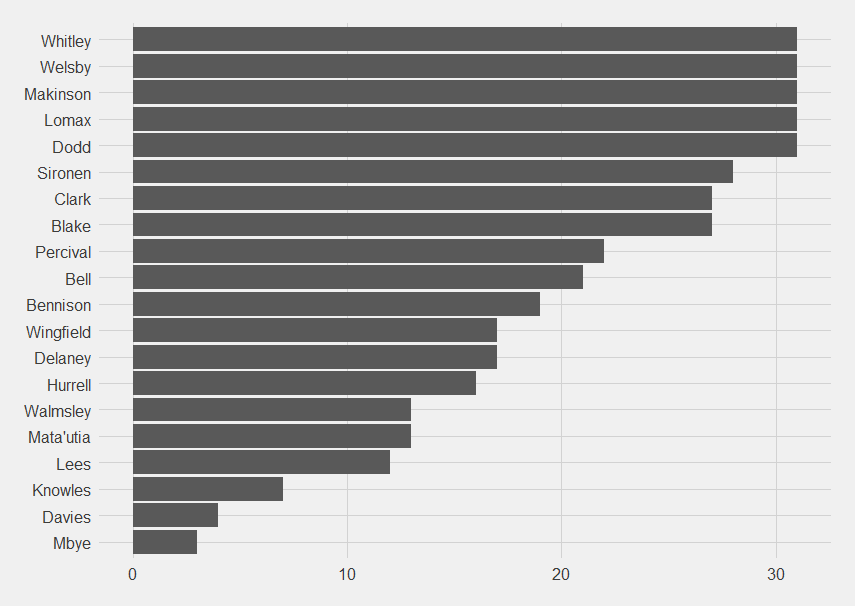
Point-scoring moments present for also highlights those players, and makes it clear Clark is definitely first choice hooker. Point-scoring moments present for.  Whitley, Welsby, Makinson, Lomax and Dodd in the joint lead with 31, then Sironen (who really is putting in some shifts), Mbye is at the bottom with 3, then Davies on 4 and Knowles on 6. 

I do like how high up some of the academy grads are. I mean the most recent crop, not some of the older heads (help, Lomax is now an older head). 

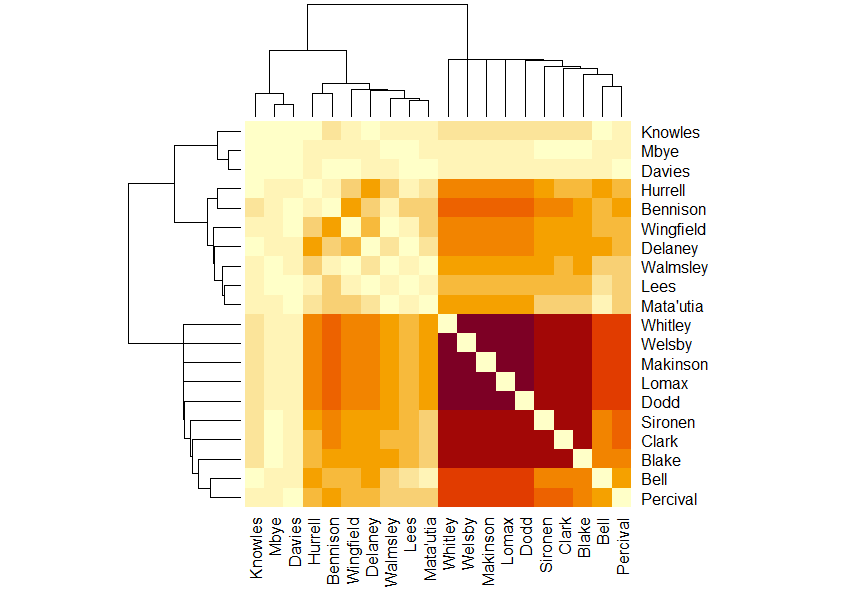
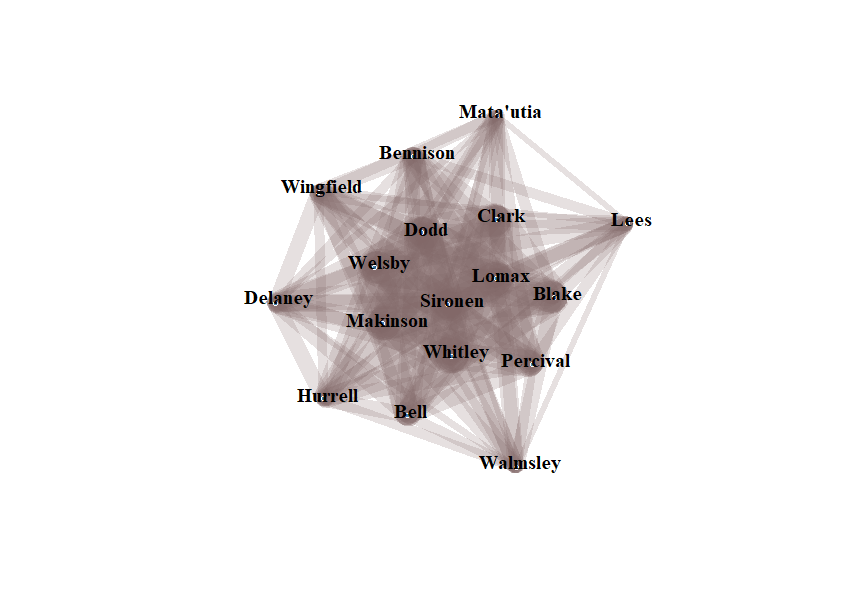
The matrix is starting to look complicated: The dark purple patch is Whitley, Welsby, Makinson, Lomax and Dodd.  The thing that catches my eye is that Bennison is a much darker orange than I would expect for where he is in the diagram.  It suggests not on often, put plays with the heavy point scorers when he does. Sironen is at the centre of the diagram.  Around him are (starting from top and moving clockwise) Dodd, Clark, Lomax, Blake, Percival, Whitley, Makinson and Welsby.  The outer ring are Matautia, Lees, Walmsley, Bell, Hurrell, Delaney, Wingfield and Bennison. The network diagram does give a nice matchday 17 - Sironen, Dodd, Clark, Lomax, Blake, Percival, Whitley, Makinson, Welsby, Matautia, Lees, Walmsley, Bell, Hurrell, Delaney, Wingfield and Bennison.

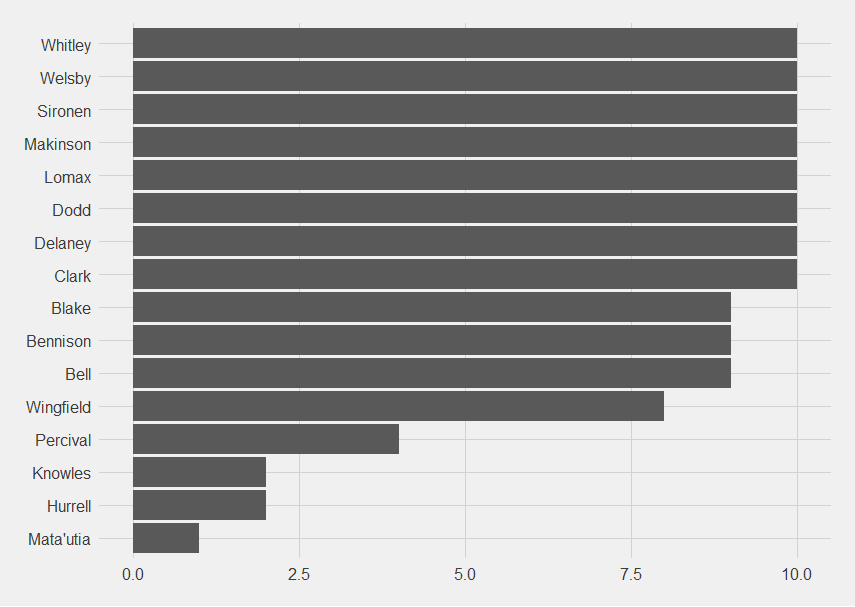
Because Salford scored several points, there's now enough data to have some solid numbers for "players present when Saints concede". The only problem is it won't include Percival as much as it maybe should given his sending off was sort of responsible for some of the concessions. Whitley, Welsby, Sironen, Makinson, Lomax, Dodd, Delaney and Clark are present for the most with 10, followed by Blake, Bennison and Bell with 9, Wingfield with 8, Percival with 4, Knowles and Hurrell on 2 and Matautia with 1. Percival is also a darker colour than expected on the concession matrix. The dark purple patch is Whitley, Welsby, Sironen, Makinson, Lomax, Dodd, Delaney and Clark.  Percival is a darker sand colour, even though he is at the top of the diagram where I expect much paler colours. The network diagram for players present when Saints concede only has 11 players on. In the centre, like binary stars, are Welsby and Lomax, they are surrounded by (clockwise from the top) Sironen, Clark, Delaney, Blake, Bennison, Dodd, Makinson, Whitley and Bell. The diagrams are mostly making me appreciate Sironen at lot more. There's a reason why Saints fans rate him.