Match report here - https://www.saintsrlfc.com/matches/2024/first-team/saints-v-hull-fc-2024-04-19/?swcfpc=1
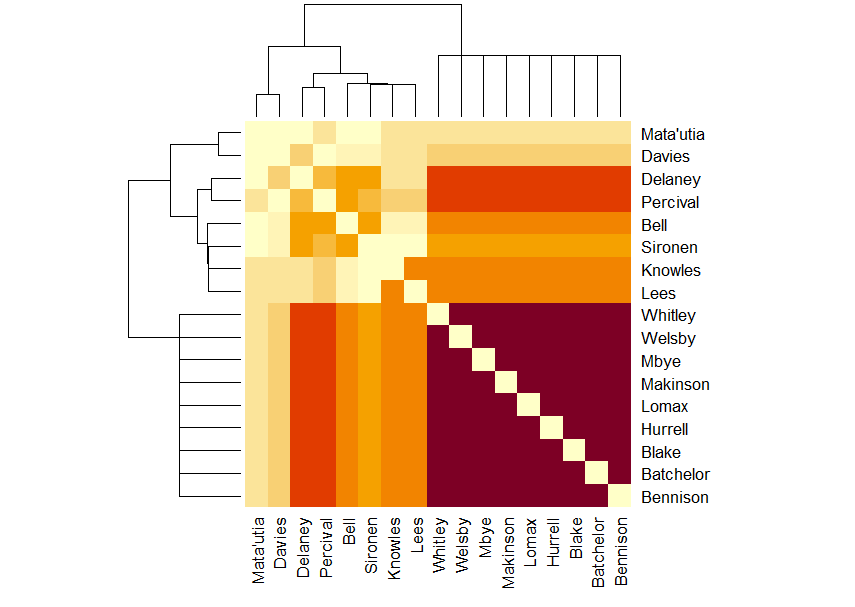 Because this only covers one game, it's a very clear picture of who plays together.
It's even clearer on the network graph.
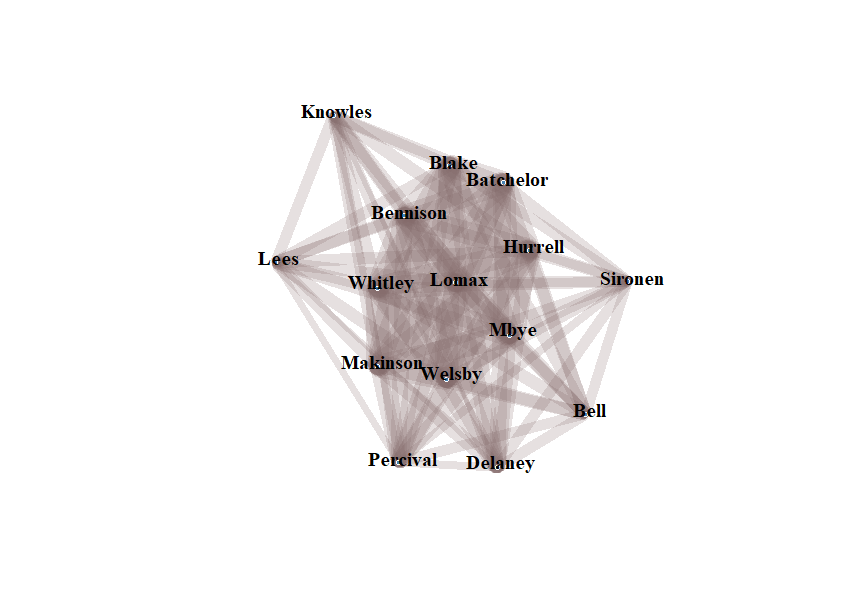
The players who stick out are the ones who were subbed at any point.
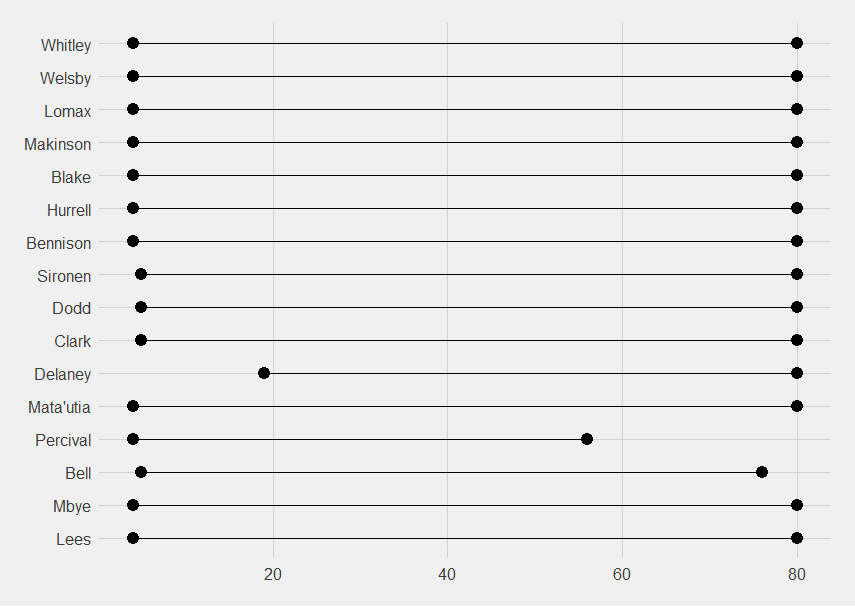
That Saints are still wrapping Percival up in cotton wool at minute 50, a pattern they've maintained through out.
Things have happened to the season-long matrix graph, I think because there were many point-scoring moments but several of the more fringe players were playing.
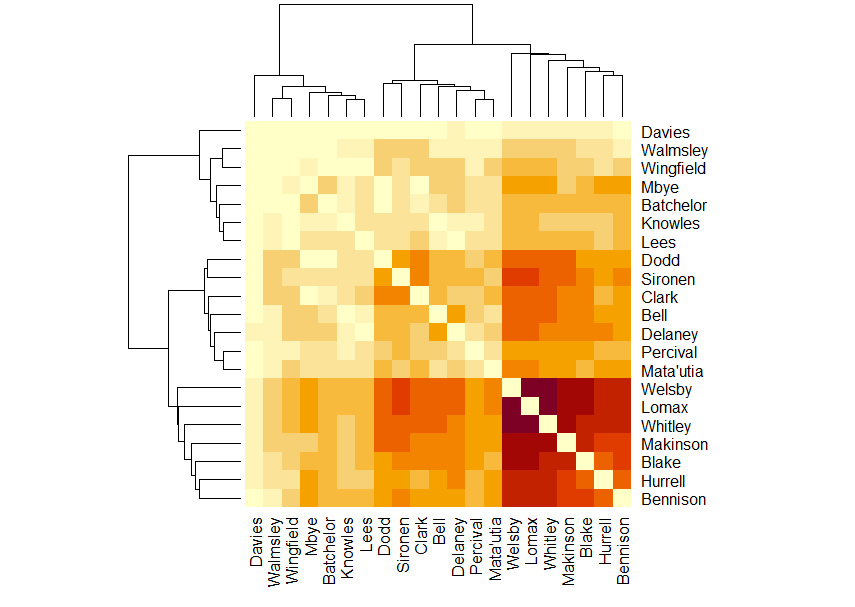 Welsby, Lomax and Whitley are still the darkest purple because they're still together most often.
Hurrell, Percival, Clark and Knowles play together less often than you'd expect. Same for Blake, Mata'utia and Knowles. Makinson and Knowles and
Whitley and Knowles
I think the Knowles thing is because he's been injured but when he's fit he plays lots of minutes.
Sironen plays more often than you'd expect with Welsby and Lomax Clark plays more often than you'd expect with Sironen and Dodd. Mbye plays more often than you'd expect with Welsby, Lomax, Whitley, Hurrell and Bennison, but I think that's all from this game because he played all of it instead of Daryl Clark and there were so many point-scoring moments (19 out of a total of 71 for the season).
As the season developed, I was a little disappointed in how the matrix didn't seem to develop into an interesting pattern, but it really has developed after this.
The network graph has also developed with the lines in the centre becoming really thick.
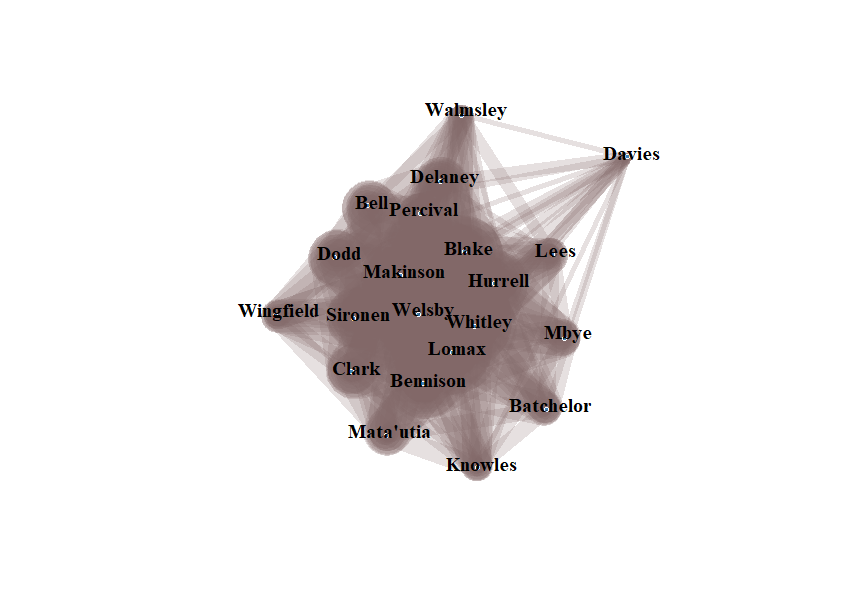
The network diagram has become a large central blob with players hanging off if they play less often.
I know Wingfield, Knowles and Walmsley have been injured, I think Davies was too, and Mbye is the spare hooker after Darryl Clark.
There were enough point-scoring moments that there are game-specific diagrams that are worth sharing.
Because this only covers one game, it's a very clear picture of who plays together.
There is starting to be a shape to when Saints score.
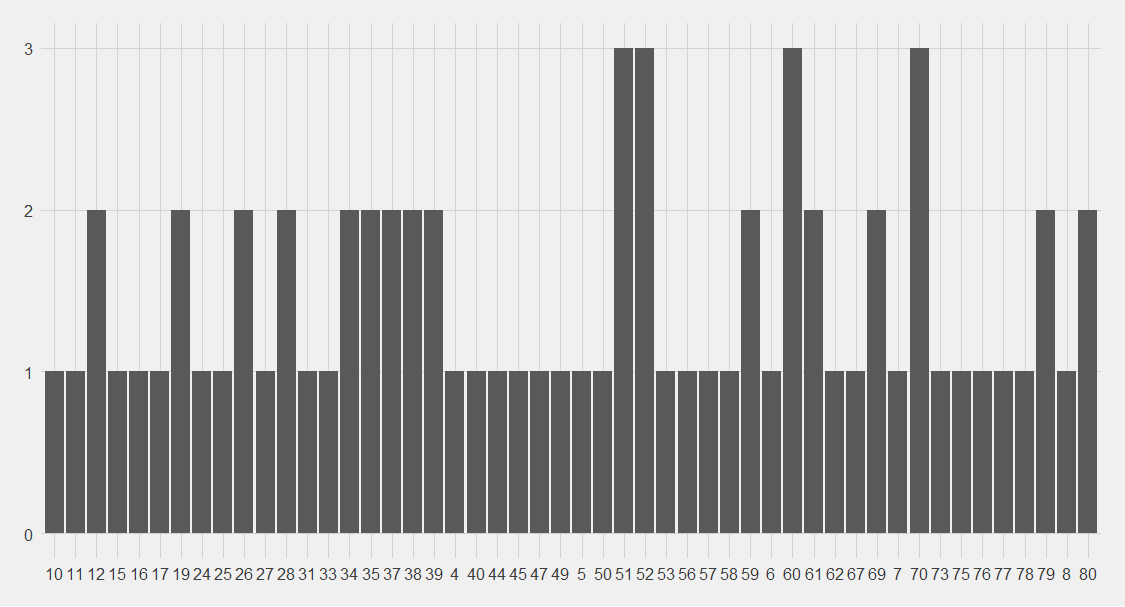 While it's nice to see consistent storing at minutes 51, 52, 60 and 70, I am also very happy with the cluster between minutes 34-40 where Saints have already had two point-scoring moments.
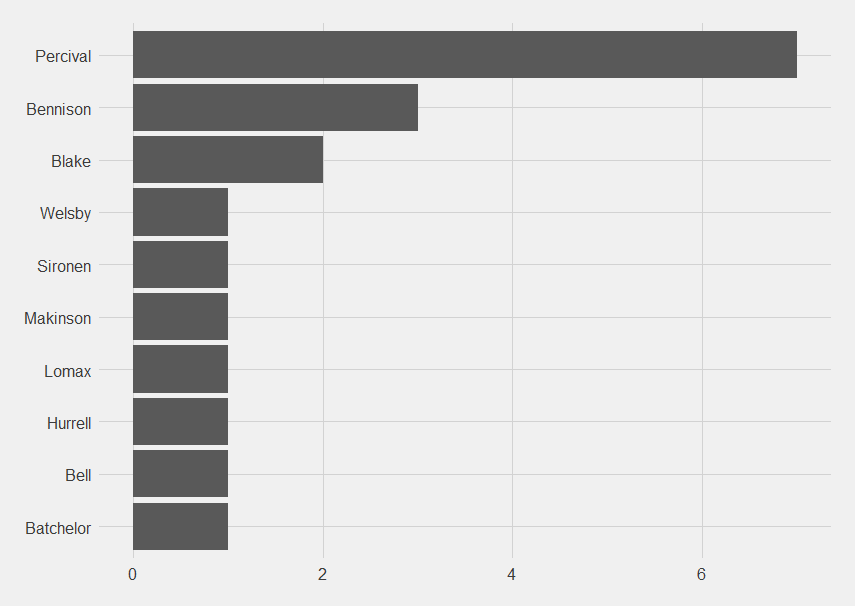
While it's nice to see consistent storing at minutes 51, 52, 60 and 70, I am also very happy with the cluster between minutes 34-40 where Saints have already had two point-scoring moments.Same graph but coloured in by scorer - 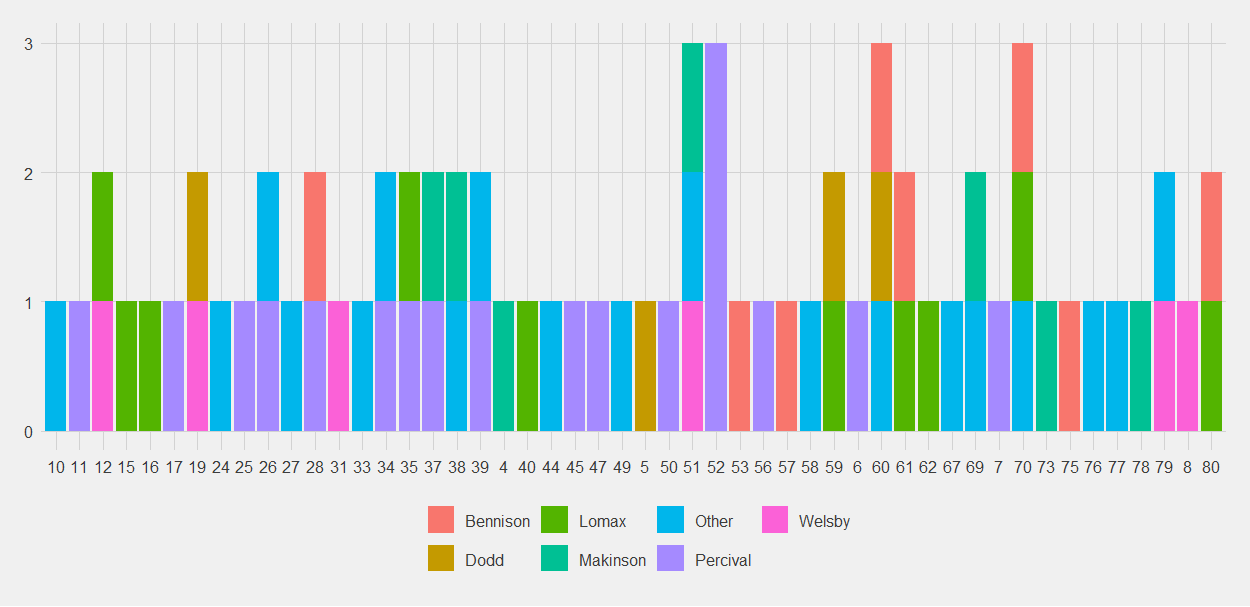 That's Purple for Percival, dominating the graph even if he does only play 50 out of 80 minutes.
That's Purple for Percival, dominating the graph even if he does only play 50 out of 80 minutes.
Welsby, Lomax and Whitley are still the darkest purple because they're still together most often.
No comments:
Post a Comment