I have a better excuse than usual for not posting these, because I was flying off to the US when the racers were flying up the Champs-Élysées, and then I got distracted by the Women's World Cup (https://fulltimesportsfan.wordpress.com/2023/08/03/womens-world-cup-2023-last-16-network-diagrams/) when I got back.
It's a particular shame because I had finished writing up my notes, and just needed the last day of racing to finish off the diagrams.
The last week of the race featured Pogacar cracking, which somewhat overshadowed an Austrian winning the queen stage!!!!! (https://www.bbc.co.uk/sport/cycling/66248827)
It also featured poor Simon Geschke having to literally race the broom wagon on stage 17 (https://twitter.com/GcnRacing/status/1681730004223180812). Although he won, and bless the broom wagon driver for cheering him on, he had to withdraw in the middle of stage 18. (Yes, in the Tour de France, the elimination line is not something high tech and digital, it's a man in a van, and I'm sorry this is part of why I love cycling.)
When did teams lose riders?
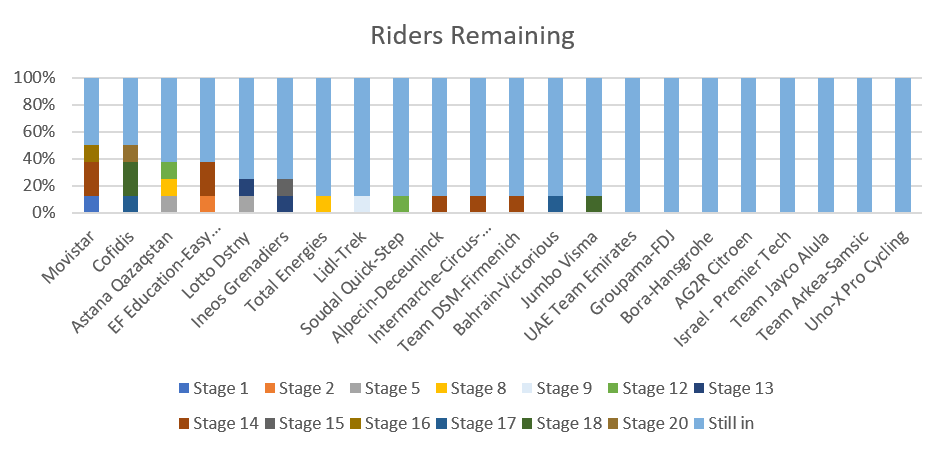 Cofidis and Movistar both lost half of their riders, while UAE, FDJ, Bora-Hansgrohe, AG2R, Israel Premier Tech, Jayco, Arkea and Uno-X didn't lose a single rider.
 Cofidis and Movistar both lost half of their riders, while UAE, FDJ, Bora-Hansgrohe, AG2R, Israel Premier Tech, Jayco, Arkea and Uno-X didn't lose a single rider.
 You can actually see stage 14 happening to EF Education and stages 16 and 17 happening to Cofidis in the Kaplan Meier diagram broken down by teams.
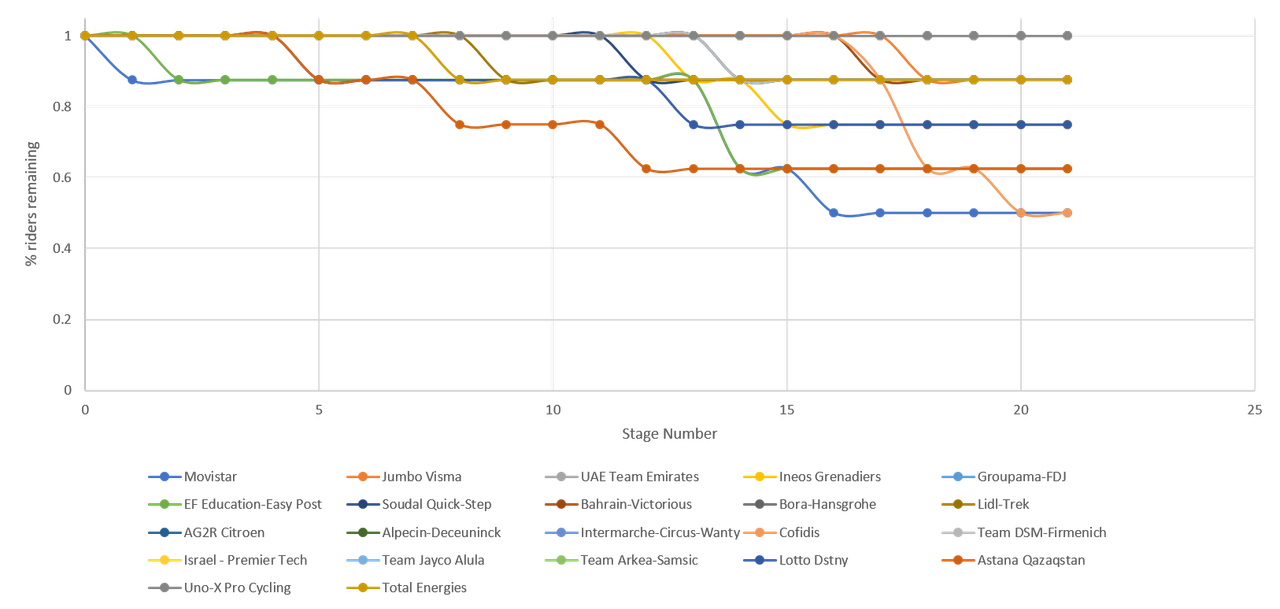 EF's green unfortunately covers up the same thing happening to Movistar.
 EF's green unfortunately covers up the same thing happening to Movistar.
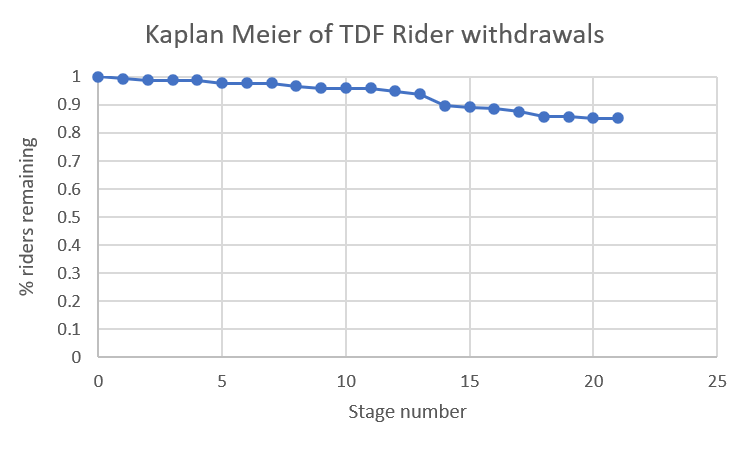
 The overall Kaplan Meier diagram of withdrawals looked like this:
 Comparing the withdrawals to the 2020, 2021 and 2022 Tours de France, it looks like this:
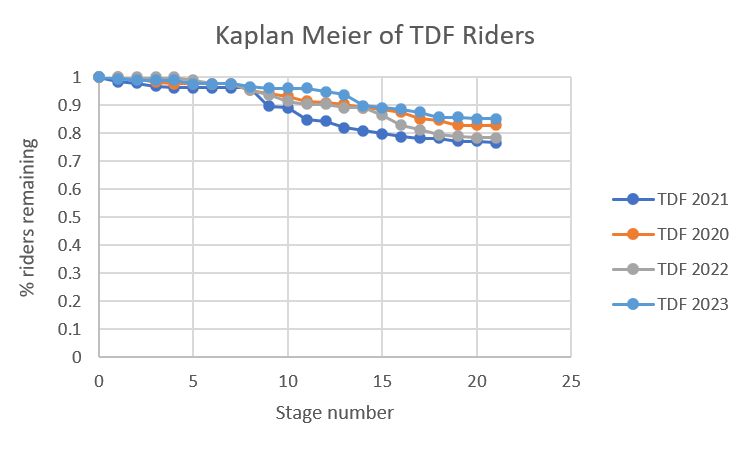 2021 and 2022 have very similar shapes, while 2023 looks more like 2020.
 Comparing the withdrawals to the 2020, 2021 and 2022 Tours de France, it looks like this:
 2021 and 2022 have very similar shapes, while 2023 looks more like 2020.
 I briefly had access to PRISM, so I ran the data through that too.
PRISM version: That figure made me feel good because my home-brew version looks very similar to it, so I don't think I'm going too wrong with my methodology.
 That figure made me feel good because my home-brew version looks very similar to it, so I don't think I'm going too wrong with my methodology.
 The main reason I wanted to run it through PRISM is because it provides statistical analysis of Kaplan Meier diagrams. By eye (https://fulltimesportsfan.wordpress.com/2022/05/18/for-guts-or-for-glory-was-the-2021-tour-de-france-attrition-rate-influenced-by-the-upcoming-olympics/) it already looked like the Olympics in 2021 didn't have an effect on the withdrawal rate and PRISM confirmed that view by saying there was no statistical difference in the withdrawals in the different years.
Withdrawals by stage:
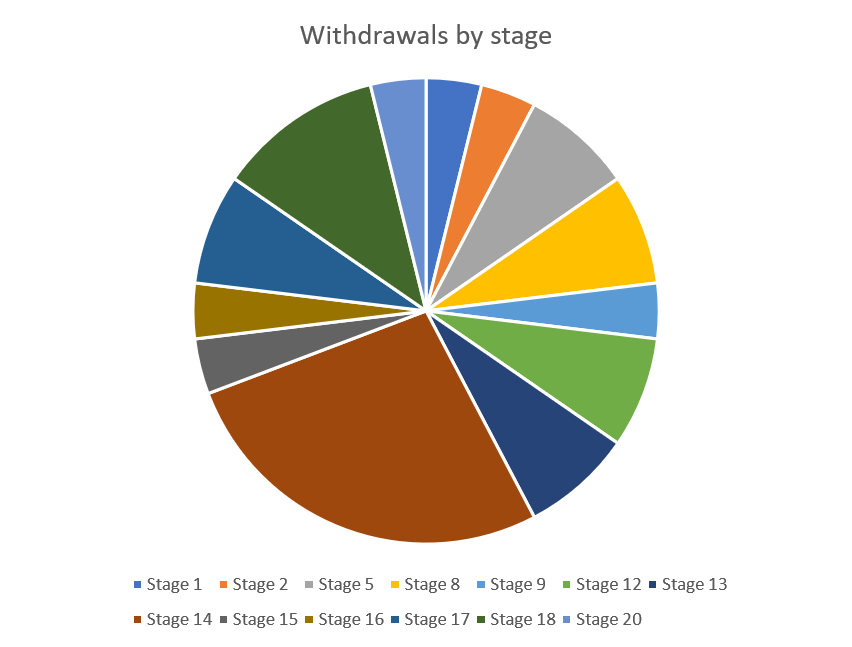
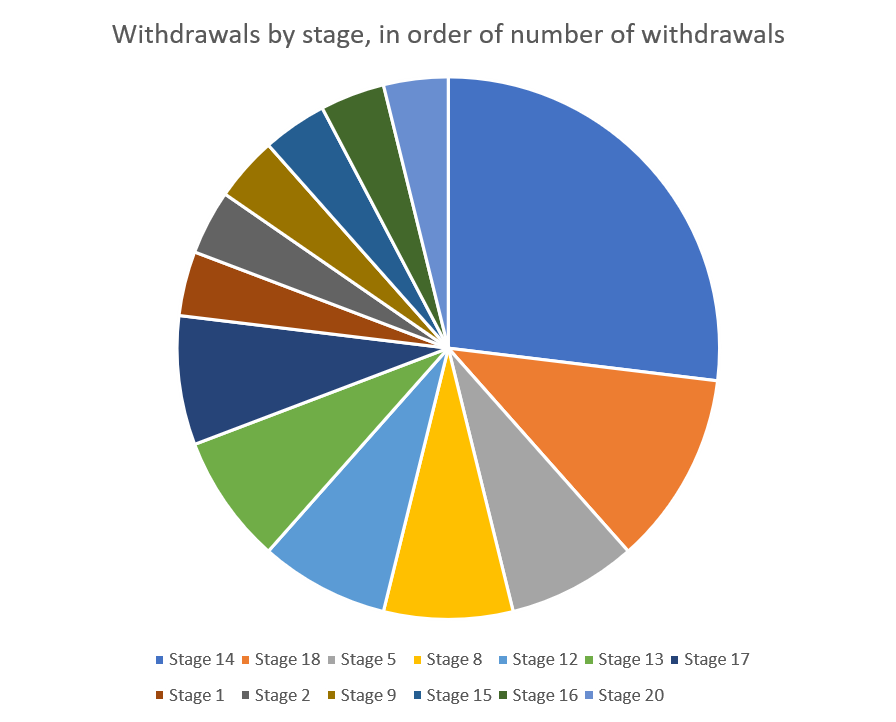 Stage 14 was the stage with the most withdrawals by a long way. To refresh your memory, it was a combination of a slippy road, a turn and ill-fortune that took down a swath of riders (https://www.eurosport.co.uk/cycling/tour-de-france/2023/tour-de-france-neutralised-after-extraordinarily-nasty-moment-on-stage-14-involving-almost-all-teams_vid1951457/video.shtml)

 Stage 14 was the stage with the most withdrawals by a long way. To refresh your memory, it was a combination of a slippy road, a turn and ill-fortune that took down a swath of riders (https://www.eurosport.co.uk/cycling/tour-de-france/2023/tour-de-france-neutralised-after-extraordinarily-nasty-moment-on-stage-14-involving-almost-all-teams_vid1951457/video.shtml)
 I don't know if this is because there isn't as big a difference between the top riders and those at the bottom, that the stages were shorter so it reduces the risk, or whether people were seeing sense after accidents and withdrawing there and then, but it's an interesting fact.
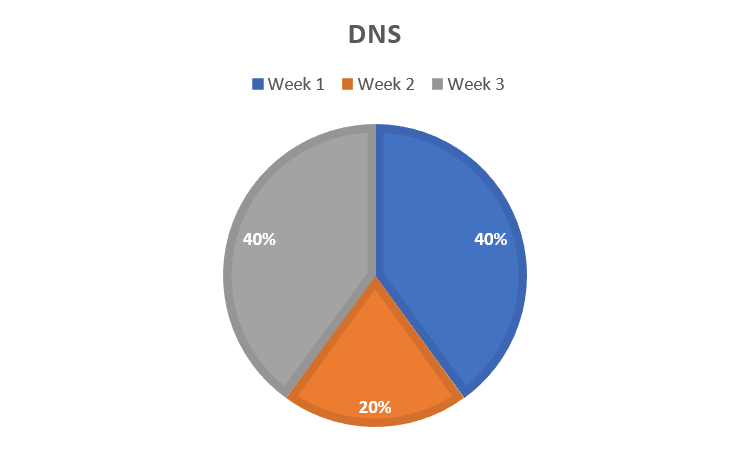
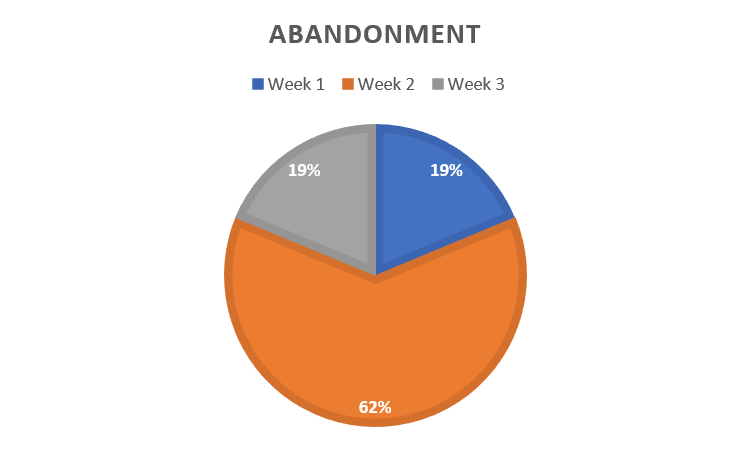
Looking at the abandonments in more detail:
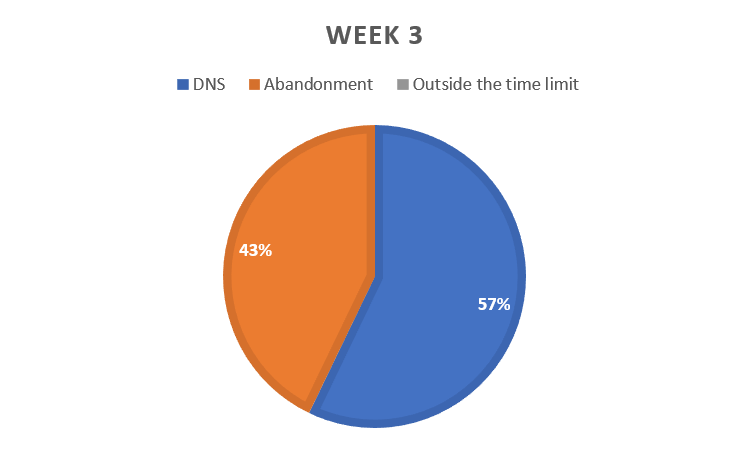
Week 2 was the worst for withdrawals with almost half of all withdrawals occurring then, with week 1 and 3 being as bad as each other:
 This is because of mid-stage abandonments, because relatively few of the DNS withdrawals were in week 2.
 Things I will look out for next year?
Whether this "no outside the time limit withdrawals" pattern happens again next year, and whether the curve shape is the same again, next year being another Olympic year.
 This is because of mid-stage abandonments, because relatively few of the DNS withdrawals were in week 2.

 Things I will look out for next year?
Whether this "no outside the time limit withdrawals" pattern happens again next year, and whether the curve shape is the same again, next year being another Olympic year.
 Related posts to look forward to this year (or at the start of next year) - the equivalent post for the women's Tour de France 2023.

No comments:
Post a Comment