One major thing, for the purposes of this update post, did happen since the 2022-2023 version of this post. Harry Kane moved to Bayern Munich.
This was probably a very good thing for him (something is definitely rotten in the state of Tottenham Hotspur).
And I've previously included stats from non-Premier League football for Salah, so it's definitely doable method-wise.
It does mean that it will no longer be as direct a comparison, but I think that's okay.
On to the graphs:
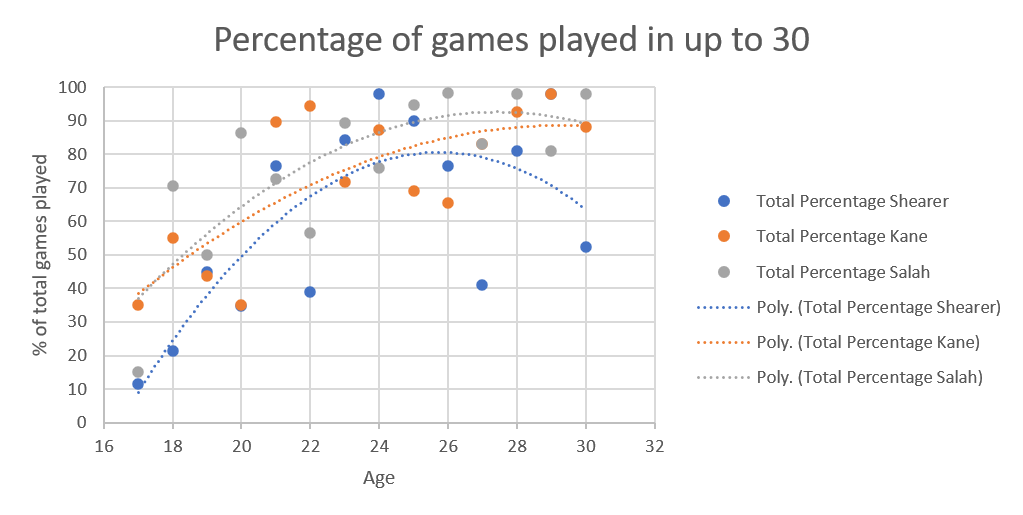
First, we have percentage of games played, up to the point of being 30 for all three players. This comes first because the original question L posed was whether Kane's putatively dodgy ankle would allow him to catch Shearer's Premier League goal tally.
Looking at up to age 30, Shearer's curve has a serious down curve here, because 30 was when he had his second big injury (carrying that Newcastle team).
Although Salah and Kane's curves have different shapes, they are now converging on the same point in terms of percentage of games they played at 30. Whether this is changes in how coaches use players, resting them more often now to allow more games overall, I don't know.
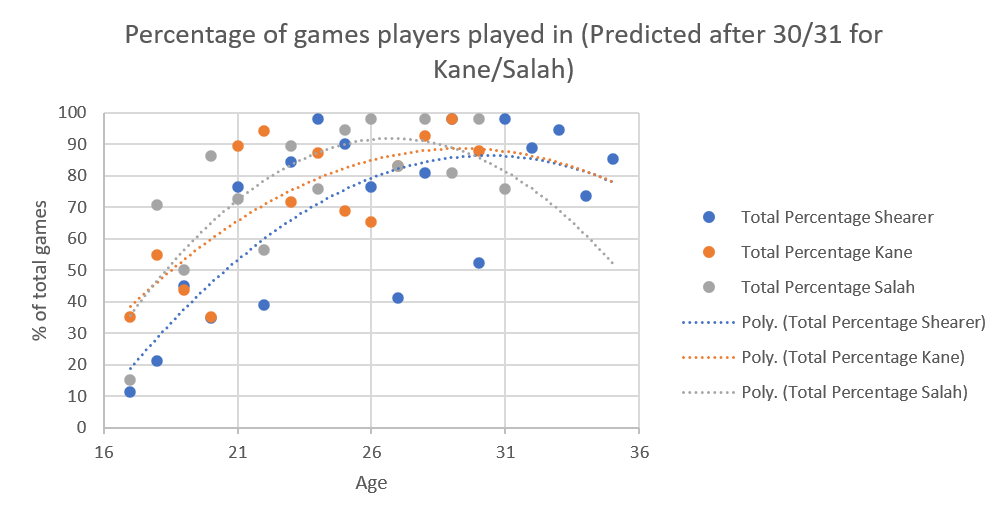
Using the "extrapolated till age 35" data, the curves look like this:


Now Goals per game
Using the data up to everyone reaching 30
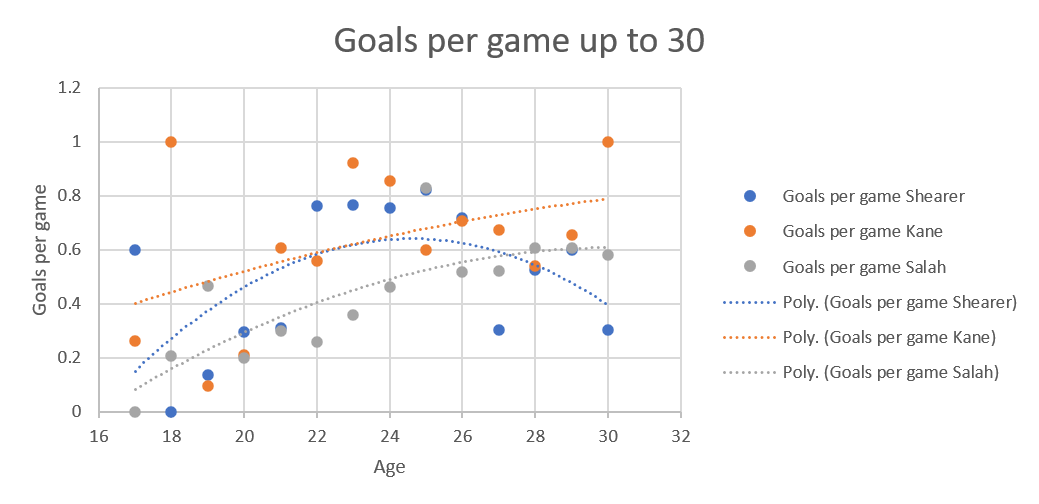
Again, Shearer is the odd one out because of his injury, although to me, the interesting thing is how similar the shape of the curves are for Kane and Salah. The curve also makes it clear that, although Salah is indeed a very awesome striker, Kane is the one who is more of an out and out goal getter. Plus, the entirely ridiculous stat that Kane had a goal per game in 2023-2024.

Using the extrapolated data, Kane stands out:
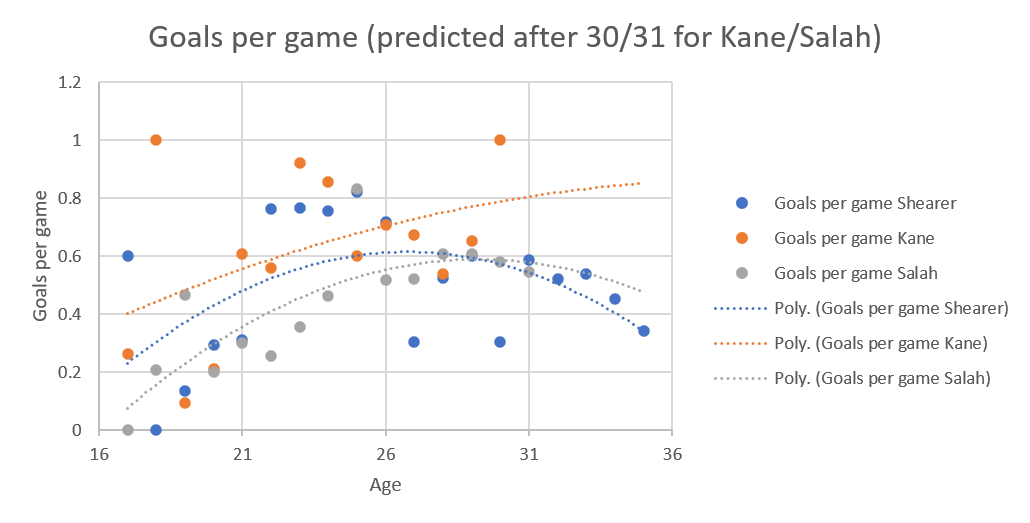
Kane's curve ends much higher than the other two, possible because of that ridiculous 2023-2024 season, with Salah's curve going down because of his injury in 2023-2024.

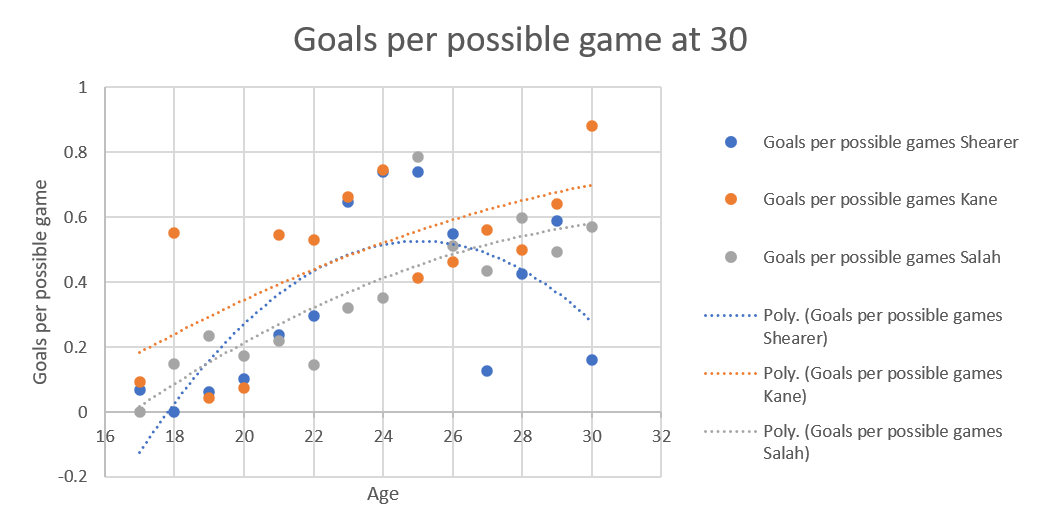
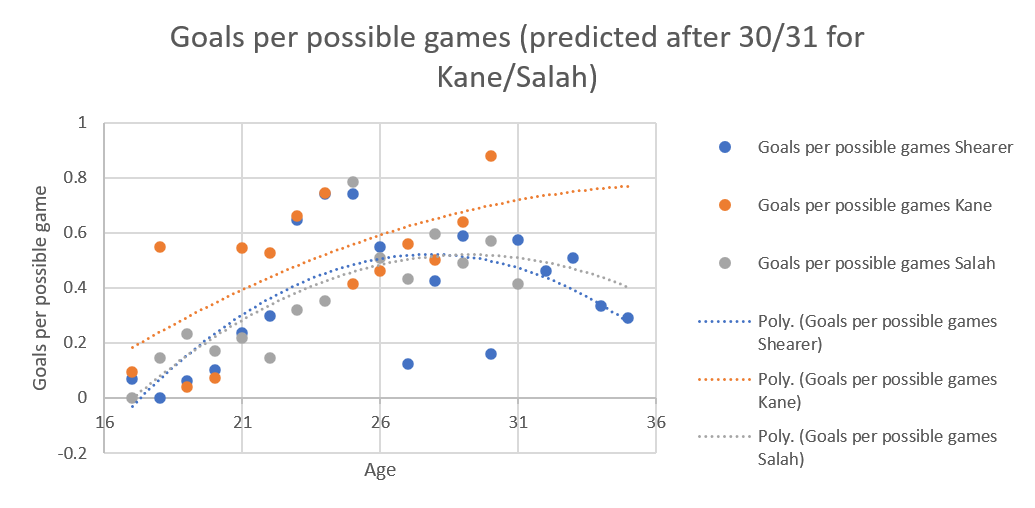
Finally, we have the goals per possible game, which would normally perk Shearer's stats up because he had fewer opportunities to have games to score goals in, but, as I said, his injury in the year he was 30 meant his curve really does parabola downwards in this graph.

No comments:
Post a Comment