In Haaland or Bug, I did say it would be interesting to see what an extra year's data would do to Haaland's curves.
And it has done interesting things.
Part of the problem is his 2023-2024 season would have been spectacular for anyone else, but was only "on standard" for him, so where his curves have been sky-rocketing previously, they've now plateaued, and on the 'extrapolated' curves, that means they're some interesting downward parabola shapes.
First the Percentage of Games Played
At the point where everyone had reached 23 years old:
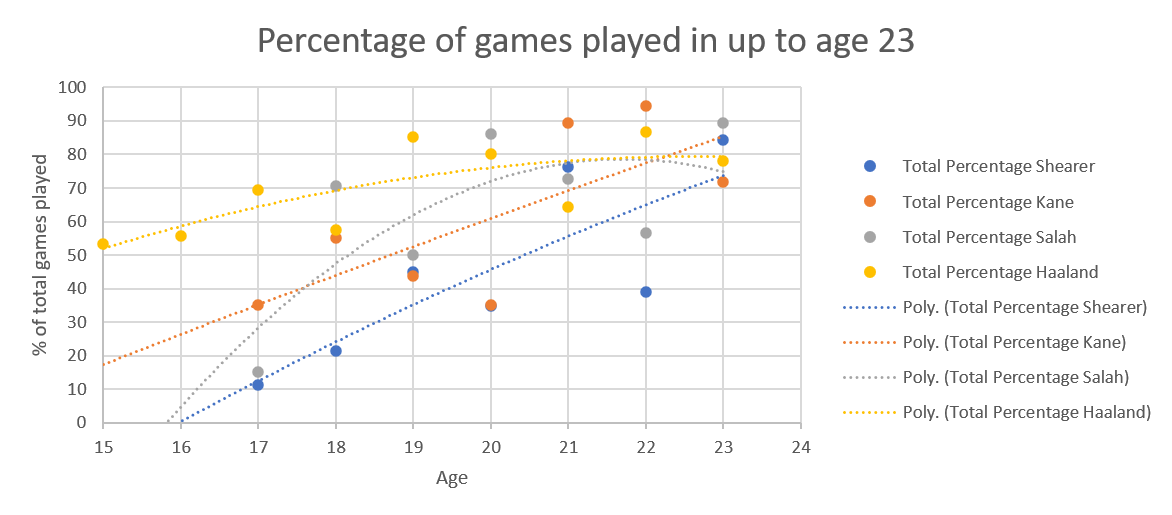
Haaland's curve is now plateauing, but that's because he has played a high percentage of games for several years, which always leads to concerns (Link to "Much Too Much, Much Too Young" by the Specials
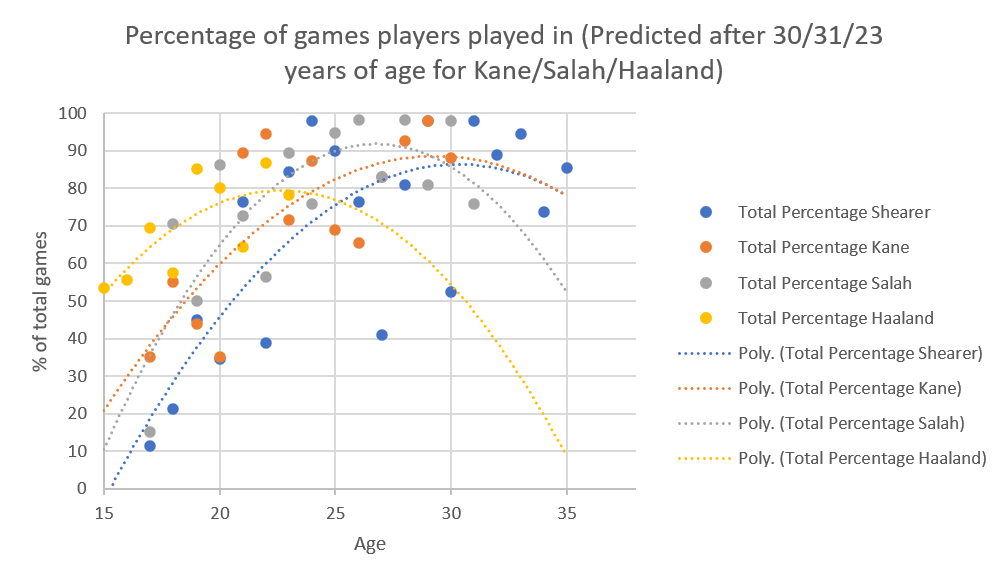
In the "extrapolated" curves, all the players have downward turning parabolas. Haaland's is the worst because of the limited data, but Salah's has also gone down because of his 2023-2024 injuries (may he be kept from further hamstring problems).
And Kane and Shearer are now meeting at the same point.
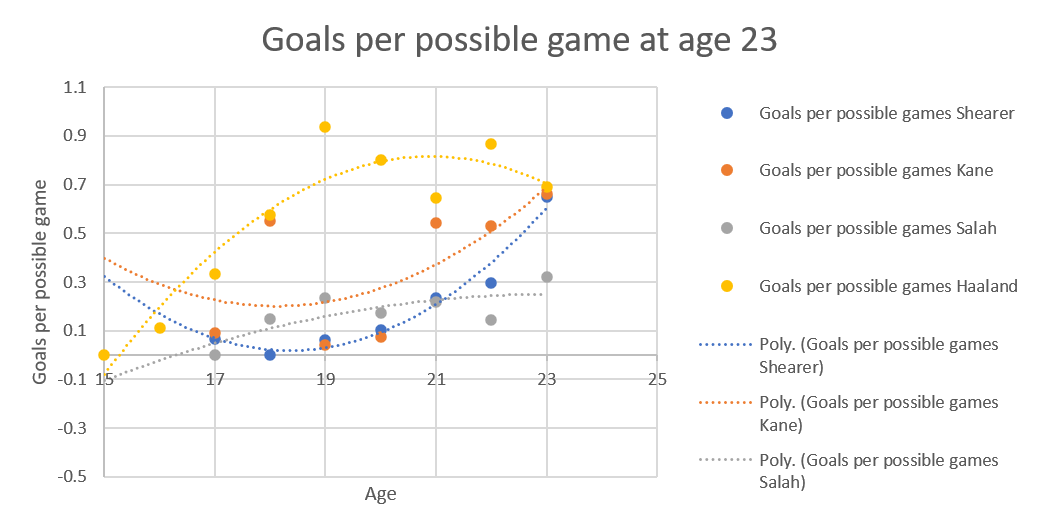
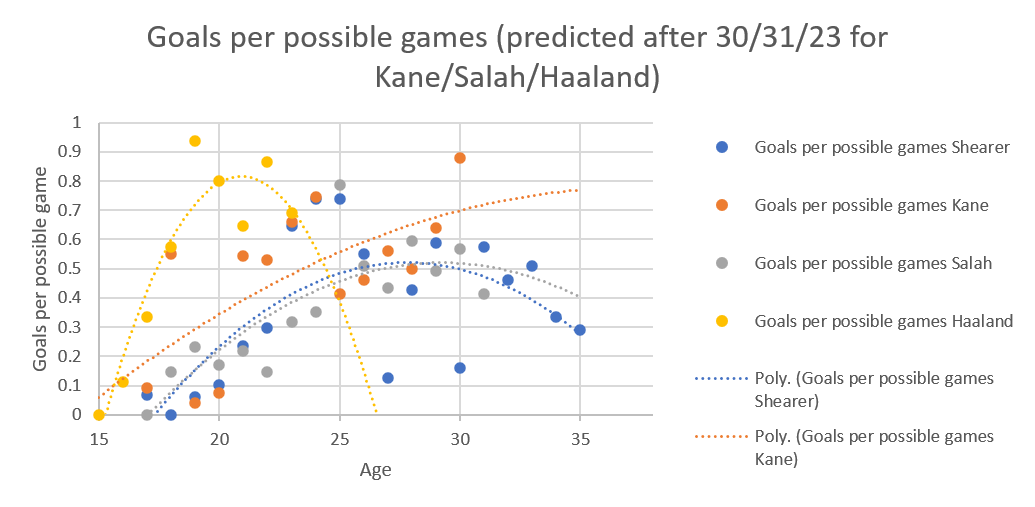
 Next we have goals per game
It is still weird curves ahoy, because Kane and Shearer's are still upward-facing banana-shaped.
Next we have goals per game
It is still weird curves ahoy, because Kane and Shearer's are still upward-facing banana-shaped.
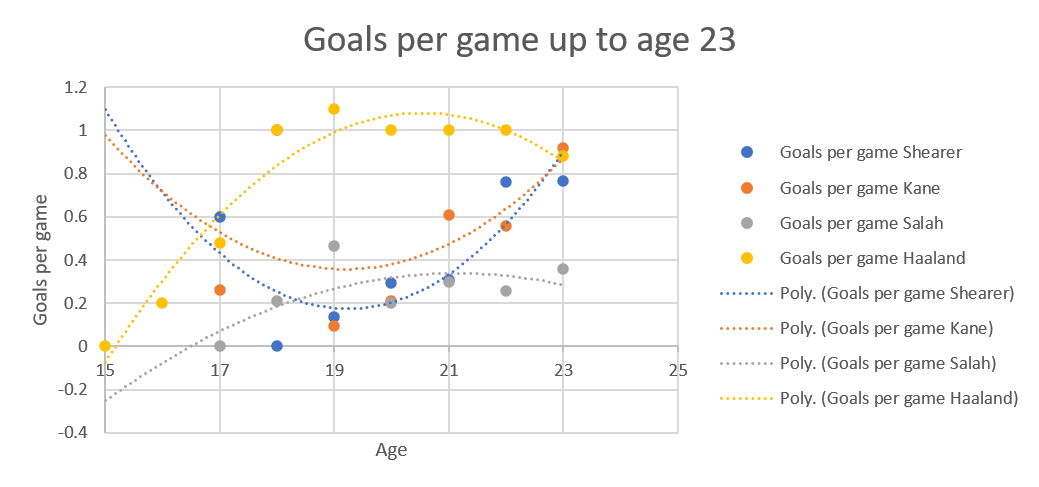 Haaland's downward facing parabola really is just due to other seasons being ridiculous and this one just being very good. I also find it amusing that three of the lines - Shearer's, Kane's and Haaland's - meet at more or less the same point. I think it's because they've always been out and out strikers, while Salah used to be a winger.
Next we have goals per game
It is still weird curves ahoy, because Kane and Shearer's are still upward-facing banana-shaped.
Haaland's downward facing parabola really is just due to other seasons being ridiculous and this one just being very good. I also find it amusing that three of the lines - Shearer's, Kane's and Haaland's - meet at more or less the same point. I think it's because they've always been out and out strikers, while Salah used to be a winger. 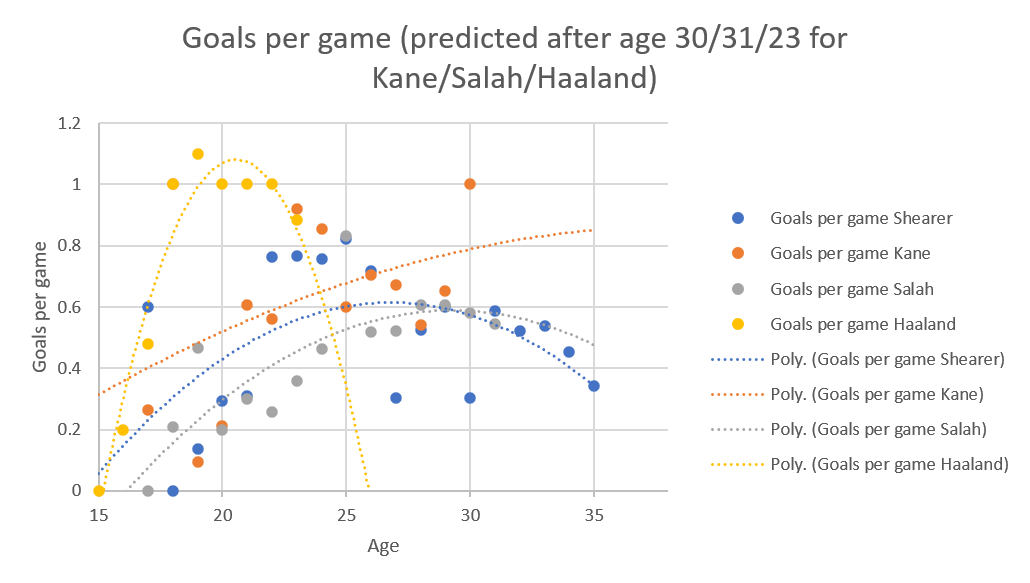
 Manchester City, and therefore Haaland's relatively poor 2024-2025 is going to do things to my graphs again next time, isn't it?
No comments:
Post a Comment