Saturday, 23 November 2024

Saints Ahoy! - Game 15 and the season to date

In game 15, Saints beat Catalan Dragons, and there was the expected yellow card. https://www.saintsrlfc.com/2024/05/31/saints-down-the-dragons-at-the-totally-wicked-stadium/ Because there always is at least one card. 

I'm not sure why Saints vs Dragons always ends up violent (I have theories, they're all rude and start with calling them Wigan Sud) but they always do. This time it was one of theirs that got the yellow card, although Saints were already leading by then. 

The other big news was that this was the return of Agnatius Paasi to the team. And we like having him, for he is large and good. Saints were very careful with him, only giving him 20 minutes. 

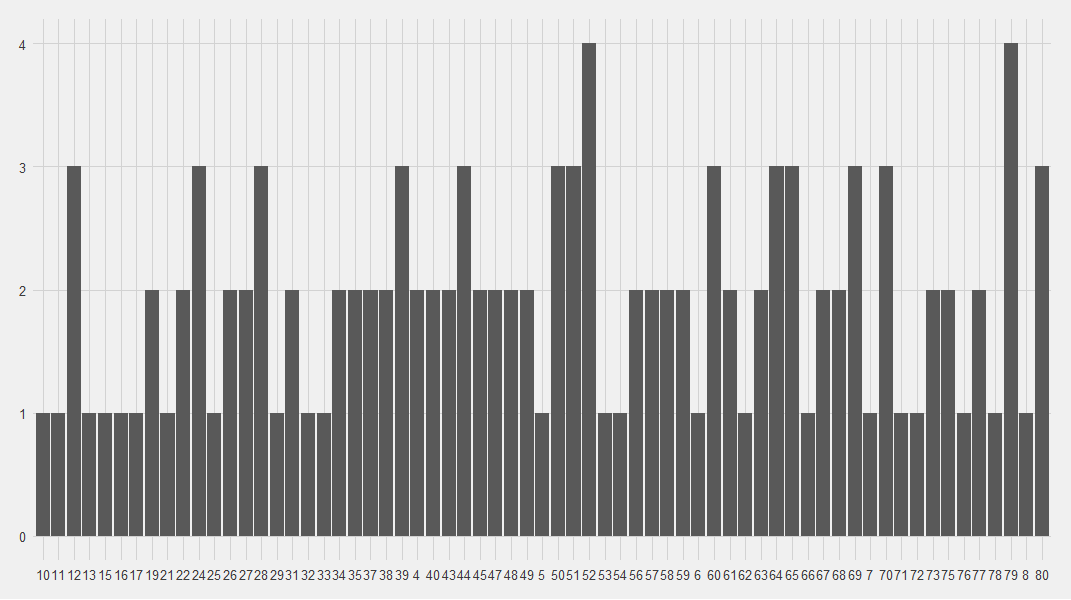
After game 15, there is still no pattern to when Saints score: Bar chart showing when Saints score.  Although there are peaks in some places e.g. minute 34-49, it does not make a strong pattern.  The when Saints concede figure later on has a much clearer pattern. 

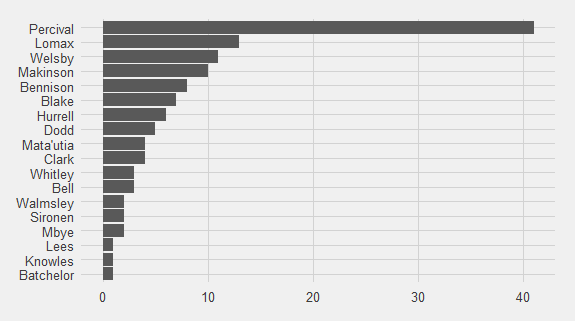
Percival still leads the point-scorers, as he should as the kicker (also 4/4 tries converted in game 15) Who scores for Saints up to game 15.  Percival is in the lead with 41, followed by Lomax, Welsby and Makinson.  In total, 18 players have scored for Saints. 
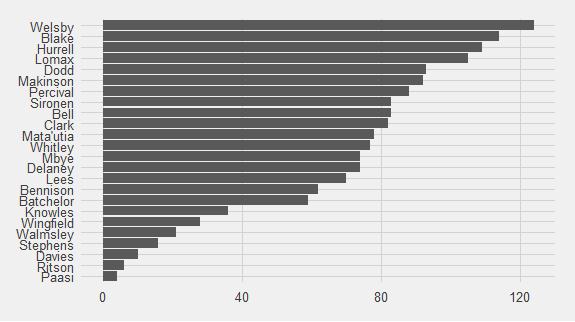
Welsby is still ever-present when Saints score. Bar chart of who is present when Saints score.  Welsby is ever-present for all 123, followed by Blake and Hurrell.  Paasi, Ritson and Davies have been present for the least, but two of those have been injured. 

The thing that intrigues me about this chart is that you have a clear group at the top who are very frequently present (Welsby, Blake, Hurrell, Lomax), then a drop to the group that are often together who have very similar numbers (between 70 and 90), then another few where it tails off before 'boof' big drop to the injured non-presents. 

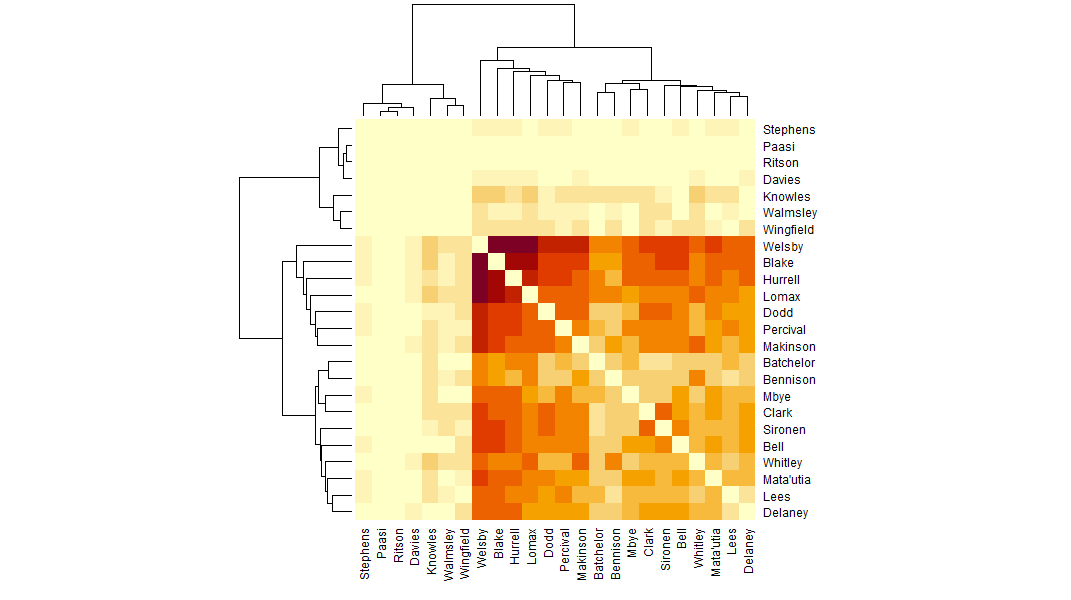
This is borne out by the matrix graph of players who play together when Saints score. For the darker section (play together more often when Saints score), we've not got a solid 17 players: Matrix diagram.  Darker colours means players play together more often when Saints score.  There is now a clear demarcation between the plays who do not play together often when Saints score, and the ones that do.  The darker section is now 17 players wide, which is the same as the number in a matchday squad. 

The 17 are, in figure not necessarily positional order, Welsby, Blake, Hurrell, Lomax, Dodd, Percival, Makinson, Batchelor, Bennison, Mbye, Clark, Sironen, Bell, Whitley, Mata'utia, Lees and Delaney. I will return to their being 17 players in the "frequently together" section when we get to the "matrix diagram for when Saints concede". 

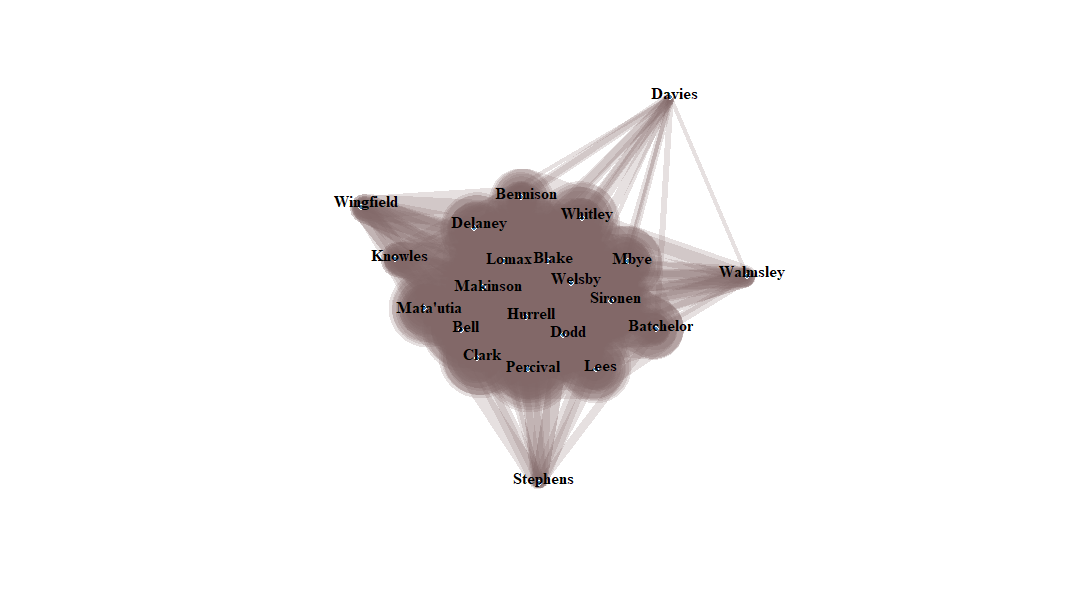
The network graph is unclear. Network graph.  All of the other players are together in the big giant grey blob in the middle, with clockwise from 1, Davies, Walmsley at sort of 3, Stephens at 6, and Wingfield at 10 sticking out.  Knowles is starting to move out to where Wingfield is. 
It looks like Knowles is creeping out of the main section as his injury break gets longer. 

Although there have been 15 games, there are only 13 teams on the "Who has scored against Saints?" bar chart because 2 teams were nil-ed. 

If we look at when Saints concede, the pattern previously identified (https://fulltimesportsfan.wordpress.com/2024/11/16/saints-ahoy-game-14-and-the-season-to-date/), of Saints conceding in minute 9-11 gets even stronger. Bar chart showing when Saints concede.  The highest bar is 5 point-conceding moments at minute 11, the next highest is 4 in minute 71. 
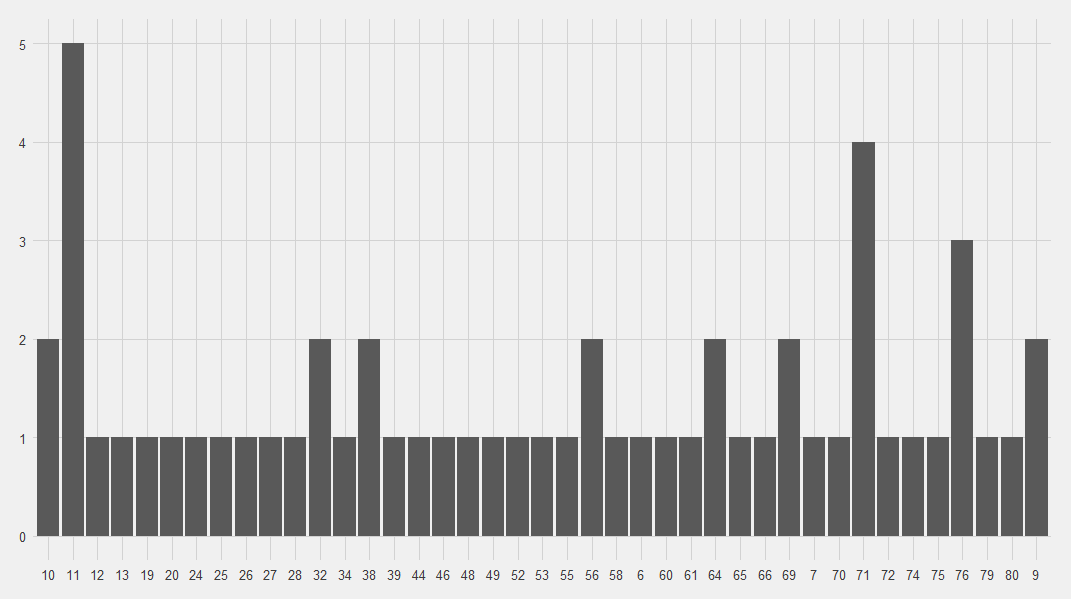
Of the 57 times Saints have conceded, 9 have come in minute 9-11, almost 16 percent, in those 3 minutes. It also looks like there might be a weakness in the last 10 minutes too, but that's probably exhaustion and everyone conceding more then. 

L has asked me to come up with a "why then?" theory. Best I have is it tiredness when it's the opponent's third set and that might mean more likely to concede 6-agains which might lead to scores. But I have no data to back this up. (NRL.com style data, my kingdom for NRL.com style data) 
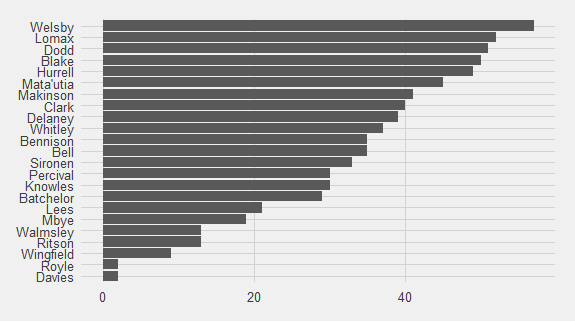
Welsby is also ever present when Saints concede. Bar chart showing who is present when Saints concede. 
 Welsby is present for all, followed by Lomax and Dodd.  Wingfield, Royle and Davies, who have been injured or are young players being slowly introduced, are present for the least.  Royle might also have been injured as well as young. 

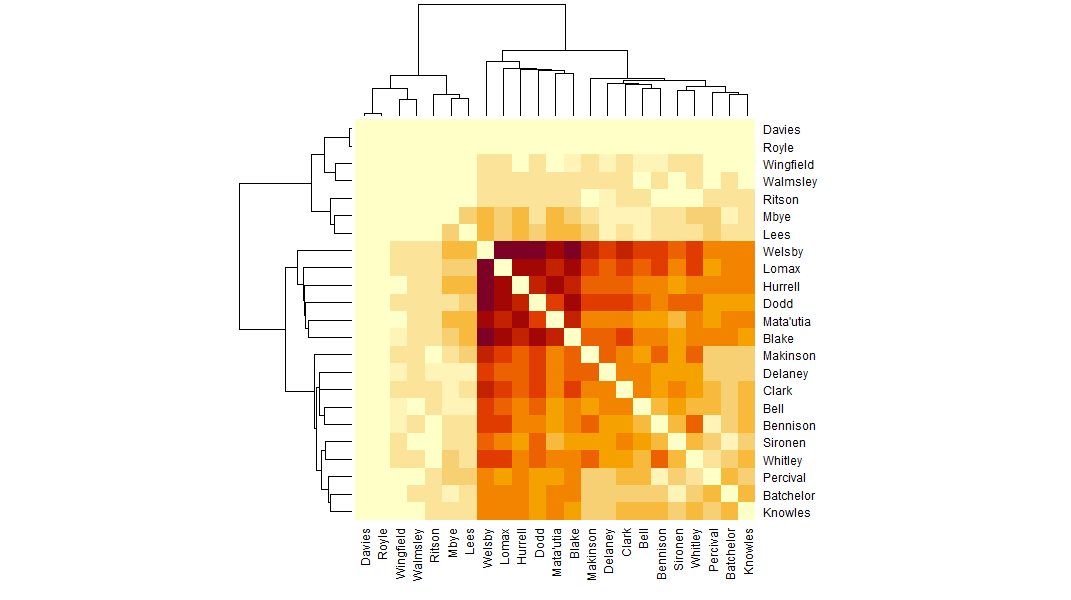
Next we have the matrix graph of players who play together more often when Saints concede. Matrix graph of players together frequently when Saints concede.  The paler, less often together players are in the top left third, while the others fill out the bottom right. This time, the darker group of players who play together more often is only 16 players. I think this is because often, when Saints concede, it is because someone has been carded and is either in the sin bin or off entirely. 

The 16 are (again in figure not position order), Welsby, Lomax, Hurrell, Dodd, Mata'utia, Blake, Makinson, Delaney, Clark, Bell, Bennison, Sironen, Whitley, Percival, Batchelor, Knowles. I think Lees not being in here is because of that. 
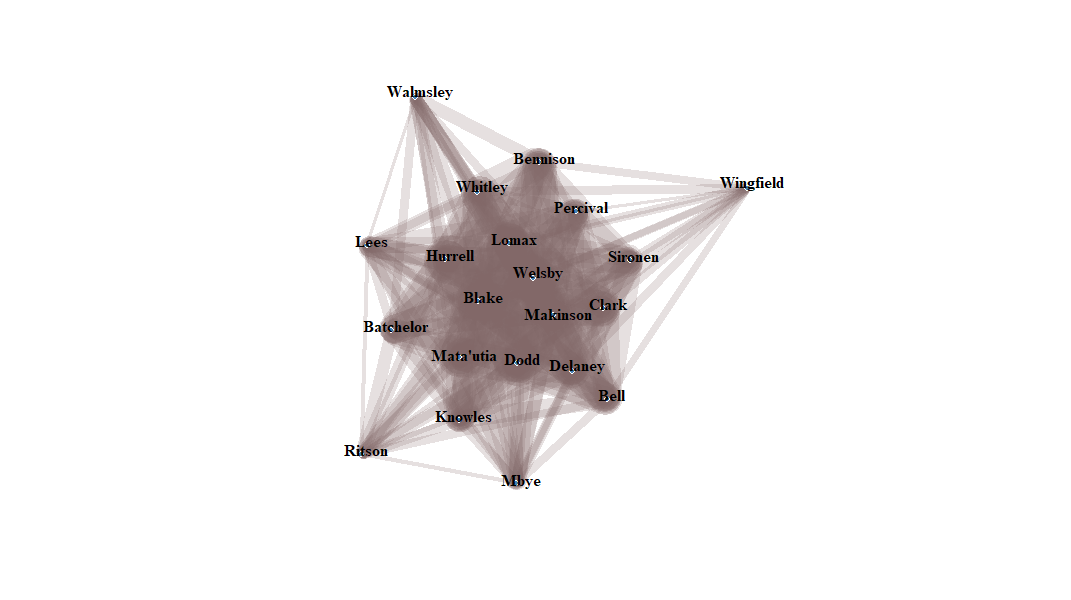
The network graph is also less clustered for the point-concessions, possibly because there are fewer of them. Network graph of who plays together when Saints concede.  The central grey blob is looser and a paler grey than point-scoring equivalent.  The players sticking out, at some very odd angles, are Wingfield at about 2 on the clock, Mbye at 6, Ritson at 7 and Walmsley at 11.  Because it is less tightly packed, players in the centre touch the lines the outliers make between themselves.

No comments:

Post a Comment