In the figures, the race is called the TDFF for Tour de France Feminine to save space.
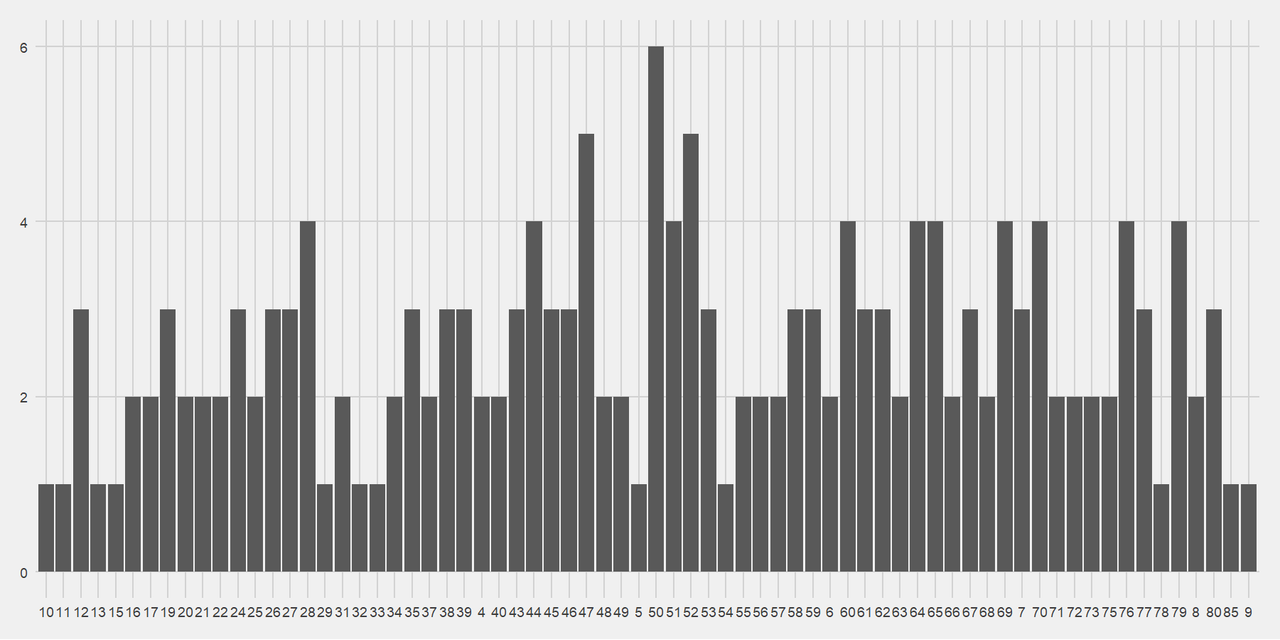
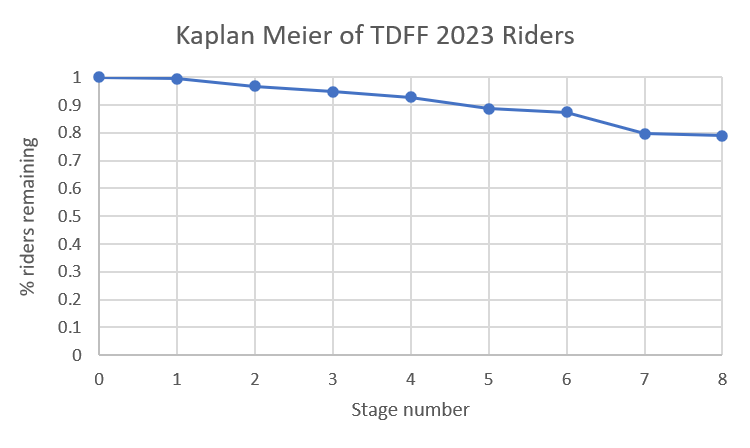
From the figures I usually make, the first thing that stood out was that you could see stage 7 happening to the peloton.
Stage 7 write up by Cycling News - https://www.cyclingnews.com/races/tour-de-france-femmes-2023/stage-7/results/
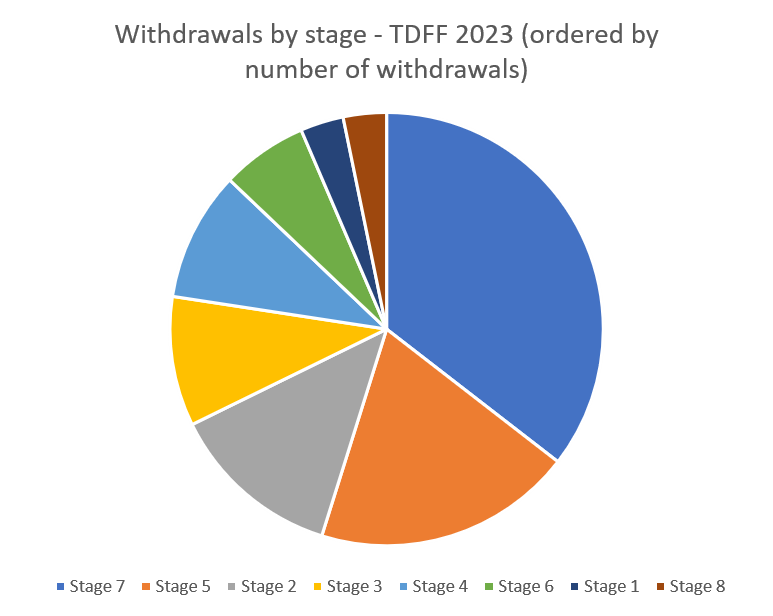
The Tourmalet effect is also seen in the pie chart of withdrawals by stage, with stage 7 (11 withdrawals) having more withdrawals than the next two stages with the most withdrawals combined (stage 5 = 6, stage 2 = 4).
There were no withdrawals due to being outside the time limit (OTL).
This is a very different pattern to what was seen in the women's Tour de France 2023.
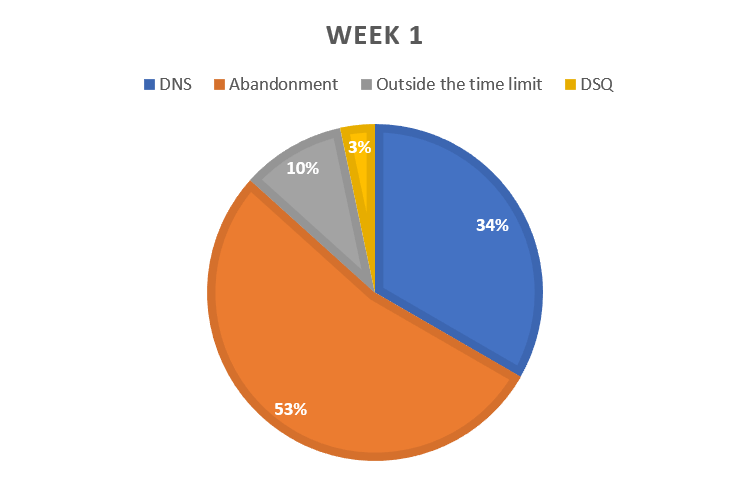
The percentage of did not starts is almost exactly the same (38% in the men's vs 34% in the women's), so the over the time limit withdrawals in the women's seem come from the pool that were mid-stage abandons in the men.
On the other hand, the 2023 men's Tour de France was unusual in not having any OTL withdrawals.
The one disqualification was Lotta Henttala, who was disqualified for holding onto her team car to get a tow. Interestingly, Demi Vollering, the eventual winner had 20 second added on to her time the day before for excessive drafting (following a team car to reduce wind drag) but I'm going to presume the commissaires's argument is drafting is different from holding.
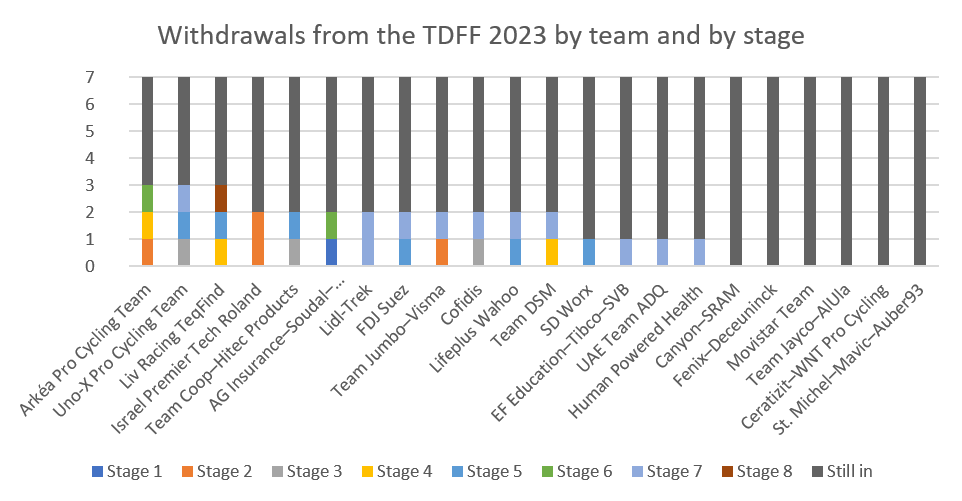
You can see the stages, particularly stage 7, happening to the teams in the bar chart of when teams lost riders.
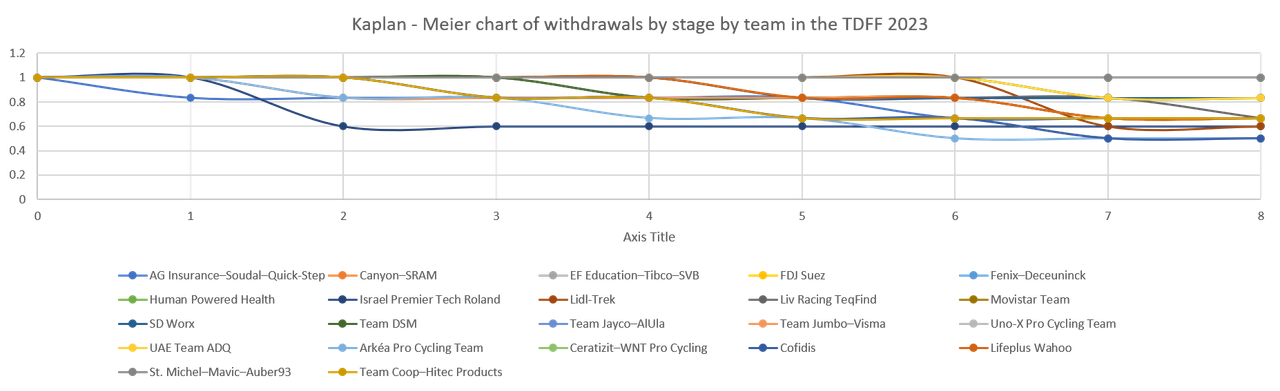
Due to the number of teams, the Kaplan Meier chart divided by team is a mess.