Wednesday, 30 July 2025

Withdrawals from the 2025 Tour de France

Sadly, this year, I haven't been able to watch any of the Tour. 

However, I did find the time to do the withdrawal stats. 

Looking at the Kaplan Meier chart: Kaplan Meier chart of withdrawals in the 2025 Tour de France.  The line of withdrawals in blue is a very shallow slope, with a drop from 1 to 0.9 over 15 stages.  It then drops to 0.875 by stage 20 and stays there till the end at stage 21. While I was compiling the chart, I did start to wonder whether this was an exceptionally kind year in terms of attrition (if you're not Jasper Philipsen or Filippo Ganna). I will try and borrow a copy of Prism to get the numbers but the comparison itself makes it clear that there was less attrition than normal but not by much. The Kaplan Meier line for the 2025 Tour de France compared to previous races going back to 2020.  2025 (dark blue line) is the one with the fewest withdrawals, finishing with 0.875 still in (87.5%), 2023 (light blue) is the next highest at about 0.85, then 2020 (orange) at about 0.83, then 2024 (green) at 0.80, 2022 (grey) at about 0.78 then 2021 (mid blue) is the lowest at 0.76 

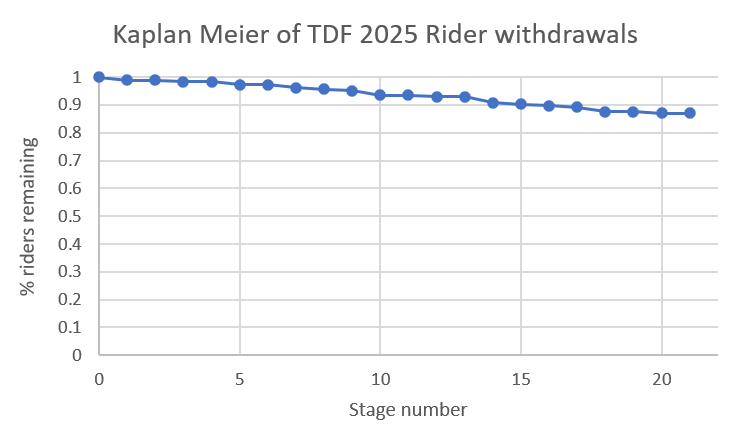
I don't know whether that's because the first "week" this year was 10 days long, because the 14th of July fell on a Monday (very necessary Casablanca clip here - https://youtu.be/HM-E2H1ChJM?si=Sadu7MugvhdwDhXC). Withdrawals by team, the teams are ranked from left to right by how many riders withdrew.  The team with the most withdrawn riders is at the left.  Fuller details in the text below. 

23 teams took part in the race. The withdrawals seem reasonably balanced. 

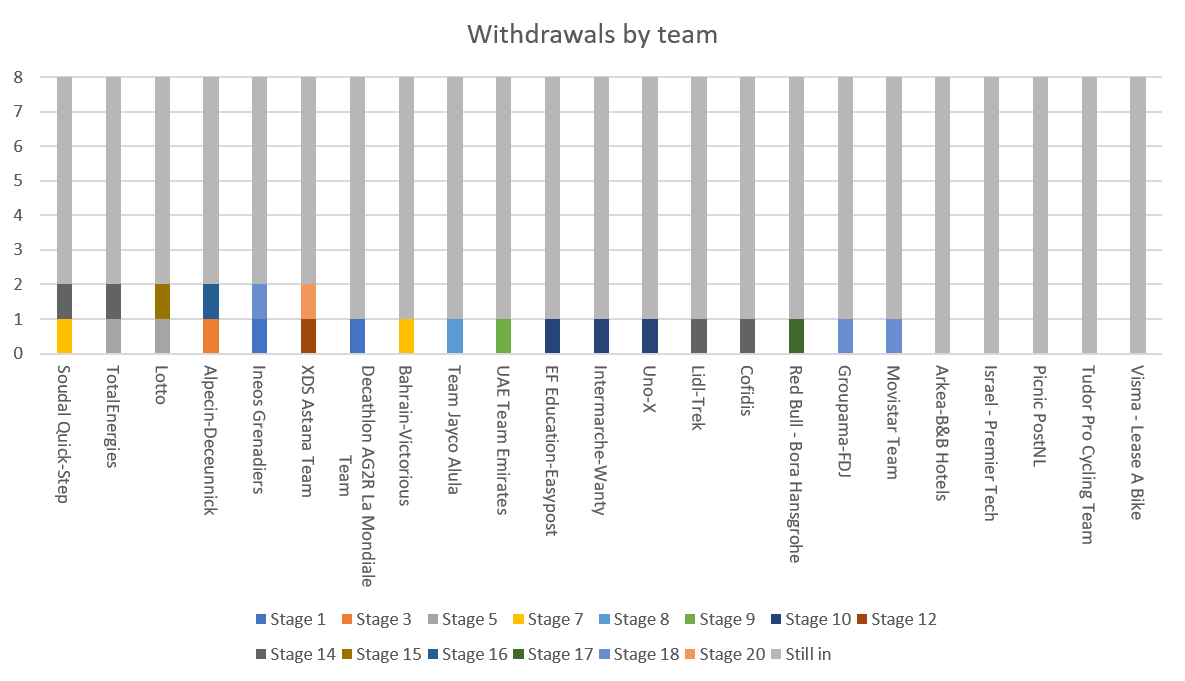
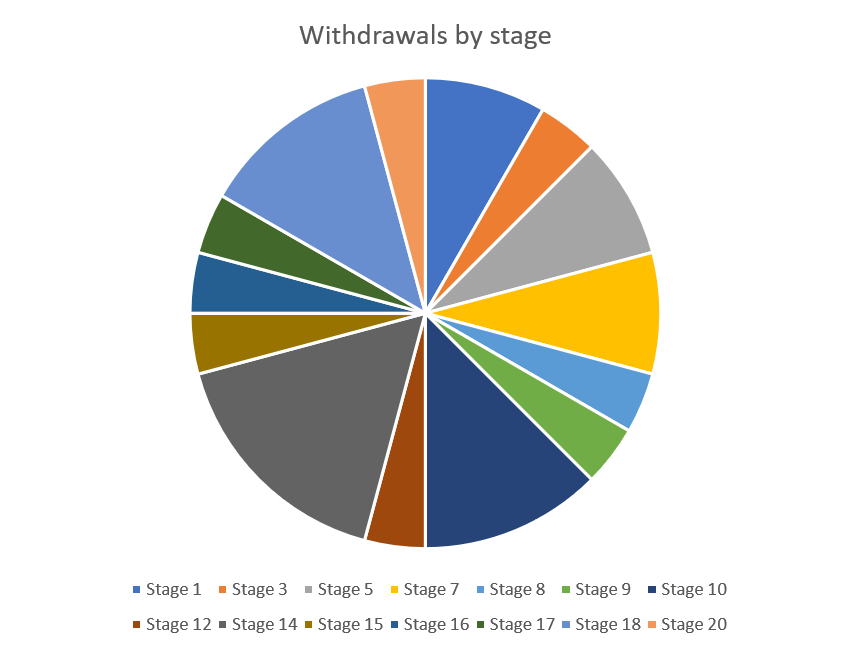
6 teams had 2 riders withdraw - Soudal QuickStep, Total Energies, Lotto, Alpecin-Deceunnick, Ineos Grenadiers and XDS Astana. 
5 teams had no one withdraw - Arkea - B&B Hotels, Israel Premier Tech, Picnic Post NL, Tudor and Visma - Lease A Bike. 

(I know it's because sponsorship is hard to find, but do the team names need to be that long). 

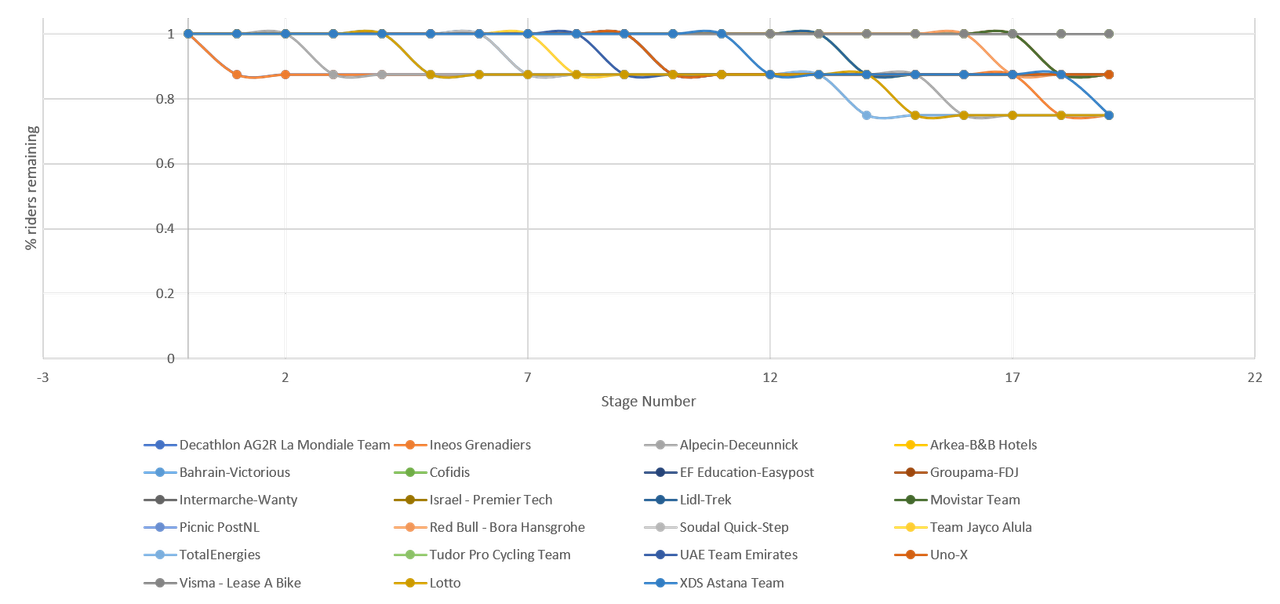
Because they withdrawals are evenly spread, in the Kaplan Meier diagram split by teams, there's no sudden drops. It looks very like a plait. Kaplan Meier chart divided by teams.  Because a team loses a rider every now and again, it looks like the lines for the different teams are forming a plait. 
Further evidence of it being an unusually non-attritional race, despite them having a stage with a sprint finish up the Ventoux - https://velo.outsideonline.com/road/road-racing/tour-de-france/highlights-tour-de-france-stage-16-2025, is that no one stage stands out as having more withdrawals. Pie chart of withdrawals by stage, ordered by stage number.  Although stage 14, dark grey, had the most withdrawals with 4, it does not stand out from the stages around it.  Normally one or two stages stand out as having had lots of withdrawals. Looking at withdrawals by type by week: Pie chart showing withdrawals by type in week 1.  67% were mid-stage abandonments (in orange), 33% were did not start the stage withdrawals (blue).  There were no over the time limit withdrawals. Pie chart showing withdrawals by type in week 2.  There is a 50/50 split in types of withdrawals.  50% are mid-stage abandonments (in orange), 50% were did not start the stage withdrawals (blue).  There were no over the time limit withdrawals. Pie chart showing withdrawals by type in week 3.  17% are mid-stage abandonments (in orange), 83% were did not start the stage withdrawals (blue).  There were no over the time limit withdrawals. Ignoring that week 1 was 10 days ... the really interesting things are: 
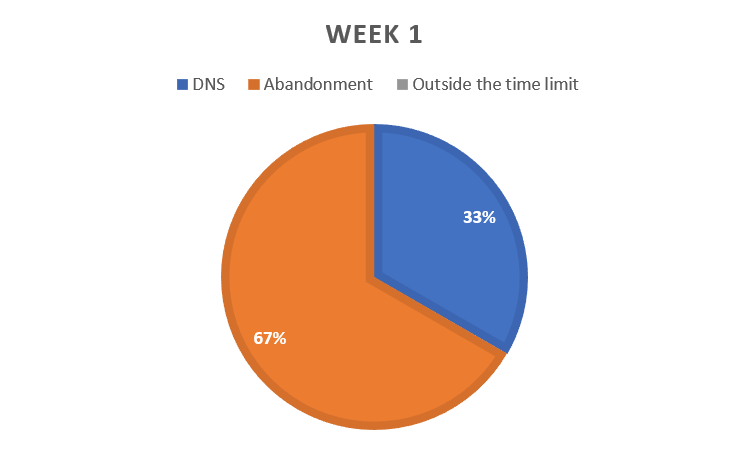
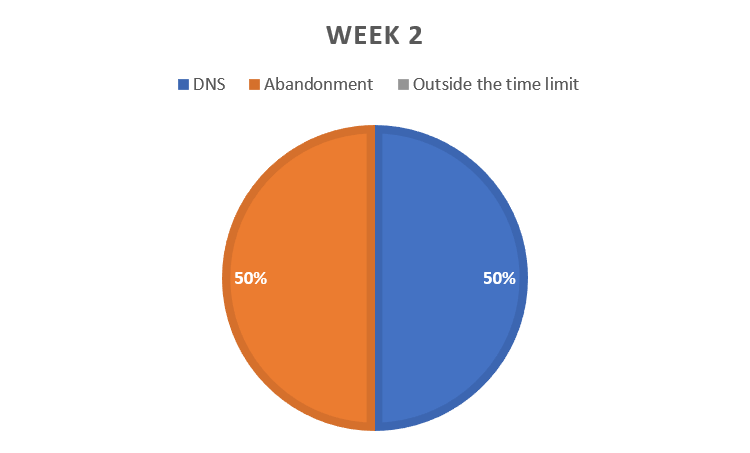
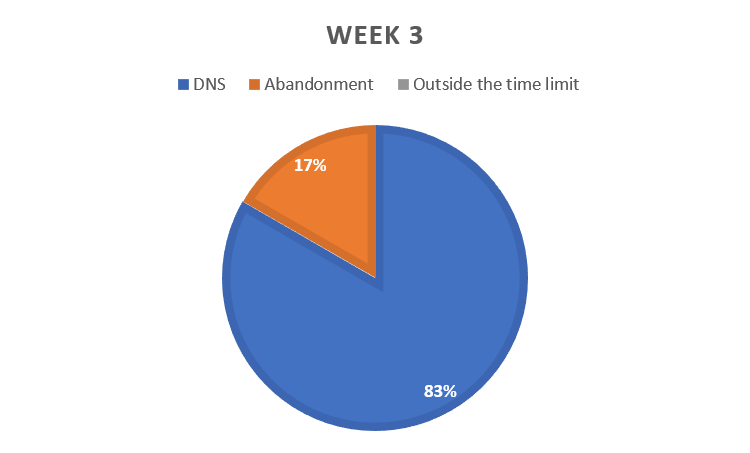
1 - No over the time limit withdrawals at all 
2 - The pattern is almost symmetrical 

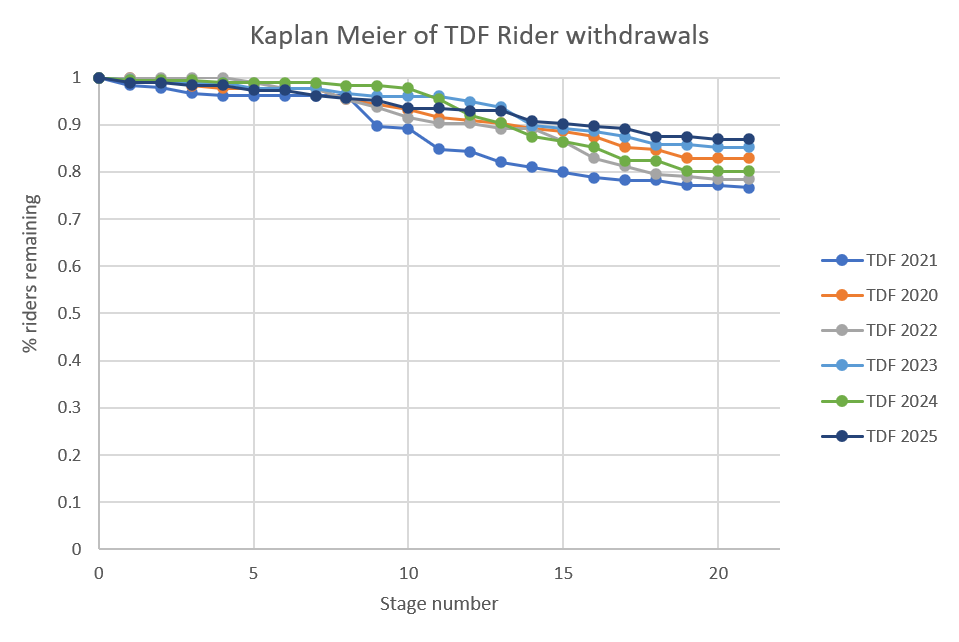
The number of withdrawals by type is pretty even, 48% were mid-stage abandonments, 52% were did not starts. Pie chart of withdrawals by type.   48% are mid-stage abandonments (in orange), 52% were did not start the stage withdrawals (blue). Pie chart of when the abandonment withdrawals occurred, 67% occurred in week 1 (blue), 25% in week 2 (orange), 8% in week 3 (grey). Pie chart of when the did not start withdrawals occurred, 33% occurred in week 1 (blue), 25% in week 2 (orange), 42% in week 3 (grey). 
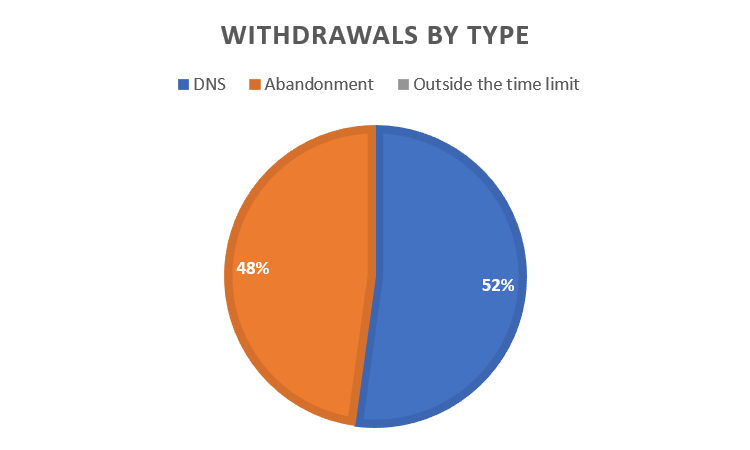
Since Did Not Start withdrawals are mostly "help, the damage has caught up with me" withdrawals, that pattern makes sense.

No comments:

Post a Comment