Saturday, 30 August 2025

Saints Ahoy - Game 28 and the 2024 Season to Date

Two points specifically about game 28. 

The first is about the diagrams. 

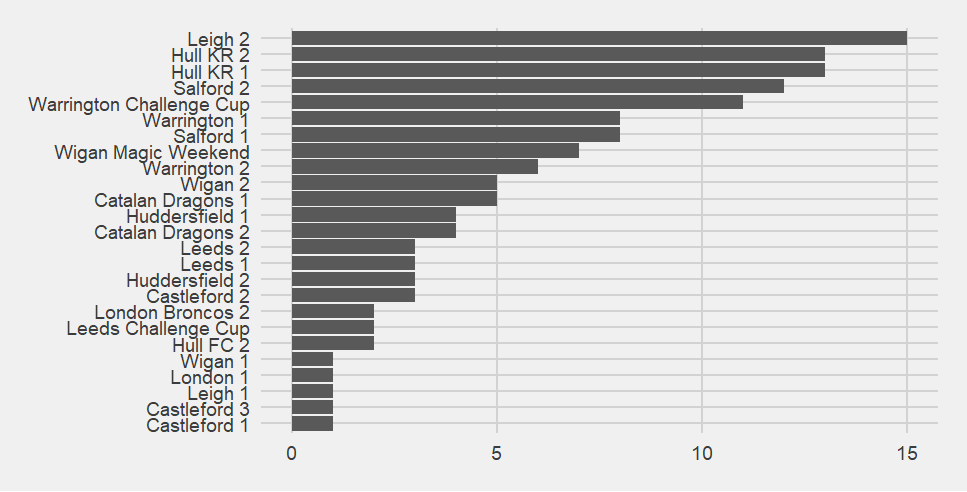
You will notice that this is game 28. In a 12 team league, the most games you should get is 22. Even counting Saints's two Challenge Cup games, that would be 24. Super League has 27 games in the regular season. 

How do you get from 22 to 27? 

To fill these "gaps" they have Magic Weekend, the Rivals round and a couple of seemingly random loop fixtures. Mysteriously, this means that we have to play our best/worst rivals more often - Saints got 2 extra games against Wigan in 2024 :( 

In 2024, one of Saints's loop fixtures was versus Castleford, which is why you'll suddenly see Castleford 3 in the figures. I'm putting this explanation in this post because it's the first time one of the teams will be referred to as [team name] 3. 

The second is about an odd tradition Saints have. For the last home game of the season, if a dearly beloved forward is retiring, and we've already won the match, we let them kick a conversion towards the end of the game. I suspected Mata'utia was going, but him getting given the kick to take was when I knew for sure. (Yes - this is often how we find these things out) 

It makes me sad, because I like him. He's an excellent forward, gives his all, and seems to care. I ask for very little and demand only two out of those three. 


Now onto game 28: 

The who was on the pitch when Saints scored figure looks really good. You can see the replacements coming on and off. Line chart showing who was present when Saints scored in game 28.  You can see from it that Clark was the replacement for Burns, and that Bell and Paasi were brought on. 
Who played together when Saints scored in game 28. Matrix of who played together when Saints scored in game 28.  The darkest area, the players most often together, are in the bottom right hand corner.  It contains Whitley, Matautia, Makinson, Lomax, Dodd, Batchelor, Bennison.  Above them is an orange pair, Bell and Knowles, then Delaney as a stronger orange on his own, above him is a darker orange pair of Welsby and Percival, then a paler section of Paasi, Clark, Burns, then Walmsley and Lees. 
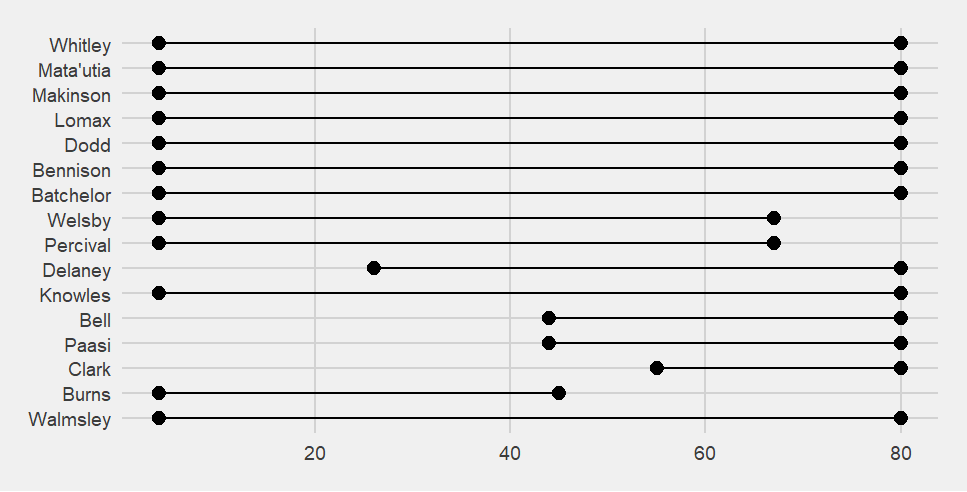
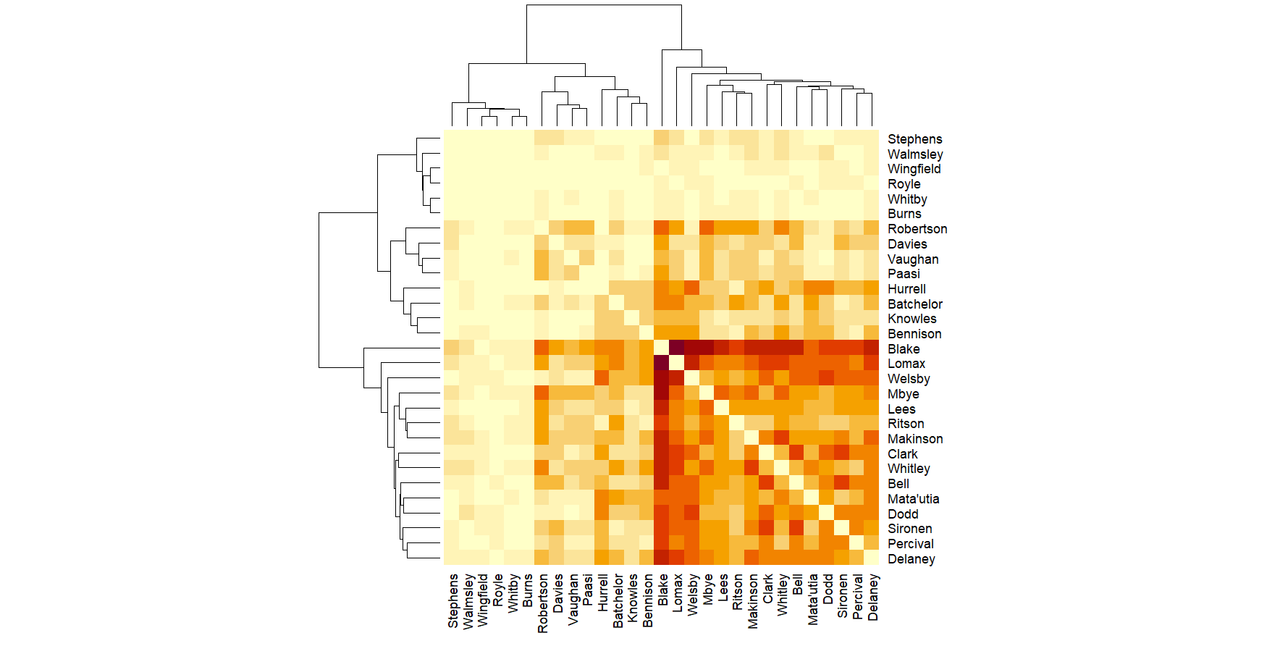
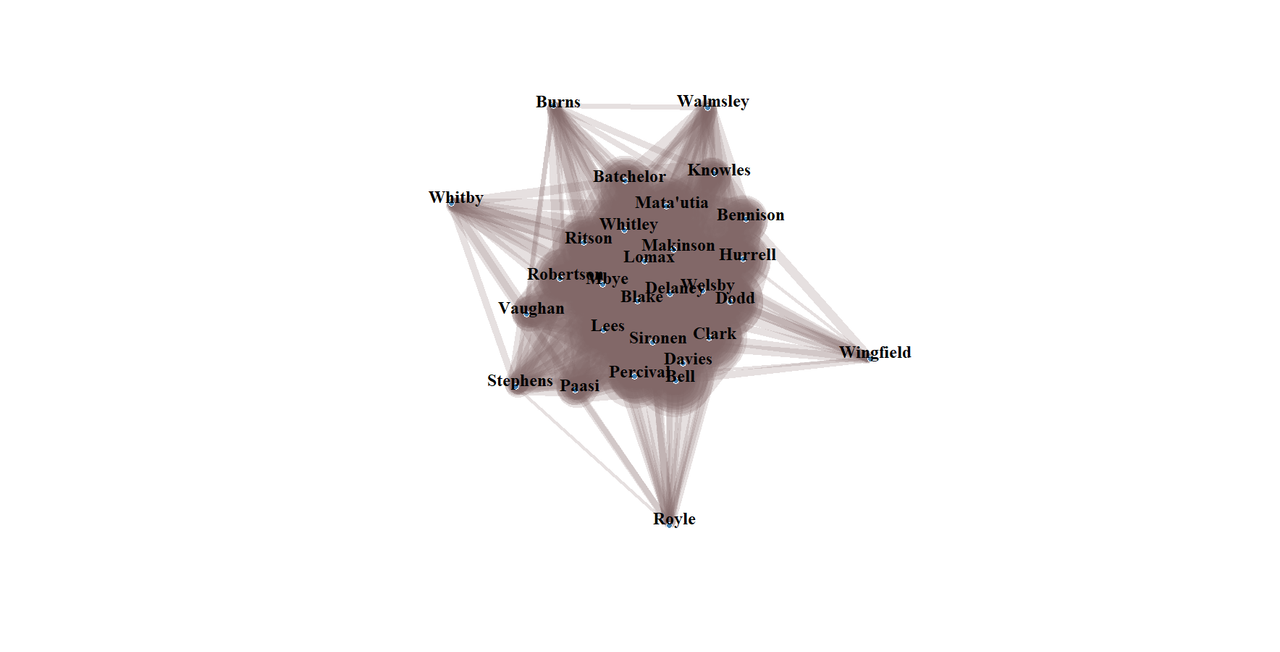
Knowles's crossing point with several players is much paler than expected given where he is in the diagram. 

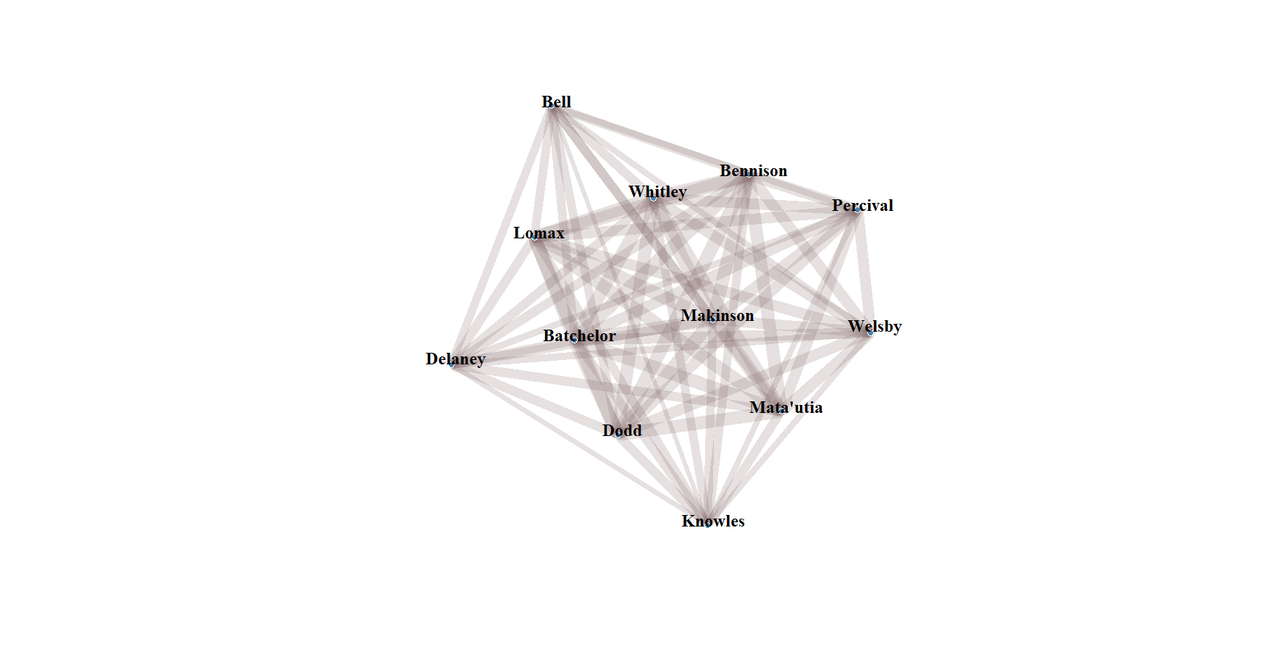
Network graph from the same game: Network graph, Bell, Delaney and Knowles are the outliers.  That might explain why some of the crossing points for Knowles are pale in the matrix diagram. 

On to the diagrams for the 2024 season. 

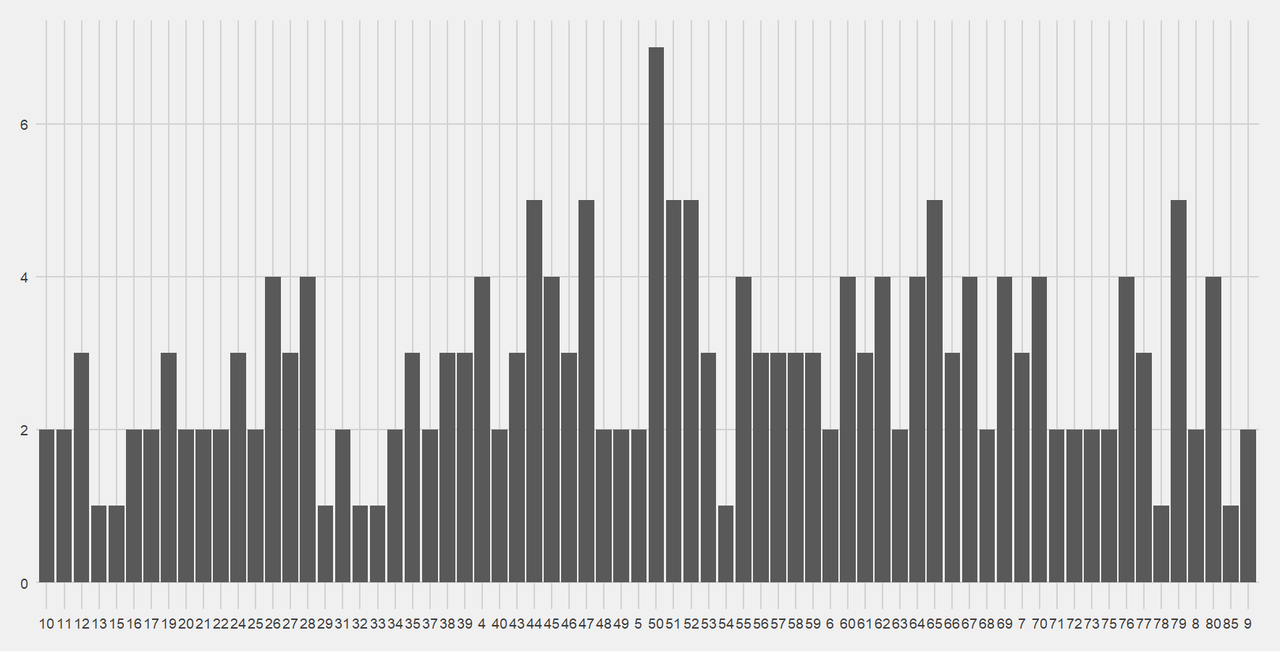
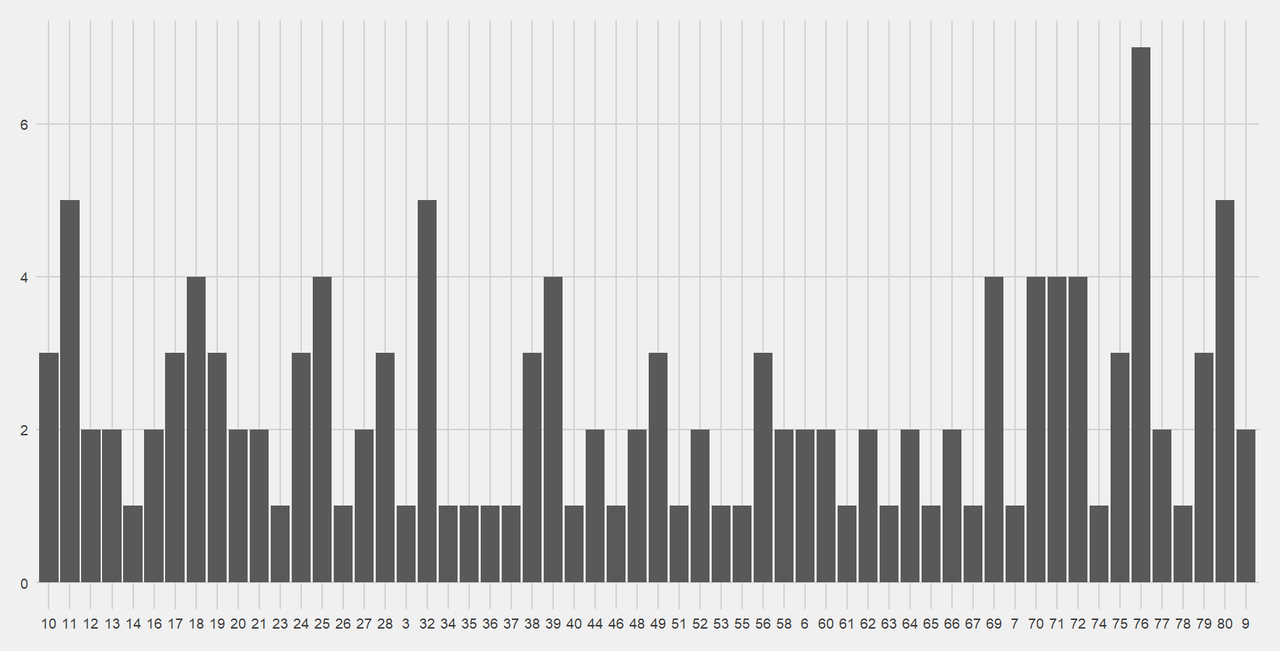
First of all, when do Saints score? Bar chart of when Saints score.  The shape is basically a normal distribution.  The highest point in minute 50 which has seen 7 point-scoring moments.  Minutes 44, 47, 51, 52, 65 and 79 feature 5 point-scoring moments. 
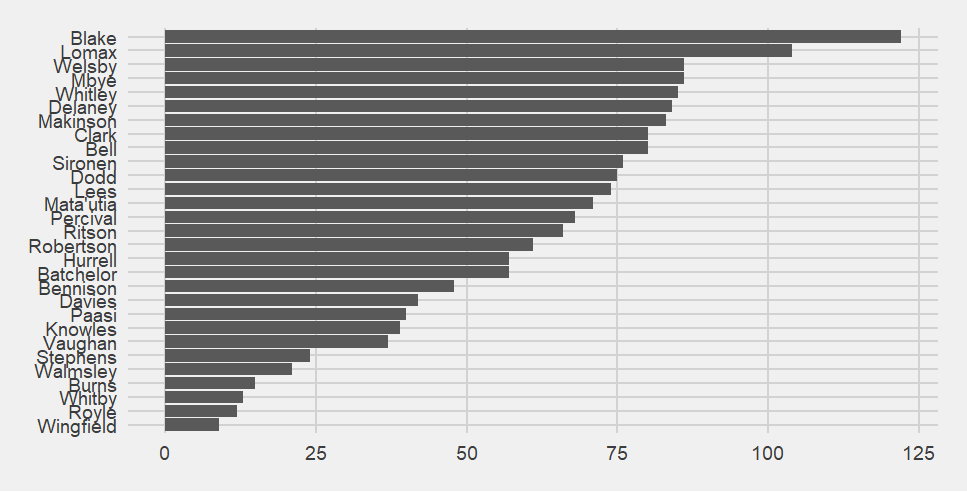
Who scores for Saints? Bar chart of who scores for Saints.  Percival is way in the lead with 60 point-scoring moments.  He is followed by Makinson on 20 (I was not kidding when I said way in the lead), then Bennison.  After Percival the number of point-scoring moments tails off quickly.  In total 25 Saints players have had at least 1 point-scoring moment - not bad from a squad of 36. 

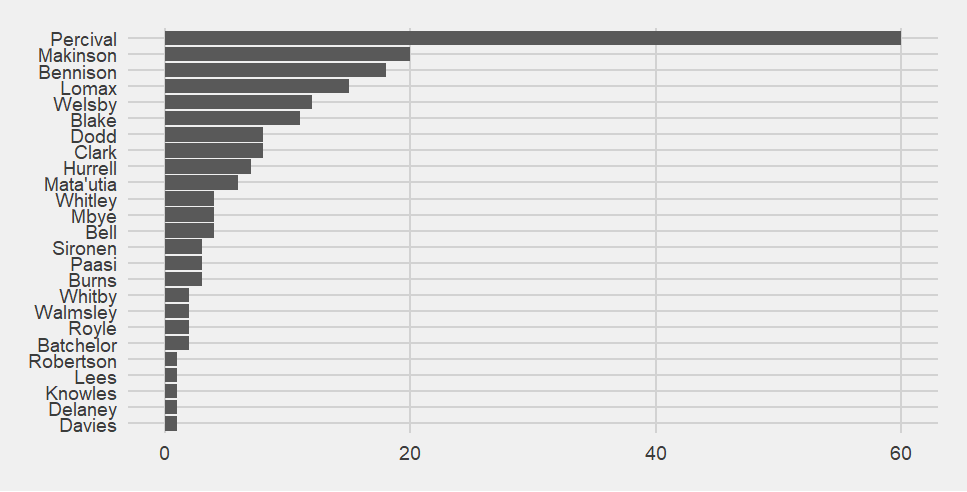
Of the top 3, Percival and Bennison are kickers so should be up there. While Makinson can kick, he's there mostly because of his tries. Oh, we are going to miss him! 

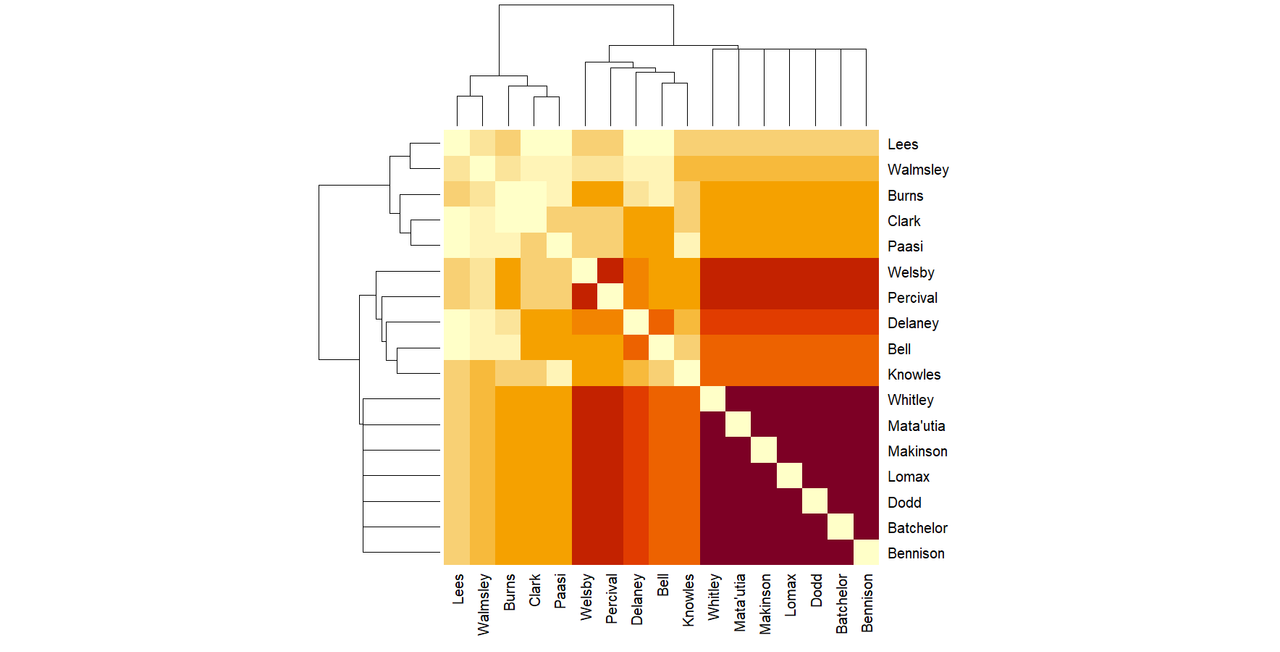
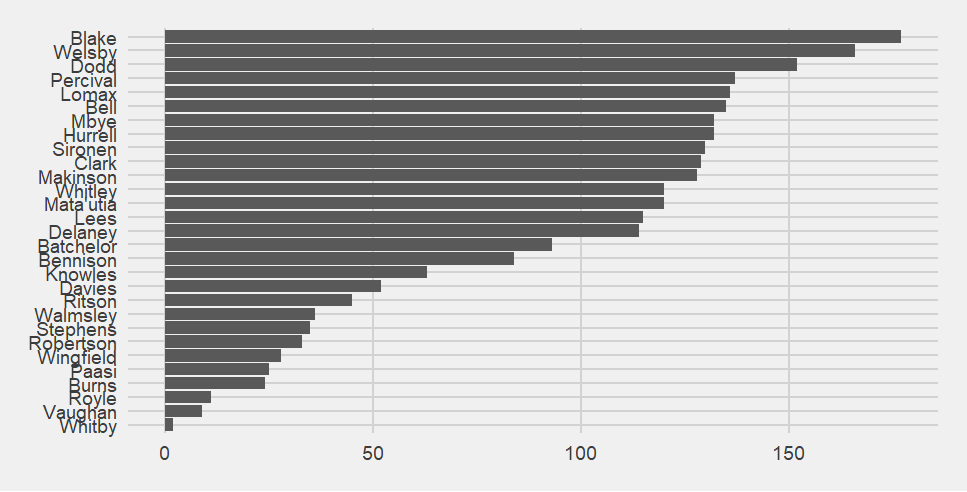
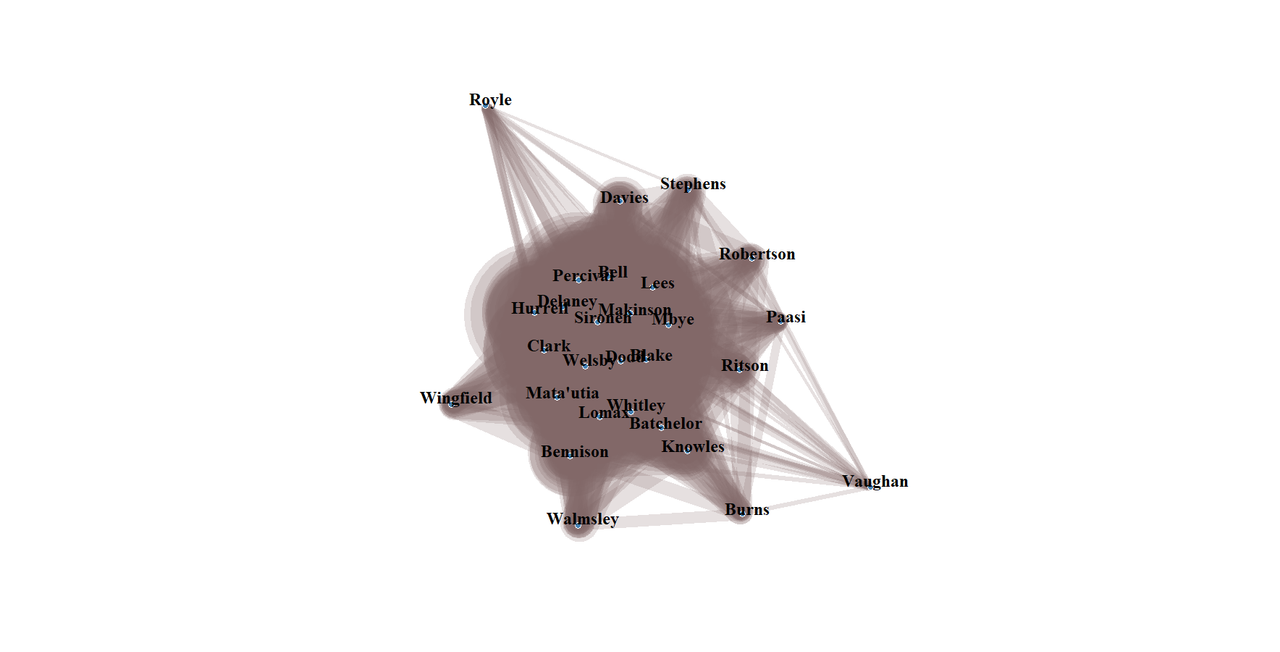
Who is present when Saints score? Bar chart showing which players are present when Saints score.  The top three are Blake, Welsby and Dodd, then there is a distinct drop to Percival, a slow drop in point-scoring moments present for for the next 12 players down to Delaney, then another steep drop to Batchelor, then comes Bennison and a steep drop to Knowles.  Then a slow decline again from Davies down to Burns, and then Royle, Vaughan and Whitby at the bottom. 

What does the matrix diagram of players who play together when Saint score look like after game 28? Matrix diagram of which Saints players are together when Saints score.  The darkest, most-often-together-group are in the bottom right.  It contains Blake, Welsby, Dodd, Percival, Sironen, Hurrell, Lomax, Bell, Clark, Mbye, Delaney, Lees, Matautia and Makinson.  There is a small, paler section of Whitley, Bennison, Batchelor.  Then comes the next palest section of Knowles, Davies, Wingfield, Walmsley, Ritson, Robertson and Stephens.  At the top and leftermost comes the palest group, those least often present together, which contains Royle, Whitby, Vaughan, Burns and Paasi. 

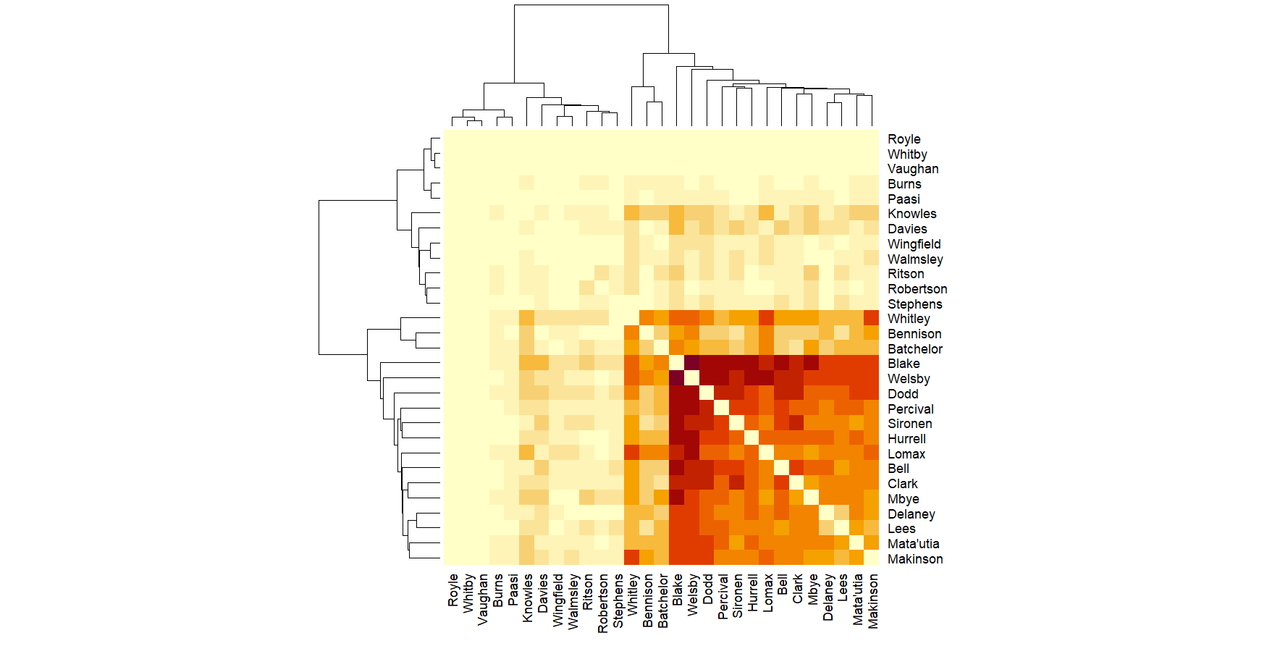
The thing that interests me about the matrix as it stands now is that for each section, the player most often involved with the others (and therefore the darkest line) is at the top left of their section, but the darkest section over all goes at the bottom right and the sections get lighter as you move up and left. 

That pretty much matches the network diagram, but not exactly: The network graph of players who play together when Saints score.  It matches, but not quite, the matrix diagram.  There is a central blob of players then the outliers.  The outliers are Sam Royle, top left, Vaughan, bottom right, Burns, bottom right but in a bit from Vaughan, Walmsley, bottom middle, Wingfield, bottom left.  The players either being pulled into or falling out of the central blob are Bennison (I think being moved in as he plays more), Knowles (ditto), Ritson, Paasi, Robertson, Stephens and Davies. 

The player in the matrix but not in the network graph is Whitby. 

If we swap over to look at when Saints concede - here are the teams that have scored against Saints. Bar chart of who scores against Saints.  Castleford, the opponents in this game, are one of 5 times Saints kept the opposition to just one point-scoring moment.  The other 4 are, Wigan the first time Saints played them, London the first time Saints played them, Leigh the first time Saints played them and Castleford the first time Saints played them.  That Castleford 2 is not on there tells me the second Saints vs Castleford match ended without Castleford scoring. 
There have been 28 games but only 25 teams feature on this chart because Saints kept 3 teams to 0 point-scoring moments. 

When do Saints concede? Bar chart of when Saints concede up to game 28.  Minute 76 has the most point-conceding moments, with 7.  The next highest are minutes 11, 32 and 80 with 5.  There is no obvious pattern to when Saints concede. 

I can't really see a pattern to the times. 

Who is present when Saints concede? Bar chart of who is present when Saints concede.  Blake is present for the most, followed by Lomax, then Welsby and Mbye. 
Who plays together when Saints concede? Matrix of players who played together when Saints concede up to game 28.  The colours are more spread out that in the scoring equivalent.  But there are still three obvious sections.  The darkest, most often together, section (Blake, Lomax, Welsby, Mbye, Lees, Ritson, Makinson, Clark, Whitley, Bell, Matautia, Dodd, Sironen, Percival and Delaney), then the medium section (Robertson, Davies, Vaughan, Paasi, Hurrell, Batchelor, Knowles and Bennison) then the palest, least often together section (Stephens, Walmsley, Wingfield, Royle, Whitby and Burns). 

The equivalent network graph looks like this: Network graph of players who play together when Saints concede up to game 28.  There is a central blob.  Stephens, Paasi and Vaughan are either being pulled into it, or falling out of it.  They are all in the bottom left corner.  Further out are, top left, Whitby, top, Burns and Walmsley, bottom right is Wingfield, and bottom is Royle.

No comments:

Post a Comment