Okay if we ignore that the leader finished almost a pitstop ahead of everyone else.
But there was racing everywhere else, even if that was partly due to tyre life offsets.
It was a proper, "I can't tell if God is a Ferrari fan, or if he hates us," race, because on the one hand, a driver getting a 10 second penalty for doing what three other drivers did when none of the others got penalised, on the other, the only thing that stopped Verstappen overtaken Leclerc was a virtual safety car.
It was most definitely not Carlos Sainz jnr's race. There has to be a way for a team to say "listen, our pit limiter is doing stupid things." Then again, they'd all use it to cheat ...
Not quite sure why the crowd were booing Norris. It's strikes as pointless. He is too inoffensive to hate properly. He's not Lorenzo. (Sorry, but Jorge Lorenzo enjoyed being booed and that made it fun. [Also, because I enjoy pain, I was a Pedrosa fan.])
If they'd chosen to boo Russell after all that radio whinging, I could live with it. Normally I like you, George, but that was unnecessary. But at least he gave the place back to Antonelli without complaint.
BBC commentary have reverted to Sam Bird from Damon Hill. This is most definitely not a good thing. Bird is so risk averse, it may explain why he hasn't won anything!!!
The second most important thing was, of course, Ferrari junior driver Oli Bearman getting 4th in a Haas. Or am I fixating on the wrong part of that ;)
Understandably, everyone is focussing on the OMG! there's only one point in the Driver's championship, but the Constructor's championship is also squeakily close in points.
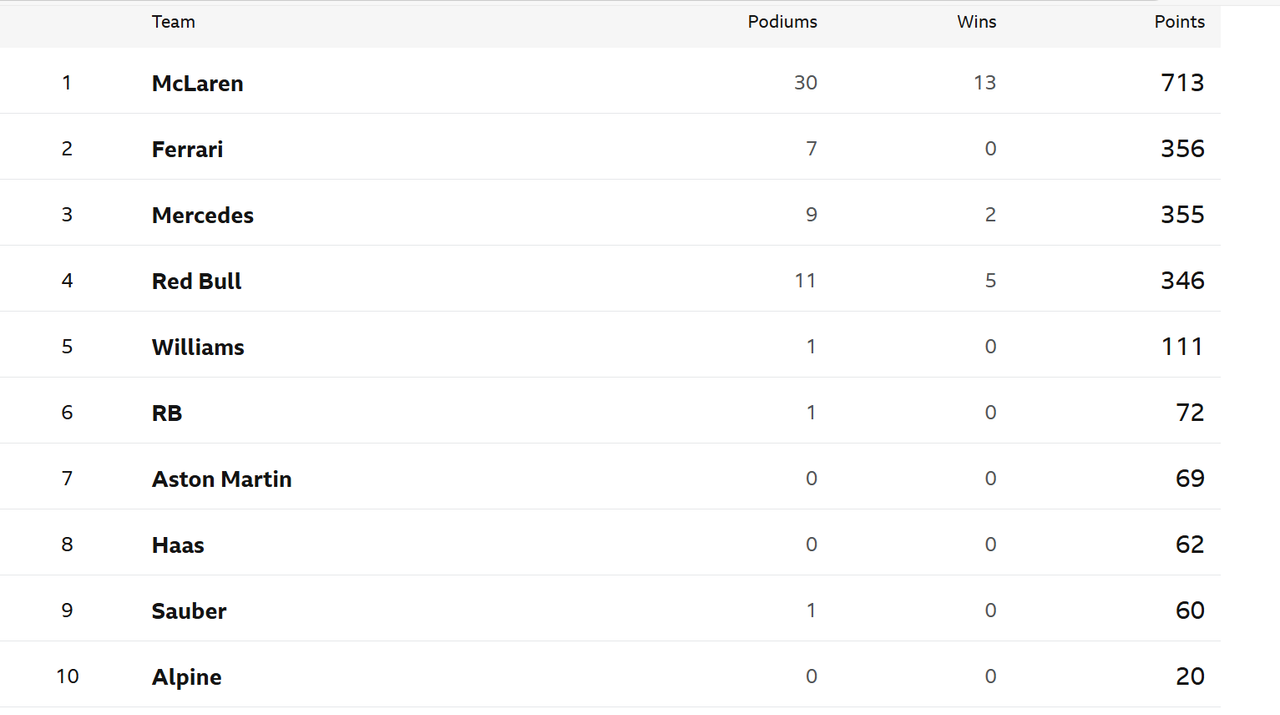
Okay, not the top, because McLaren have already won it, but there's 1 point between second and third, 10 points between second and fourth, and further down, there's 9 points separating seventh, eighth and ninth. How many millions per point down there!!!