Tuesday, 13 August 2024

Saints Ahoy - Visualisations from game 9 (Challenge Cup Quarterfinal)

Because I ended up a bit behind making these, I knew that adding the Challenge Cup to the visualisations wouldn't make a huge difference, because Saints only played two games, and lost to Warrington in the quarterfinal. 

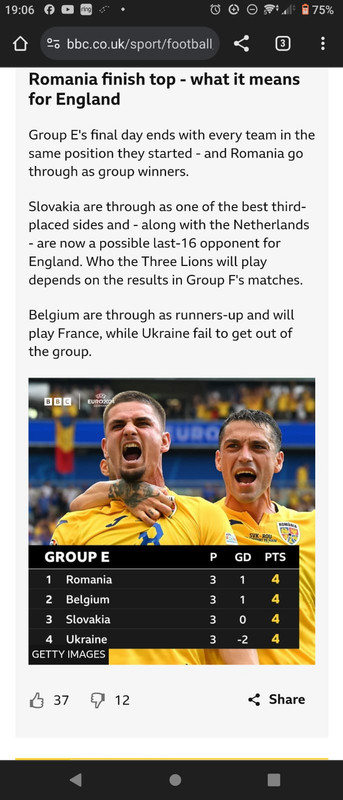
Losing to Warrington in the Challenge Cup is less humiliating than losing to them in the league, but that doesn't make it okay. (Match reports here (https://www.saintsrlfc.com/2024/04/14/saints-beaten-in-challenge-cup-quarter-finals/) or here (https://www.theguardian.com/sport/2024/apr/14/warringtons-second-half-onslaught-knocks-st-helens-out-of-challenge-cup). Possibly L needs to be nicer about George Williams.) 

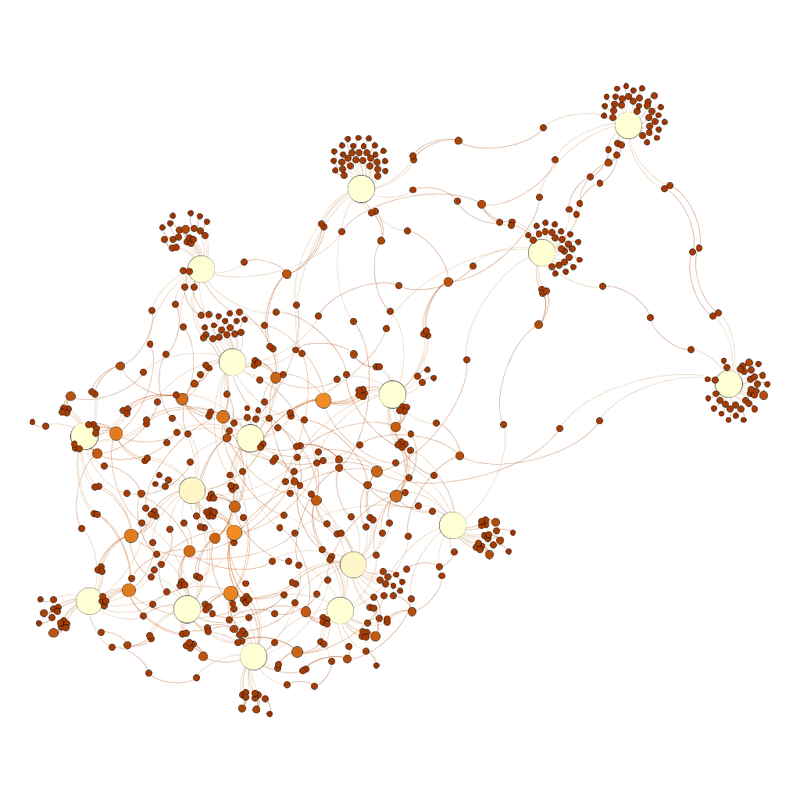
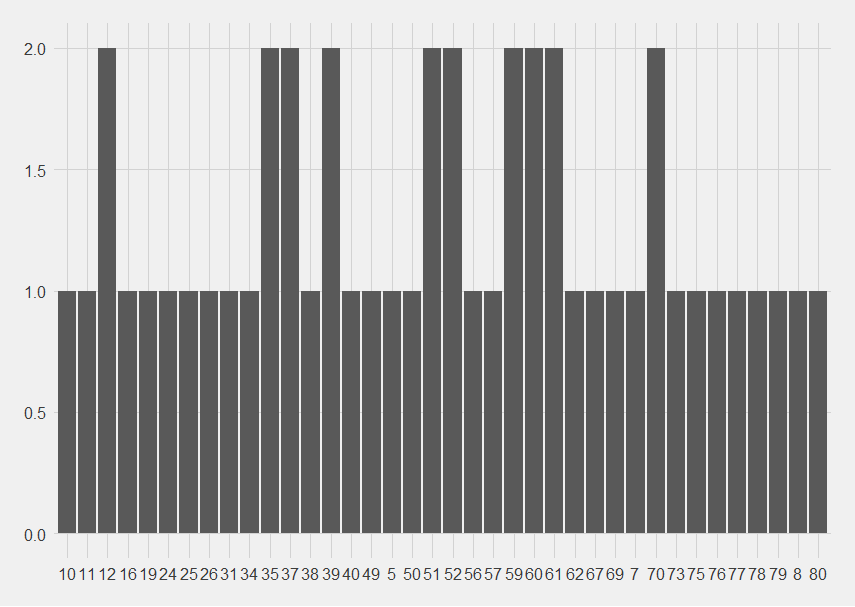
Saints conceded enough that there was actually a network graph for players present when they concede. Dodd, Matautia and Makinson are in the middle, with (clockwise from 12) Whitley, Batchelor, Hurrell, Blake, Delaney, Lomax, Welsby, Walmsley and Bennison. 
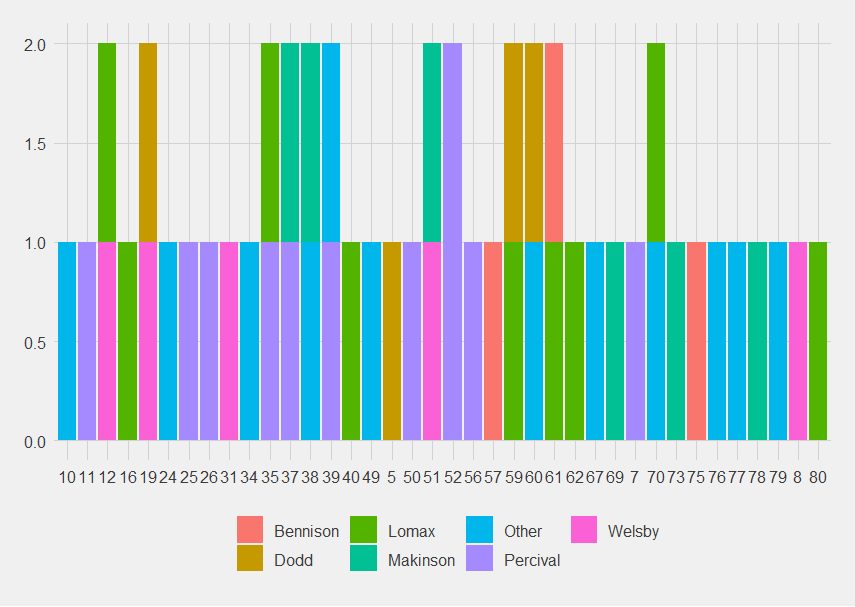
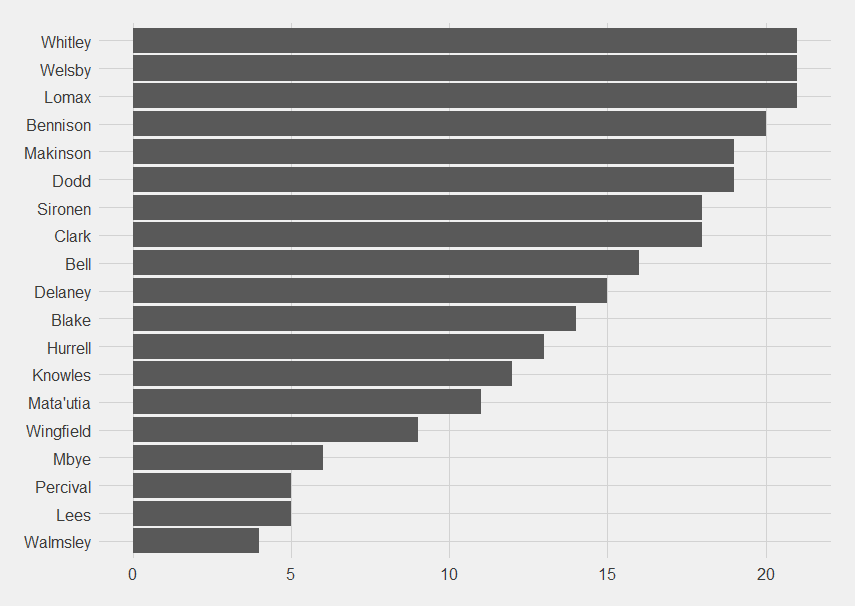
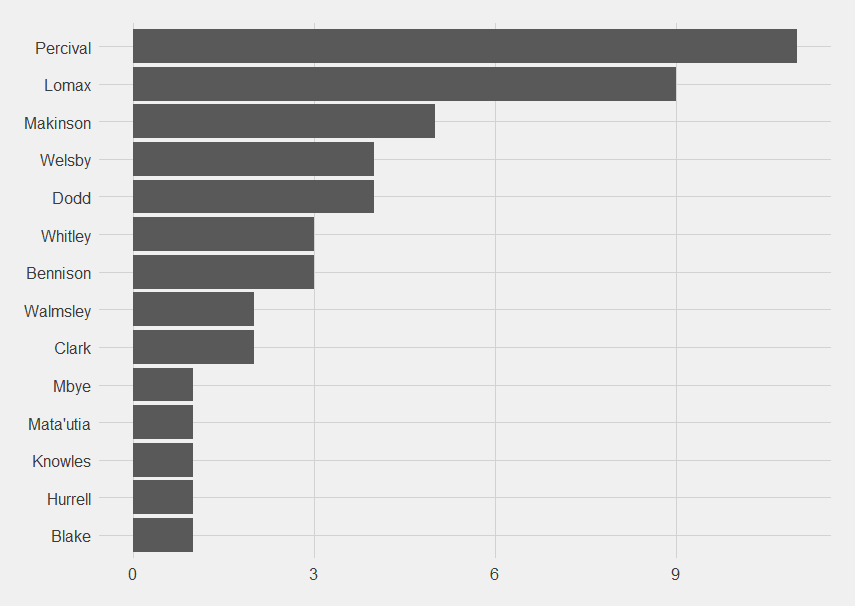
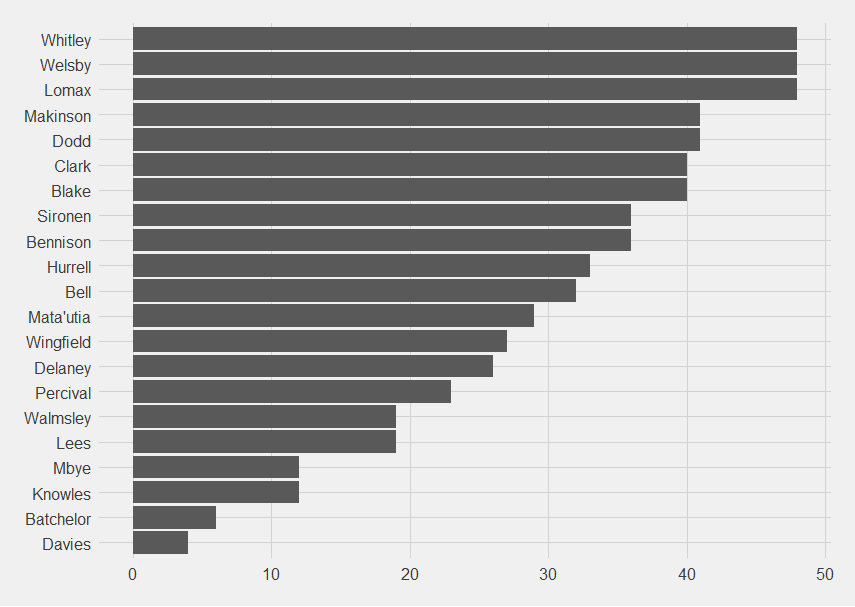
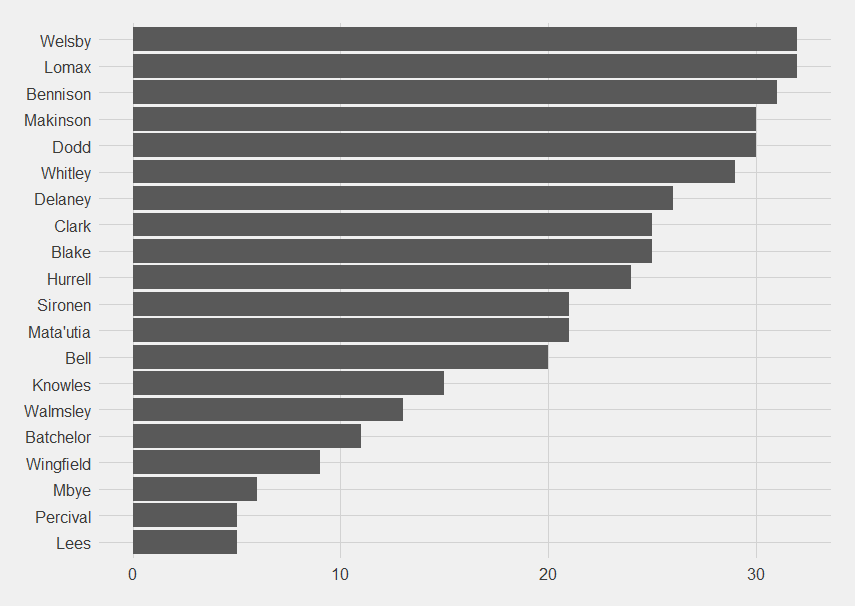
Which suggests only bad things about the number of times Warrington scored.

Who scores for Saints? (up to game 9)Percival is still in the lead, with 11 scoring moments.  Then Lomax with 9, and Makinson with 6. 
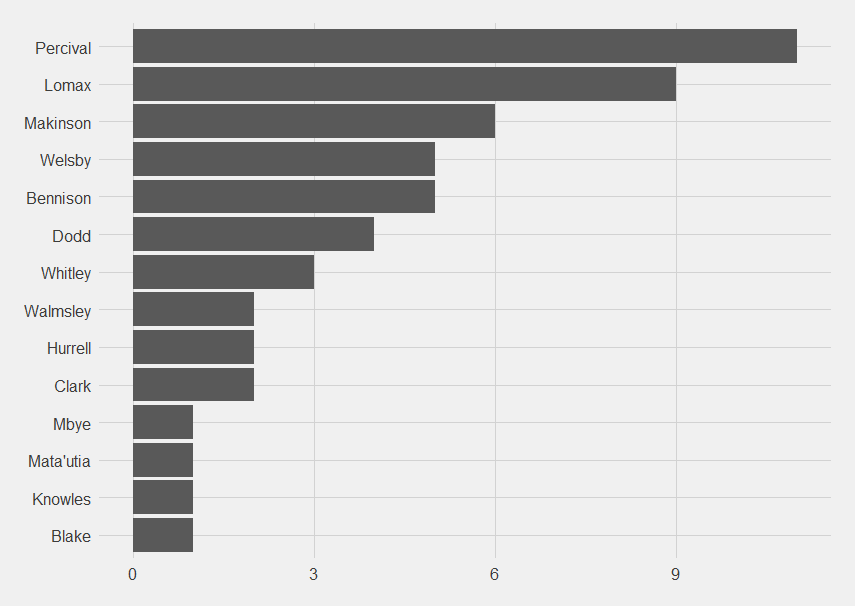
Percival has still scored the most, followed by Lomax and Makinson.

Who is present when Saints score?Welsby and Lomax are the only ever presents, Whitley has now missed one.  Davies, Batchelor and Mbye have been present for the least. Whitley has now missed one point-scoring moment but he's still in the deepest purple section of the who plays together when Saints score matrix. Whitley is still in the purple section with Lomax and Welsby.  The next most commonly together are Dodd, Makinson and Clark in red. After the Whitley, Lomax and Welsby group, the next most commonly together are Dodd, Makinson and Clark in red. 
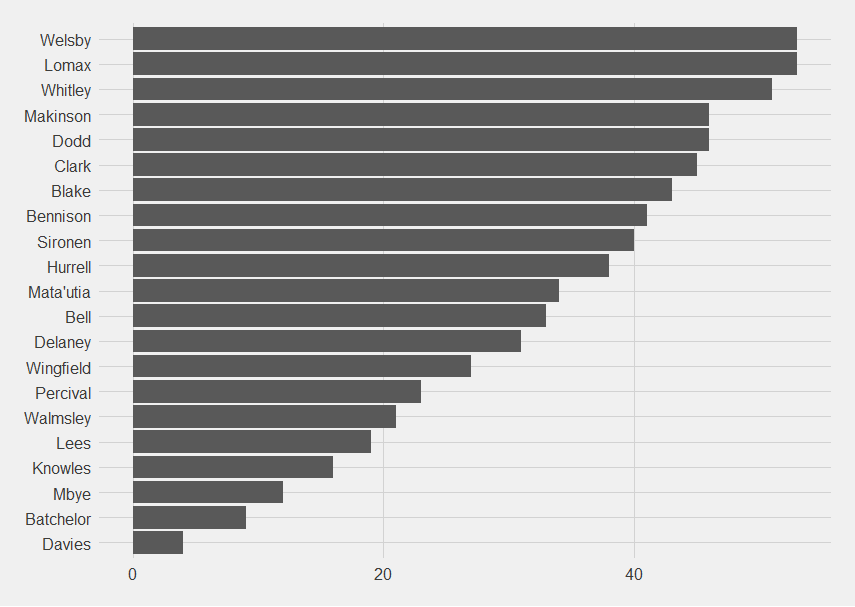
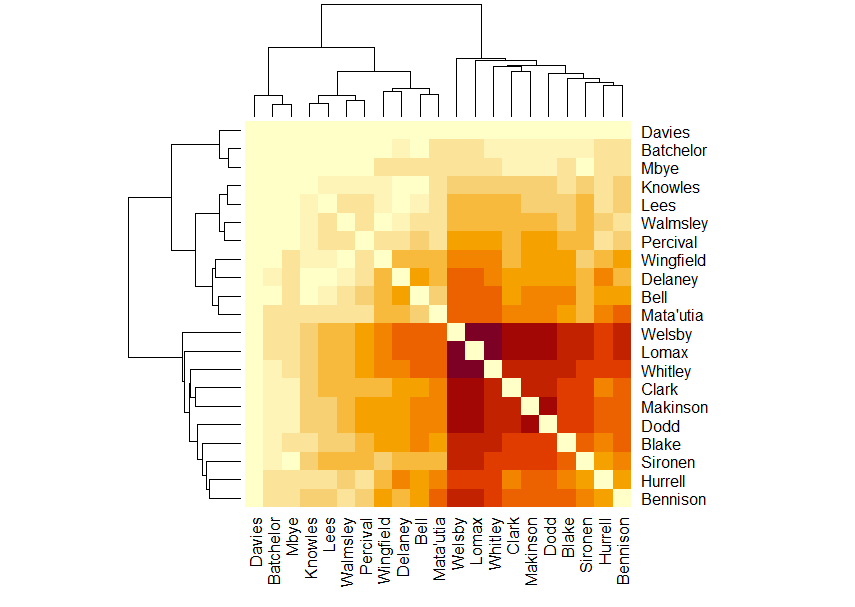
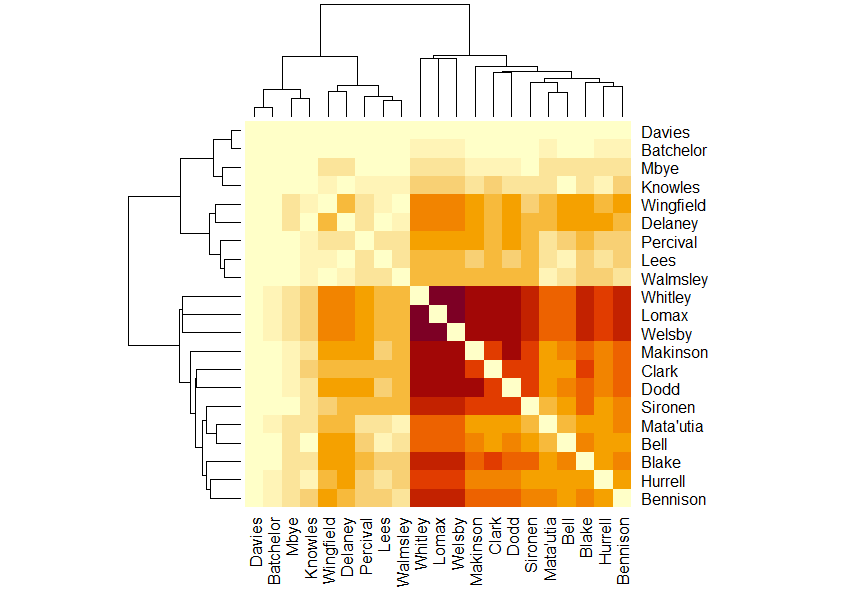
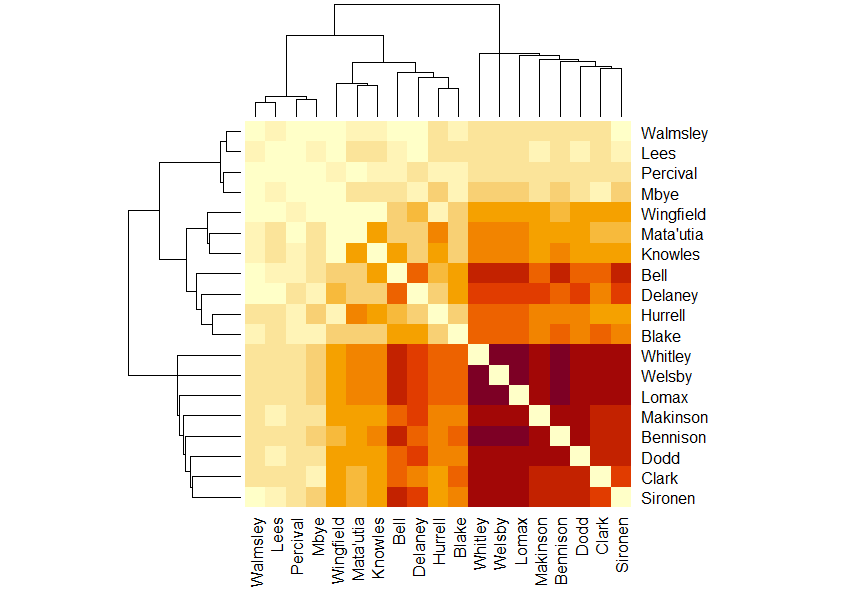
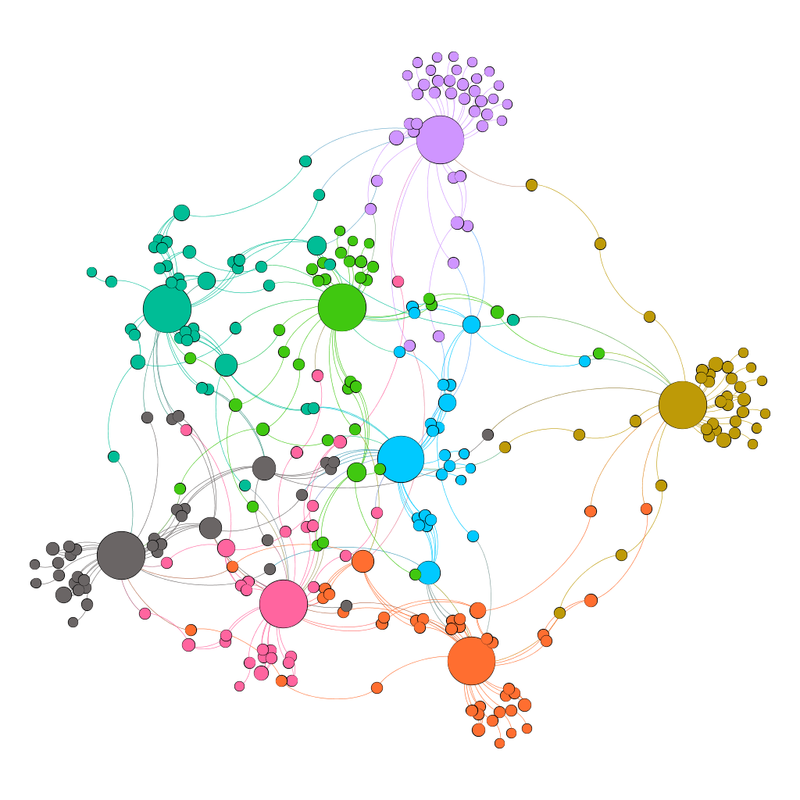
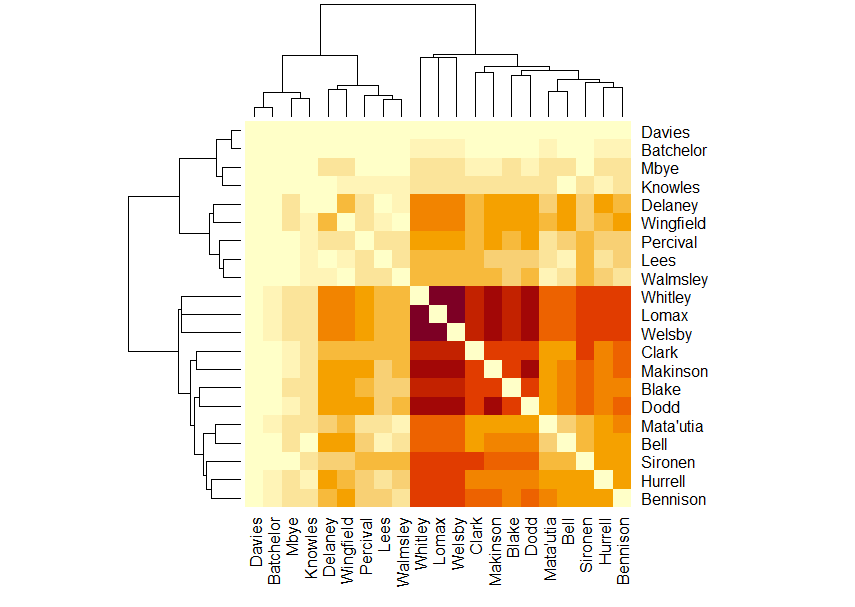
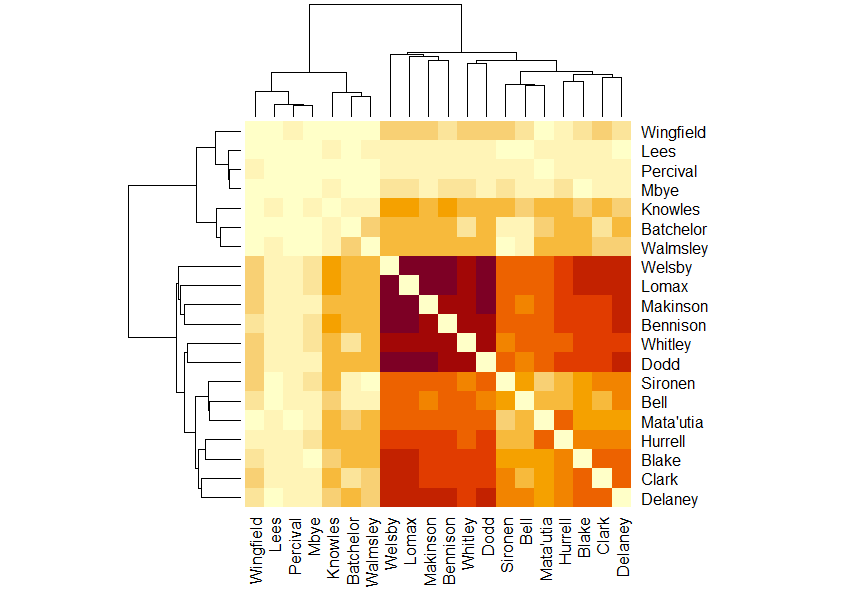
The ones that are less frequently together than you might expect are:
Sironen and Whitley 
Bennison, Delaney and Walmsley (Bennison is together with Welsby and Lomax more often than expected) 
Clark is together less often than expected with Bell 
Wingfield and Percival 
Whitley, Delaney and Batchelor Hurrell and Clark (although Hurrell's together with Delaney more than you might expect) 
Blake and Mata'utia (Blake is together more than you'd expect with Bell) 

Mata'utia is where the figure really splits between the frequently play together and less so. I think Percival is in that group because of his suspension. 

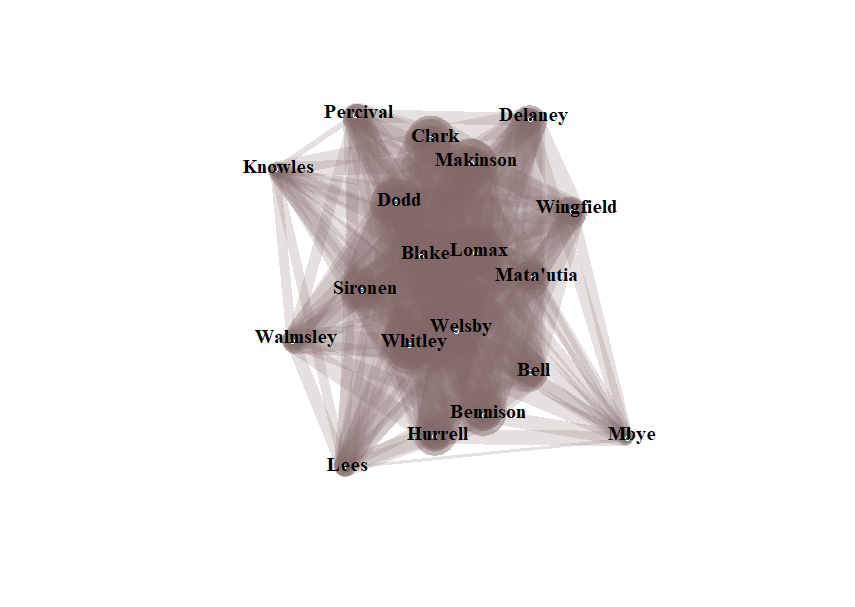
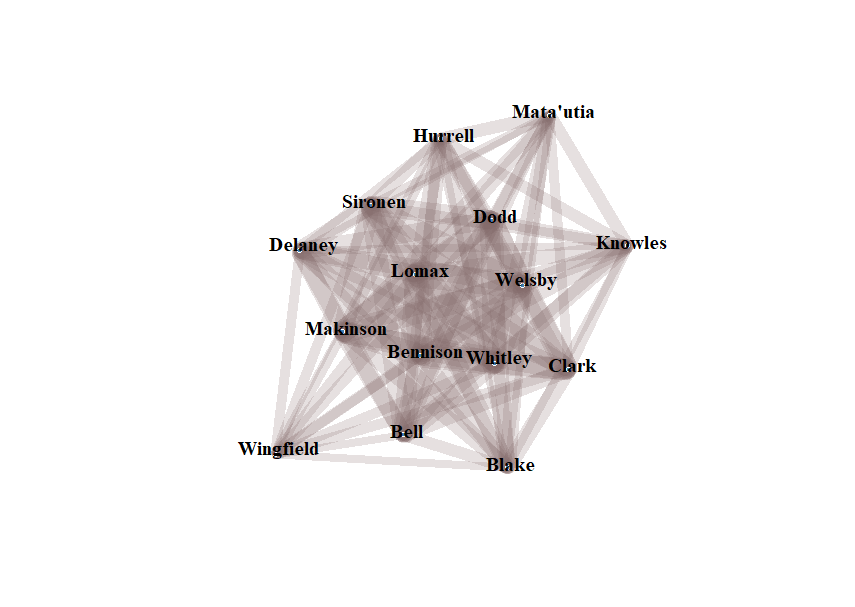
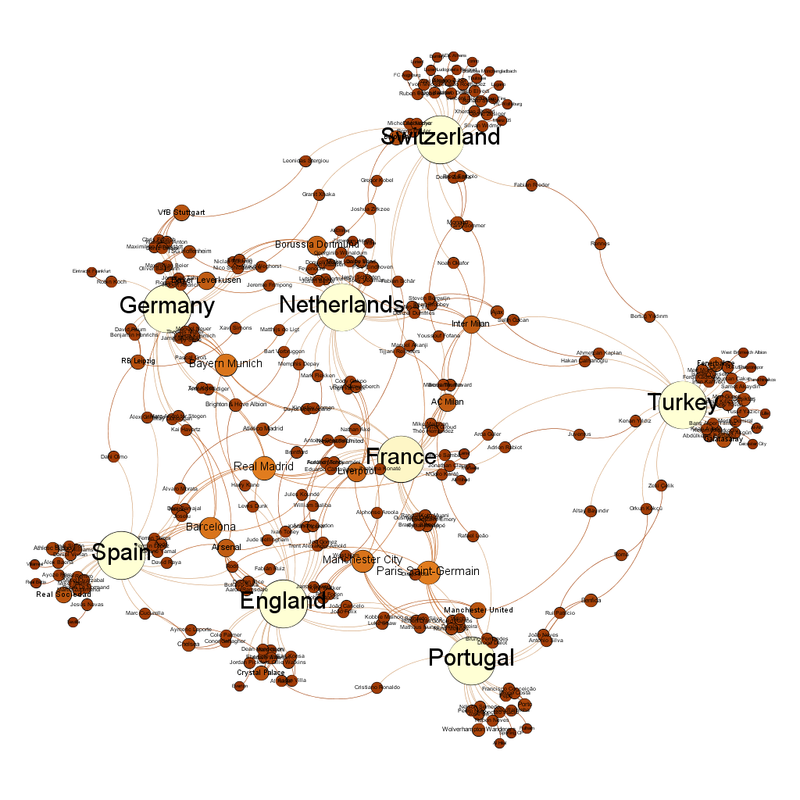
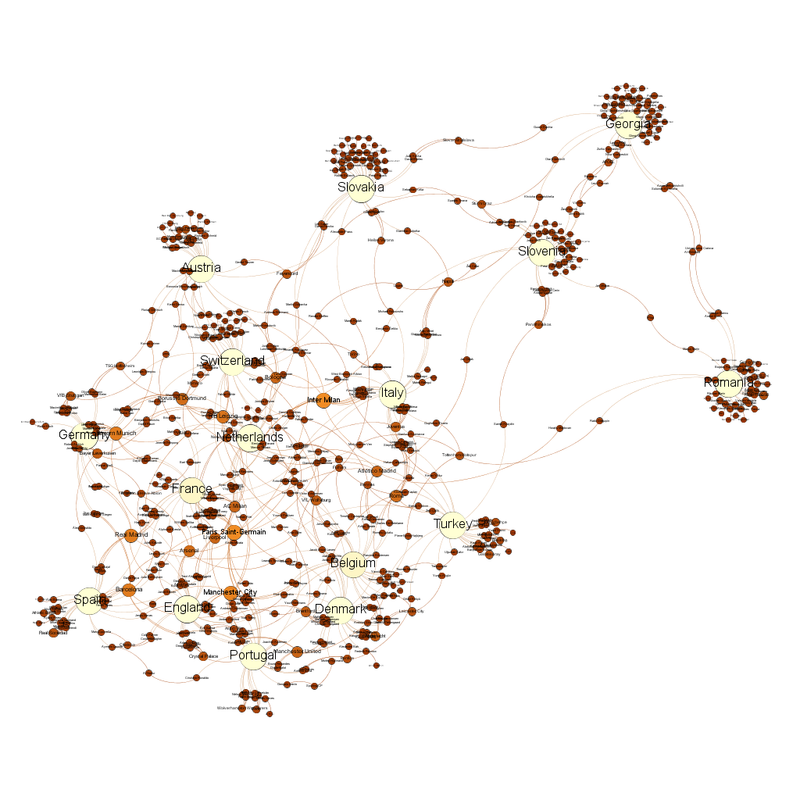
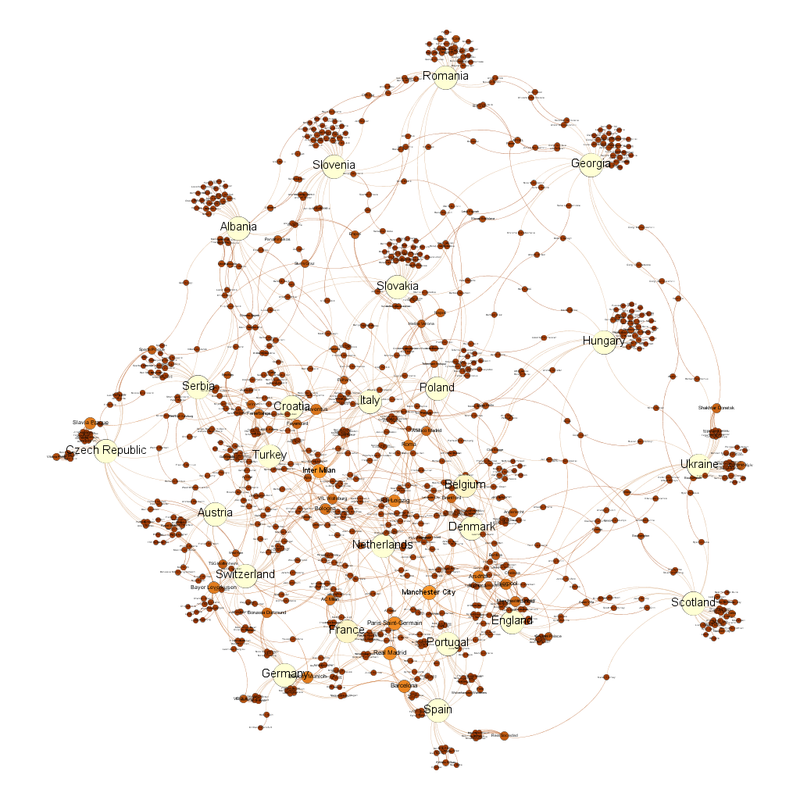
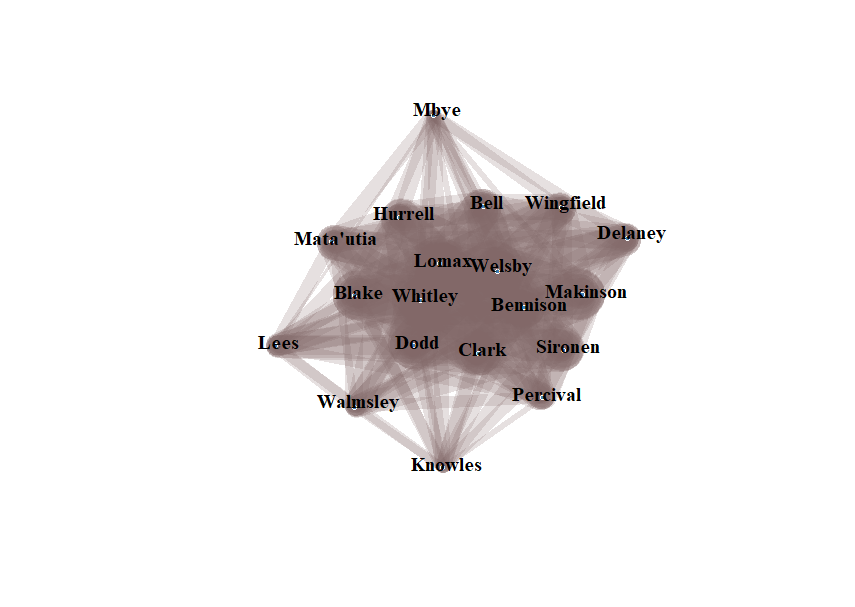
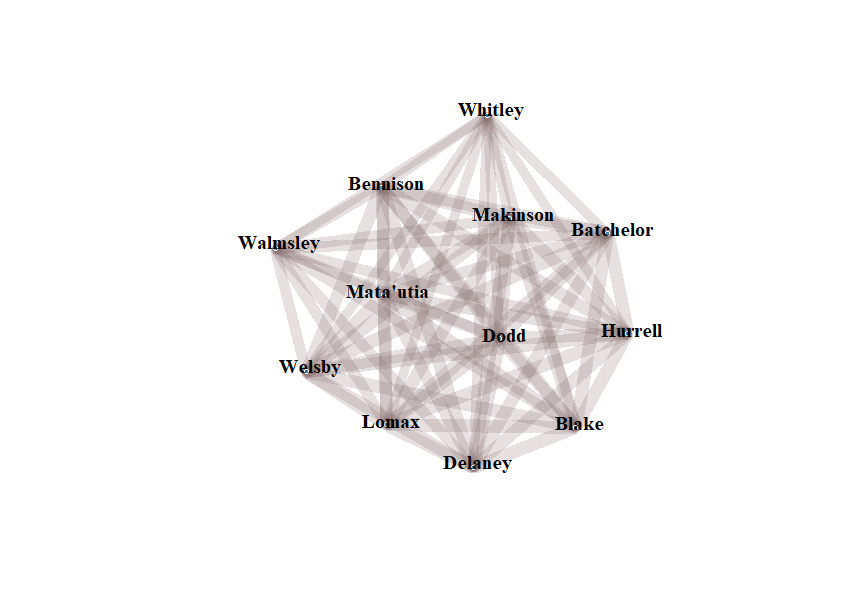
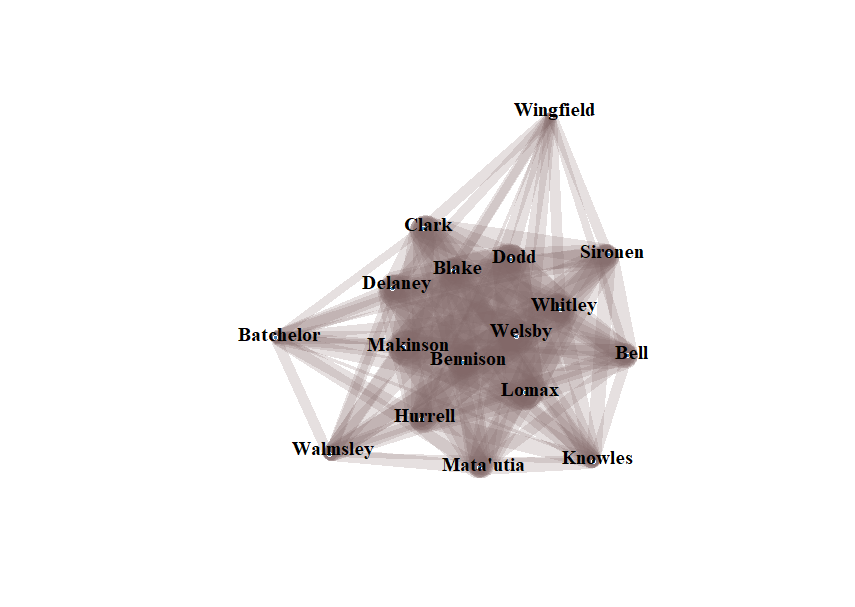
The "who is present when Saints score" network graph now looks spectacularly weird.  Those perpendicular lines really stand out against the other diagonal lines.   The thing that makes this graph look weird is it now looks like a square is being drawn, with a straight line between Walmsley and Batchelor (from left corner to right corner), and another straight line between Batchelor and Mbye.  The straight lines stand out from the diagonals that make up the rest of diagram. 
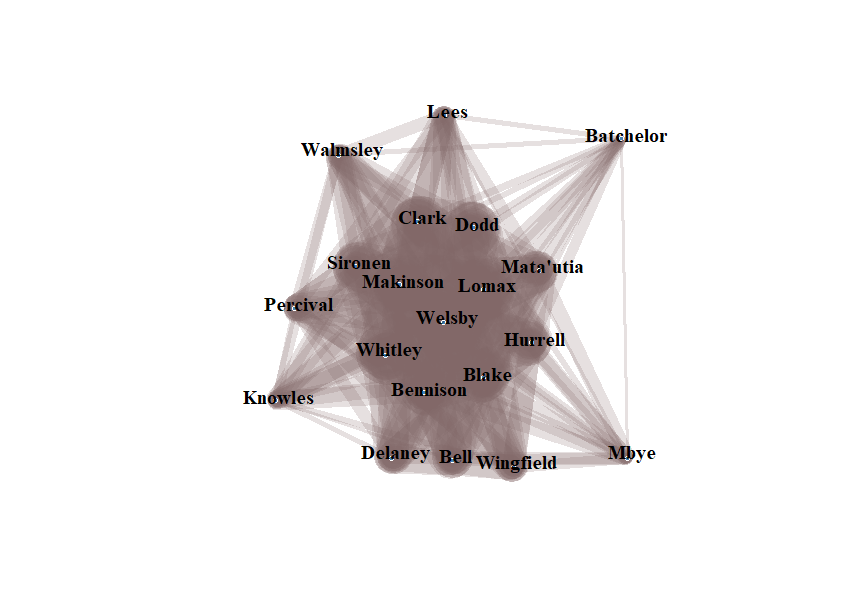
Lomax, Welsby and Makinson are the central core. The surrounding players are Clark, Dodd, Mata'utia, Hurrell, Blake, Bennison, Whitley and Sironen. Percival forms the link between that central group and the outer group (again I think that's because of his suspension) who are, clockwise from Percival, Walmsley, Lees, Batchelor, Mbye, Wingfield, Bell, Delaney and Knowles. 

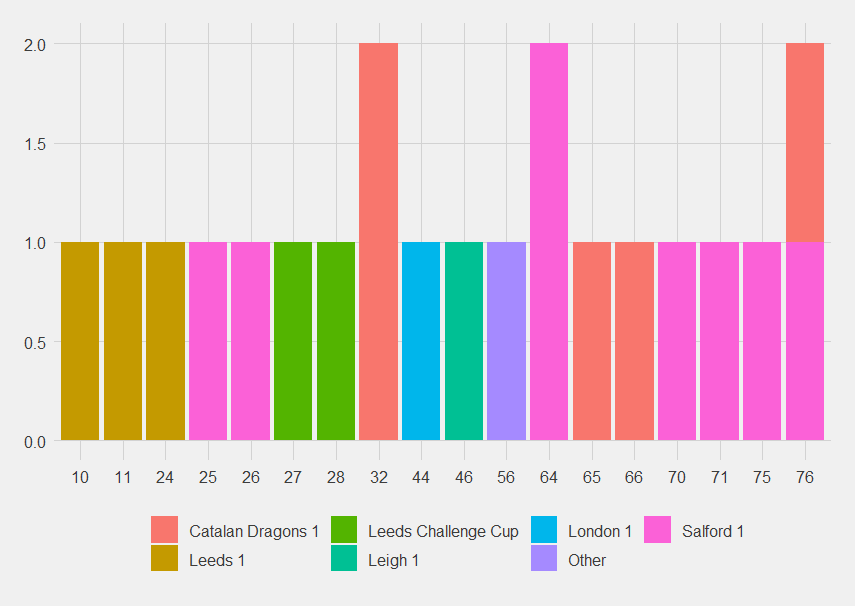
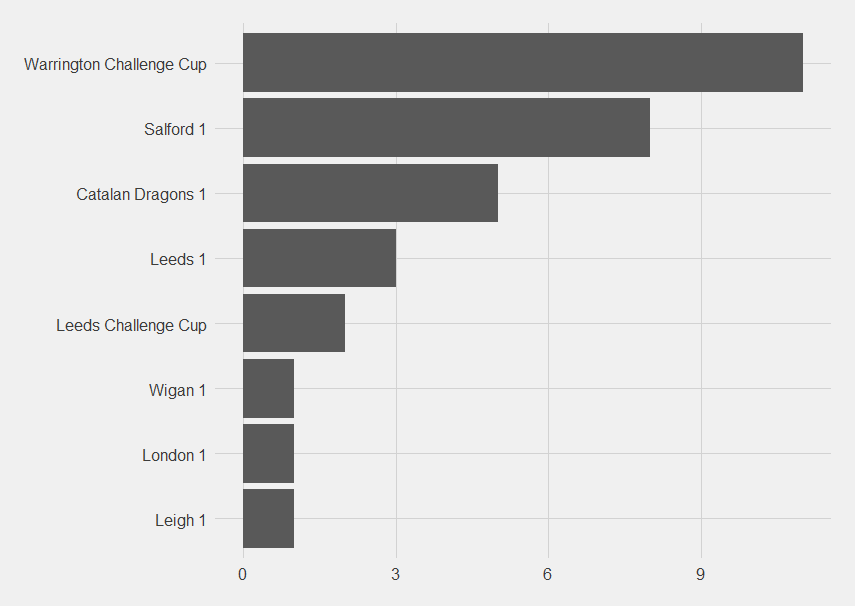
In the Challenge Cup quarterfinal, Warrington had the most point-scoring moments of any team who have played against Saints so far. Warrington in the Challenge Cup had the most point-scoring moments against Saints with 11 

As to when Saints concede there is starting to be a pattern of conceding the last 20 minutes of the game. Coloured-in bar chart. Ignore the colours for the moment.  There are three point-scoring moments in the first 20 minutes, 9 in the next 20, 5 in minute 41-60 then 14 in the last 20 minutes. 
I'm presuming this is as the team gets tired out. 

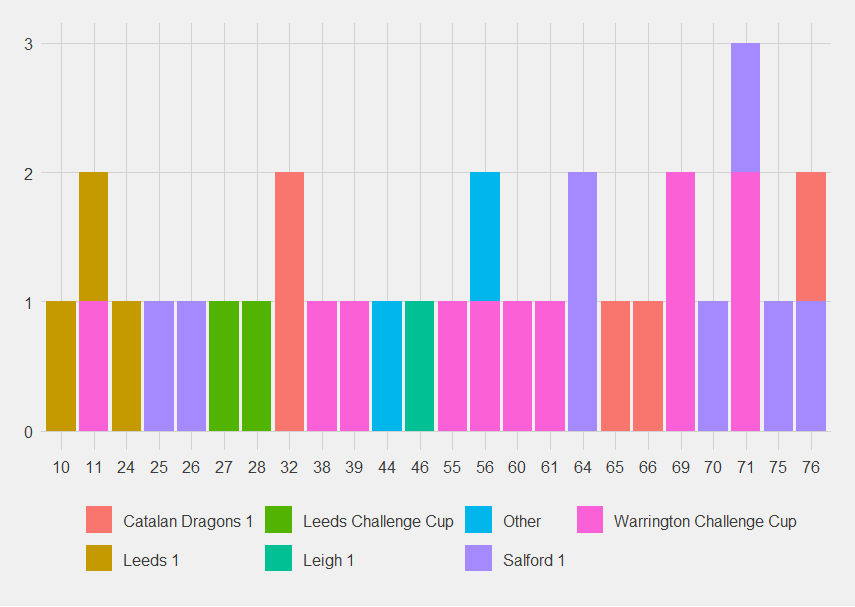
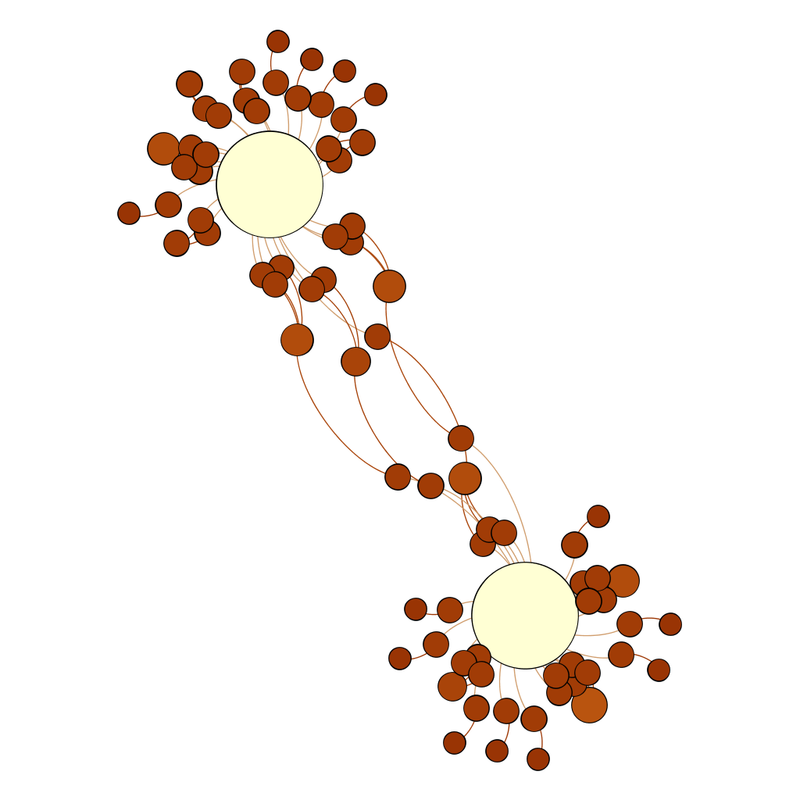
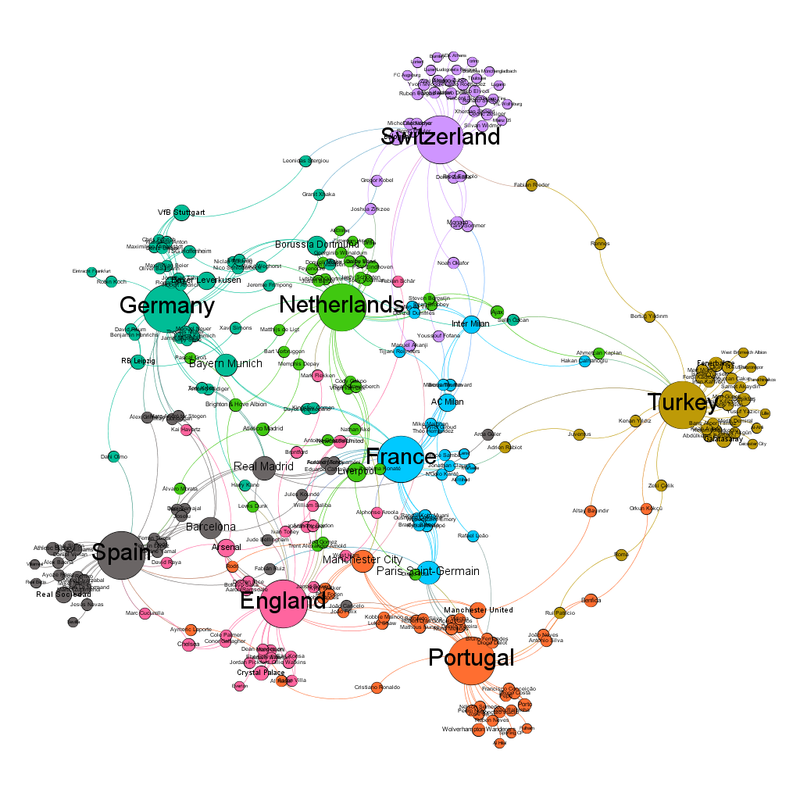
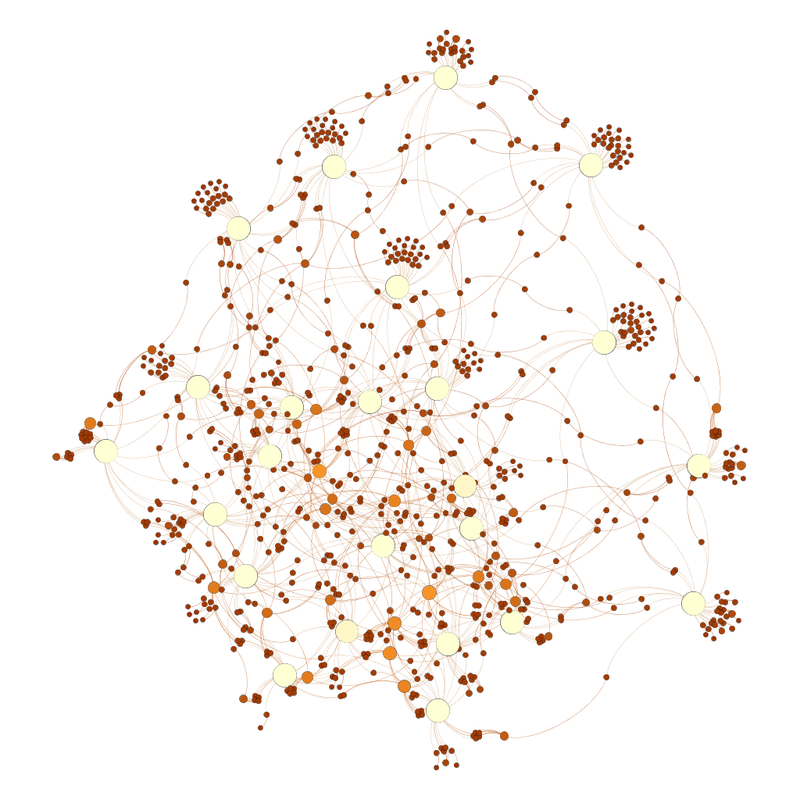
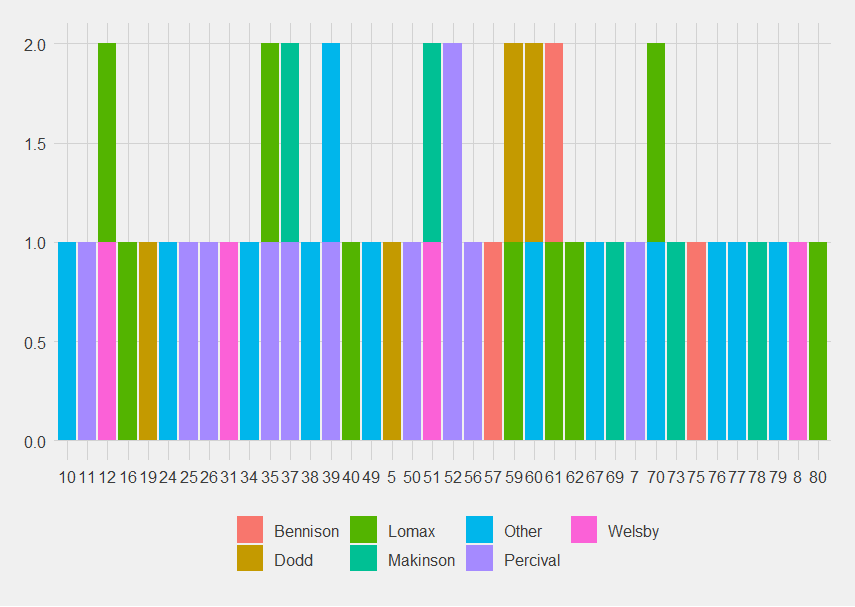
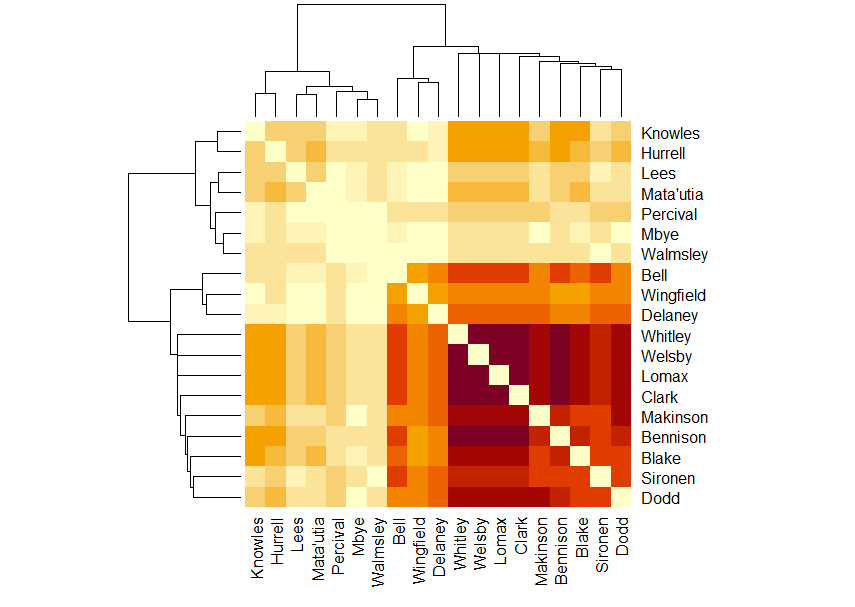
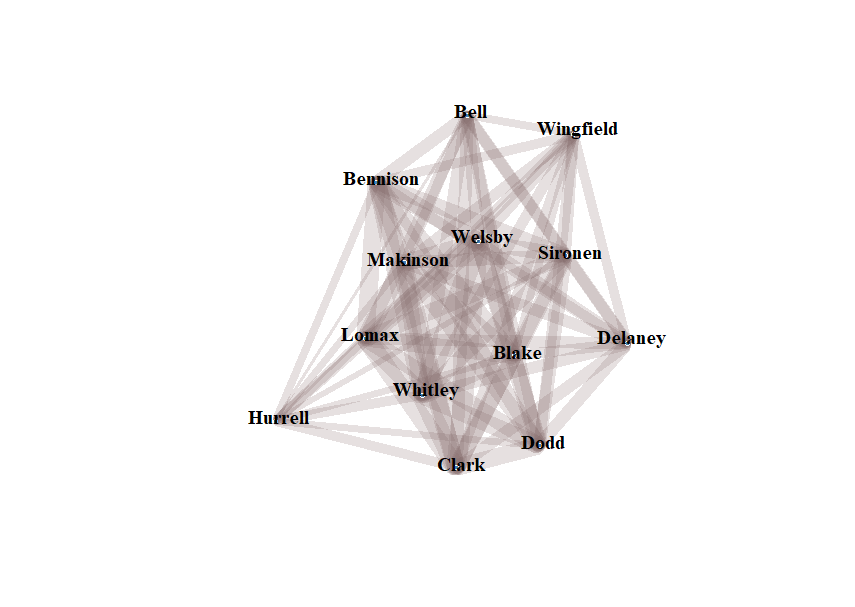
Who is present when Saints concede? Welsby and Lomax have also been present for all the times Saints have conceded.  Bennison, in third place, is a lot higher in this diagram than in the when Saints score diagram.  Mbye, Percival and Lees are present for the least concessions. Combining the info from the last graph and this, I think Percival is so low down because when he plays, Saints tend to take him off around minute 50, so before the high concession time begins. 

The matrix diagram shows that Whitley is present for fewer point-conceding moments than you'd expect. The central purple of the most frequently together has Welsby, Lomax, Makinson, Bennison and Dodd, Whitley is within the central portion but a paler red. There are now 17 players in the network graph for when Saints concede. Welsby and Bennison are the central players, surrounded by a core of (clockwise from 12) Dodd, Whitley, Lomax, Hurrell, Makinson, Delaney and Blake.  They are surrounded by Clark, Sironen, Bell, Knowles, Matautia, Walmsley and Batchelor.  Wingfield sticks out at the top, sort of North by North East. 
I think Wingfield is sticking out up there because he's been out injured so long.

Wednesday, 7 August 2024

Formula 1 2024 - Japanese Grand Prix

It's probably not a good sign that I can't remember anything about the Japanese Grand Prix, even though it is admittedly four months on.  My race notes suggest it was bitty and not exciting as well.

Have read up on it using other people's sources, it was one of the ones where McLaren's race strategy was worse than Ferrari's and Leclerc had to rescue a less than good qualifying performance.  It may even have been the start of when this year's car started to show it had no go in comparison to the others.  Or Ferrari's upgrades weren't as good as the other teams's.  Either way, not good!

Wednesday, 17 July 2024

Saints Ahoy - Visualisations up to Game 8

I warned you that real life had happened so I'm now catching up. 

The next match analysed for this project was Saints away to Catalan Dragons on the 6th of April. 

The match ended with what the Saints website described as a narrow away loss - https://www.saintsrlfc.com/2024/04/06/saints-suffer-narrow-loss-away-at-catalans/ 

What it did do was bring up 50 point-scoring moments for Saints (so 6.25 scoring moments per match). There is no pattern as to when Saints score (or at least not yet). Colourful bar chart of which Saints players score and when.  There is no pattern as to time but it is noticeable that there are a lot of unconverted tries. While there is no pattern, the lack of conversions starting to show (you'd expect a differently coloured bit next to each other or on top of each other, there aren't many of those). This is a problem and will be a problem come the play-offs, presuming we make it. 

Which Saints players are present when they score? Only three players are present for all scoring moments and it is a pretty smooth diagonal down to the ones not present often. Whitely, Welsby and Lomax were present for all 50 point-scoring moments. The next most present are Makinson and Dodd. 

Present least often are Mbye (12), Batchelor (6) and Davies (4). Davies is because he was out injured (and then sent out to Swinton to get match fit [https://www.sthelensstar.co.uk/sport/23520688.paul-wellens-gives-konrad-hurrell-update-praise-ben-davies/]). Mbye's is because he only plays when Daryl Clarke can't or needs spell on the bench. 

I'm not sharing the dendrogram because it's officially too complicated to interpret. 

The matrix diagram looks like this. There is a central darker patch of players that play together often when Saints score.  It gets paler as you move out, with an extra pale swatch on the top and far left. Paler squares are for players who do not play together when Saints score. These are starting to form some interesting patterns: 
Bell, Lees, Knowles 
Hurrell, Lees, Knowles 
Mata'utia, Walmsley 
Sironen, Wingfield 
Dodd, Lees 
Makinson, Lees, Knowles 

Some of these I can explain as forwards who don't play together often. Makinson and Lees and Knowles, and Dodd and Lees, I can't explain. 

There are 19 players in the network graph, like there was last time (https://fulltimesportsfan.wordpress.com/2024/06/03/saints-ahoy-visualisations-from-game-7-and-the-season-to-date/). It's tilted about 90 degrees anti-clockwise and now looks like a slightly nobbily tilted square. The central chunk are Sironen, Blake, Lomax, Matautia, Welsby and Whitely.  Then there is another chunk on top; Dodd, Clark and Makinson.  There are another chunk at the bottom; Hurrell, Bennison and Bell.  Outside these, starting from top left are Knowles, Percival, Delaney, Wingfield, Mbye, Lees and Walmsley. The central chunk are Sironen, Blake, Lomax, Matautia, Welsby and Whitely. The chunk on top are Dodd, Clark and Makinson. The chunk on the bottom are Hurrell, Bennison and Bell Outside (from top left) = Knowles, Percival (I presume because of injury and suspension), Delaney, Wingfield, Mbye, Lees and Walmsley 

In the 8 games, Saints have conceded 21 point-scoring moments. 

 Most interestingly, they have conceded at minute 76 to two different teams. Bar chart showing when Saints concede.  The point of interest is minute 76, the only point where they have conceded to different teams, Catalan Dragons and Salford. The three players most present when Saints score are also most present when they concede, then Bennison, then Makinson and Dodd. Bennison much higher on the "when Saints concede" chart than on the "when Saints score chart". Whitley, Welsby and Lomax are present for all 21 concession moments, then Bennison for 20, then Makinson and Dodd for 19.  Walmsley, Lees and Percival are present for the least; 4, 5 and 5 respectively. The players present for the least concession moments are Walmsley, Lees and Percival, which is probably due to the number of minutes those three players have played. 

If we look at the concession matrix, it looks like this: Players present together when Saints concede.  In this one, the dark patch for present together most often is in the middle but the next most often together is in the bottom right corner, with less often together in the top left. The players whose crossing points are paler than expected, which suggests they don't play together when Saints concede are: 
Clark and Mbye (which makes sense because they are both hookers) 
Dodd and Lees 
Makinson and Lees 
Blake, Percival and Mbye 
Hurrell and Wingfield 
Delaney and Mbye 
Knowles and Wingfield 
Mata'utia and Wingfield 

The Wingfield paler bits are probably because he was playing with them before he got injured (https://www.sthelensstar.co.uk/sport/24313416.saints-heart-broken-jake-wingfields-shoulder-injury/)

The network graph for when Saints concede It is much more diffuse than the when Saints score network graph.  There are 15 players in the graph.  The central chunk, clockwise from top (in a sort of diamond shape) are Hurrell, Dodd, Welsby, Clark, Bell, Makinson, Sironen, around a central trio of Lomax, Whitley, and BennisonOutside are Matautia, Knowles, Blake, Wingfield, Delaney. There are 15 players in the network graph. The central chunk, clockwise from top (in a sort of diamond) are Hurrell, Dodd, Welsby, Clark, Bell, Makinson, Sironen, around a central trio of Lomax, Whitley, and Bennison. Outside are Matautia, Knowles, Blake, Wingfield, Delaney 

Again, I think the injury is why Wingfield is out there.

Friday, 12 July 2024

Euro 2024 Final Network Diagram

Looks like this: Two evenly spaced white circles, surrounded by smaller brown circles.  Some brown circles join them in the middle. The labelled version looks like this: Labelled version of the above figure.  England are the white circle at the top and Spain are the white circle at the bottom.  All the other info is below. The thing that really leaps out at me, having done this since Euro 2012 is how much more interconnected the final two teams are. 

In 2012, only one club team, Manchester City, would have had someone on the winning team no matter what. 
In 2024, four teams can say that, Manchester City again, along with Real Madrid, Chelsea and Arsenal. 

Chelsea are the club team closest to the centre. 

Five club teams share the position of "most players left in", Real Madrid, Arsenal, Barcelona, Manchester City and Crystal Palace all have 4 players left in. Crystal Palace is the one that surprises me the most and suggests they have a much better academy system than I suspected. 

As England have got to the final with me not watching, I will continue not to watch lest I am a jinx. It's an odd situation where I have no preferred team, although both teams have a couple of players I really like.

Monday, 8 July 2024

Euro 2024 Network Diagram - It looks like the semifinals could get interesting

I said Spain vs Germany would be close (https://fulltimesportsfan.wordpress.com/2024/07/04/euro-2024-network-diagram-quarterfinals/). And I think the semifinals are going to be even closer. Normally at this stage, there might be an outlier, but this time everyone is evenly spaced. The network graph looks like a compass, with the four teams sitting at the cardinal points. Same diagram but labelled.  If it is a compass, then the Netherland sit at North, France at East, Spain at South and England at West. The community view has got complicated, because the 4 teams make eight communities. Netherlands are the dirty yellow colour, France are green, Spain are pink and England are blue.  The other communities are West Ham in a sort of dark green, Bayern Munich who are an orangey pink, Brentford who are a mauve-ish purple and Atletico Madrid who are a slightly darker blue that is hard to tell apart from England blue (sorry about that) The four countries are their own communities but four teams are also their own communities. They are West Ham in a sort of dark green, Bayern Munich who are an orangey pink, Brentford who are a mauve-ish purple and Atletico Madrid who are a slightly darker blue that is hard to tell apart from England blue (sorry about that). 

The club team closest to the centre are West Ham, Bayer Leverkusen or RB Leipzig. 

There's a real mix of teams with the most representatives still in, but Real Madrid have the most. This is what the list looks like: 
Real Madrid = 7 
Liverpool, Paris Saint-Germain = 6 
Barcelona, Arsenal, Real Sociedad, Manchester City = 5 

I'm not even going to try to predict the semifinals from this.

Thursday, 4 July 2024

Euro 2024 Network Diagrams - Quarterfinals

Okay, so Austria are out, as I suspected they would be. 

For the second Euros in a row, a team they beat in the group stage has gone further than them. But at least it took this absolute stunner of a save for Turkey to beat Austria - https://x.com/EURO2024/status/1808266570327634063 

Of the clear predictions, the diagram was 4/4, and the diagram was part of why I wasn't surprised by Italy or Austria's losses. (I have a series of theories about why the UK press always underestimates Turkey, they are all rude.) 

So, what does the diagram look like now? As expected, the outlying teams all lost, so there's now only the central core teams left. 

Looking at the unlabelled diagram, the central clump is now not as clumped, and one team sticks out to the right.  Network diagram.  While the central clump of teams remains, it is now left shifted, with one team standing slightly separately to the right.Labelled, it looks like this: Labelled version of the figure above.  Around the outside, clockwise, Switzerland are at 12, then Turkey at 3, Portugal at sort of half 5, then England at half 6 and Spain at 7.  Germany are at half 9.  France and the Netherlands are the two teams in the centre of the clockface, with France right in the centre.  Turkey are the team that stick out slightly. France are the team closest to the centre, while AC Milan are the club team closest to the centre. 

The club teams with the most representatives left are Real Madrid and Paris Saint-Germain with 10, Bayern Munich, Barcelona and Manchester City with 9, then Borussia Dortmund and Liverpool with 7 (stop giggling back there about that linkage). 

Inter Milan have been significantly reduced, not just because of Italy going out but also because they had several players in other teams that have been eliminated. 

All the teams are their own community in the community views. Around the outside, clockwise, Switzerland are mauve at 12, then Turkey olive green at 3, Portugal are orange at sort of half 5, then England in pink at half 6 and Spain in grey at 7.  Germany are at half 9 and are sort of turqoise-green.  France (bubblegum blue) and the Netherlands (green) are the two teams in the centre of the clockface, with France right in the centre.  Turkey are the team that stick out slightly. Unlabelled community view diagram, because it looks pretty. 

I can understand why Inter Milan are French in the community view, what with Italy going out, but Manchester City and Manchester United being Portuguese intrigues me. 

Predictions from this (and the reason why I'm writing this while watching the election coverage so it's out before tomorrow): 
Spain vs Germany - Diagram says Germany, just 
Portugal vs France - Diagram says France 
England vs Switzerland - too close to call 
Netherlands vs Turkey - Diagram says Netherlands (this one is the one I think could be an upset. This Turkey team have a vibe.)

Thursday, 27 June 2024

Euro 2024 Network Diagram - Now the group stage community views

I described the group stage diagram as looking like a peacock (https://fulltimesportsfan.wordpress.com/2024/06/15/euro-2024-network-diagram-only-a-day-late/), and I'm amazed how many of the peacock tail survived. Well done Georgia and Romania in particular. 

My prediction for who would go out was Albania, Slovenia, Romania, Georgia, Ukraine and Scotland, then Slovakia and Hungary, with Poland or Austria in place of one of Romania, Slovakia or Ukraine. I was right for 5/8, which I could as going okay. I also hadn't expected Belgium to turn the Group of Cuddly into the Group of Sickos.
  Screenshot from the BBC website showing that group E finished with all 4 teams having 4 points.

The network graphs for the last 16 look like this: Unlabelled network diagram, with a tightly packed core at the bottom left, and four teams trailing out to the right. The central core are still there (mostly, really wasn't expecting Croatia to go out), with four teams trailing out to the right. Labelled, it looks like this: Same diagram but labelled.  The four teams sticking out on the right are Slovakia, Slovenia, Romania and Georgia. Slovakia, Slovenia, Romania and Georgia being so far away from the main core highlights how much of a surprise their going through to the last 16 is. 

Because of the odd weighting, identifying the central team is less valuable than usual. Italy are the national team closest to the centre, and Juventus are the club team closest to the centre. 

The club teams with the most players left in are Inter Milan and Paris Saint-Germain with 12, then Manchester City with 11, then Bayern Munich, Real Madrid and Barcelona 10.

The community view looks like this:   Same figure as before, but coloured by community. Labelled version of that picture. Now each team is it's own community. 

Predictions, as requested by L. 

Spain vs Georgia - diagram says Spain 
Germany vs Denmark - no clear winner on the diagram 
Portugal vs Slovenia - diagram says Portugal 
France vs Belgium - diagram says France 
Romania vs Netherlands - diagram says Netherlands 
Austria vs Turkey - no clear winner on the diagram (I will be crossing my fingers and avoiding the match) 
England vs Slovakia - diagram says England 
Switzerland vs Italy - no clear winner on the diagram 

That central core is tightly packed, which is what's led to that uncertainty.

Saturday, 22 June 2024

Euro 2024 Network Diagram - Now the group stage community views

Because I was trying to race the start of the Euros with my diagrams, I didn't add the community view.

They're below and are quite busy.   Teams in the Euro 2024 tournament coloured by community Same diagram as previous but unlabelled There are 20 communities for 24 teams. 

Belgium and Denmark share a community because both teams have players that play for Anderlecht. France and Portugal share a community because of their Paris Saint Germain players.  
Then there's Albania and Croatia, and despite almost being on opposite sides of the diagram, Austria and Hungary are one group.

Saturday, 15 June 2024

Euro 2024 Network Diagram - Only a day late

(Stuff, still happening. Everything, still late.) 

So after OMG! 12 years of doing this, I know what shape I am expecting from this sort of thing. 

I am expecting a central tight core, surrounded by others (like the diagram below). A circle of blue circles surrounded by a circle of red circles. 

Now sometimes, the cluster is shifted and tighter at one point rather than the centre, like at the Women's World Cup 2023 (https://fulltimesportsfan.wordpress.com/2023/07/22/womens-world-cup-2023-group-stage-network-diagrams/), but what I didn't expect is what this one looks like. 

I've made a simplified description below because having 24 teams with 26* players each makes the diagram really busy. (* Except France and Belgium, because ... actually does anyone know why?) A circle of blue circles, three-quarters surrounded by red circles. 

So there's one cluster, and the other, less connected, teams splay out like a peacock's tail.

This is what the real one looks like:   Same shape as the circle surrounded by three-quarters but with more circles and a lot more lines and links. The same diagram, but now labelled, which only makes it busier. The same diagram as previously, but labelled.  The teams in the tight cluster are, in no particular order, Czech Republic, Serbia, Croatia, Italy, Poland, Turkey, Belgium, Austria, Netherlands, Denmark, Switzerland, Germany, France, Portugal, Spain and England.  The teams around them are, clockwise from the equivalent of 11, Albania, Slovenia, Romania, Georgia, Hungary, Ukraine and Scotland. 

It does make identifying the central team less worthwhile than usual. 

That team are Italy. 

Turkey are a lot closer to the cluster centre than I expected. 

One of Fulham, Tottenham Hotspur and Atletico Madrid are the club team closest to the centre. 

The clubs with the most representatives are Inter Milan and Manchester City with 13. The come Real Madrid, Barcelona and Paris Saint Germain with 12, the Bayern Munich and RB Leipzig with 11. 

Interestingly, a lot of Barcelona and Real Madrid players are not playing for Spain and we've definitely moved on from the days where Spanish players played for either one or the other. 

I am not even getting into the whole thing about 3 different club teams all being Red Bull teams (not least because I have a whole post about it here - https://fulltimesportsfan.wordpress.com/2023/03/29/in-which-we-know-that-uefa-wont-do-anything-about-dual-ownership-but-a-girl-can-dream/). 

Prediction: From the diagram, I think the 8 teams that will be eliminated will be Albania, Slovenia, Romania, Georgia, Ukraine and Scotland, then Slovakia and Hungary. 

You'll note that includes none of the group D teams, supporting the theory that it really is a group of Death!!! I suspect one of Poland and Austria will be out instead of Ukraine. Group E more like the group of cuddly if you're Belgium.

Monday, 3 June 2024

Saints Ahoy - Visualisations from game 7 and the season to date

(Sorry for the break, RL happened with a vengeance) 

The most important thing about Easter weekend was that the forces of Good (Saints) beat the forces of Evil (Wigan) in the Good Friday game, somewhat against the run of form. 

In the sort of derby where it was 2-0 at half time, 3 people went off for Head Injury Assessments and there was somehow only 1 yellow card 

https://www.saintsrlfc.com/2024/03/29/saints-defeat-wigan-on-good-friday/ https://twitter.com/SuperLeague/status/1773756078875959601 - Tommy, Tommy Mak 

Those are the important rugby points ;) 

There is still no obvious pattern to when Saints score Bar chart showing when Saints score.  There are a couple of points where they have scored two points but no obvious pattern has emerged. Percival and Lomax, the kickers, are still the people with the highest number of point-scoring moments, as expected. Tommy Makinson is still doing his thing (Tommy Tommy Mak!) Percival has still has the most point-scoring moments with 11, then Lomax with 9.  Mbye, Matautia, Knowles, Hurrell and Blake have one each. But there's also no pattern to when they score. Bar chart of when Saints score, coloured by scorer. Only 3 players have been present for all point-scoring moments, Whitley, Welsby and Lomax. Bar chart showing which Saints players have been present when they scored.  Three players have been present for all point-scoring moments, Whitley, Welsby and Lomax who have been present for all 48.  Davies has been present for the least, with 4. In the matrix, the cluster of always theres has moved into the middle, possibly because there's so few of them. The purple in the middle is the ever-presents.  Paler means present together less often. There are now 19 people in the present when Saints score network graph, a central 15, plus Mbye, Lees, Knowles and Walmsley stuck out from them. Network graph.  There are a central 15 players and 4 around the outside.  The 4 around the outside are Mbye, Lees, Knowles and Walmsley. Moving over to when Saints concede. Our three ever presents are here as well but Bennison is there as well, which is unexpected. Not sure if he's just been unfortunate to be on the pitch when Saints are short-handed, or if I need to start shouting about defensive practise. Purple is the players who are together often when Saints concede.  Whitley, Welsby and Lomax are there as expected, but there is an extra purple line for Bennison. The network diagram for when Saints concede now has 13 players. The thirteen players in the present when Saints concede diagram are Bennison, Bell, Wingfield, Makinson, Welsby, Sironen, Lomax, Blake, Whitley, Delaney, Clark and Dodd, with Hurrell sticking out to the left. ~~~~ 
Given the sad news - Rugby league legend Burrow dies aged 41 (https://www.bbc.co.uk/sport/rugby-league/articles/c2qqwvwzp5zo) - if you like these posts and have a few quid to spare, there's a couple of funds that could do with donations: 
Motor Neurone Disease Association - https://www.justgiving.com/campaign/robburrow 
Rob Burrow fund - https://www.gofundme.com/f/leeds-players-association-supporting-rob-burrow Leeds Hospital Charity - https://www.leedshospitalscharity.org.uk/donate/mnd-centre-appeal